Automating the DFIR Triage Loop With Memory Forensics and LLMs
DFIR-Chain automates forensic triage by combining Volatility, YARA, and LLMs to turn artifacts into coherent incident narratives in minutes, not hours.
Join the DZone community and get the full member experience.
Join For FreeMost modern security operations centers (SOCs) face a problem of speed and volume of data collection. While collecting data is no longer the issue in many cases, analyzing it is — especially during high-priority incidents.
To collect forensic evidence in many cases, analysts manually run multiple tools: Volatility for memory dumps, YARA for malware signatures, and strings for basic text search. Each tool creates a different output. The combination of all of those outputs is required for meaningful analysis. Manual correlation of these outputs is time-consuming and error-prone. Manual correlation of forensic outputs also contributes to alert fatigue — when the number of alerts becomes so large that they cannot be reasonably processed by humans.
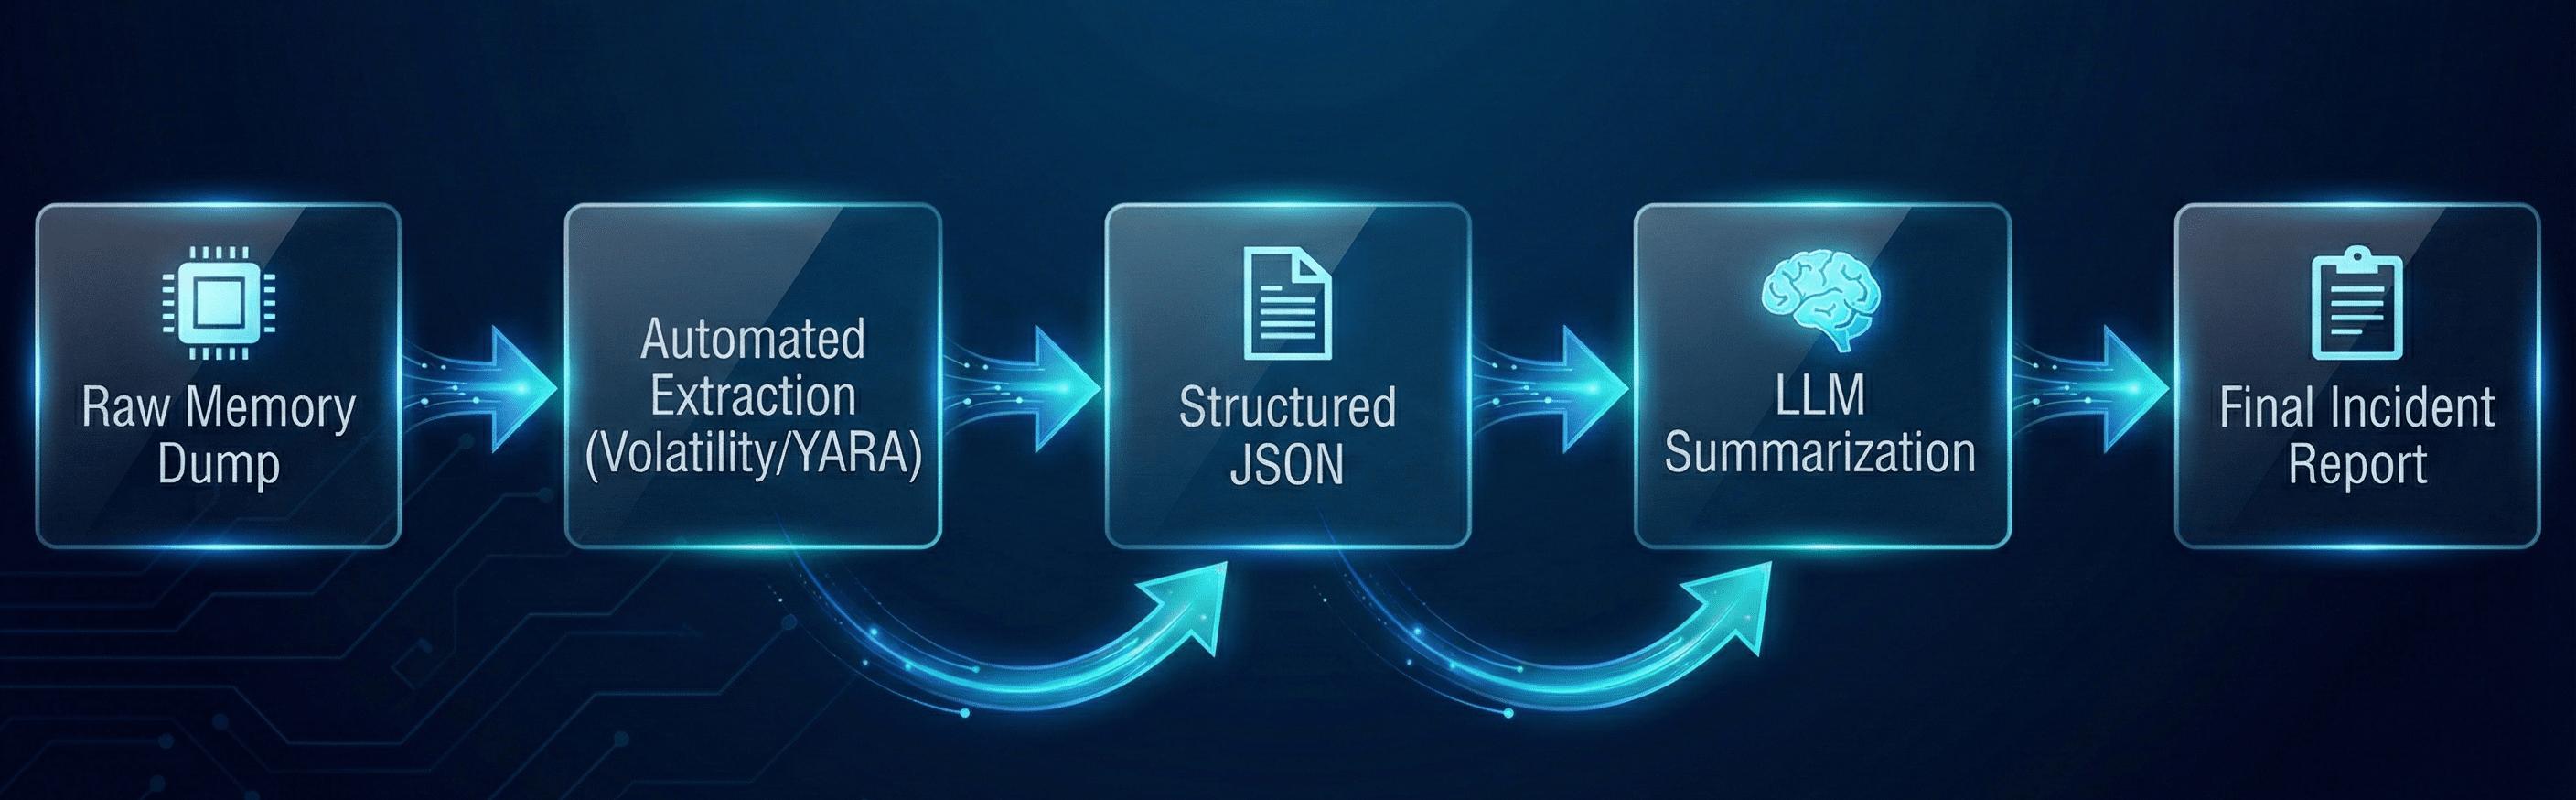
DFIR-Chain is an automated triage architecture that uses memory forensics, artifact extraction, and large language models (LLMs) to create a coherent incident narrative from forensic artifacts in minutes, not hours. Instead of viewing forensic artifacts as unstructured text, we view them as structured inputs to an LLM.
The Problem: “Stare At the Hex” Bottleneck
Many memory forensic workflows look something like this:
- Capture RAM: The analyst captures a memory image of size 16 GB+.
- Run plugins: The analyst executes windows.pslist, windows.netscan, and windows.filescan separately.
- Manual correlation: The analyst manually copies and pastes Process IDs (PIDs) to find out if the suspicious process svchost.exe (PID 442) opened a socket to a known bad IP.
- Reporting: The analyst writes a ticket describing their findings.
This type of “manual-middleware” approach has serious scalability limitations. To address this limitation, we must develop an engineering approach — a pipeline that extracts, structures, and narrates.
Phase 1: Automated Ingestion (“Hands”)
The first phase is to automate the extraction of “gold” artifacts — the high-value signals buried in the noise of a memory dump. We can utilize Python to wrap Volatility 3 and YARA into a single extraction program.
Rather than manually executing command-line interface (CLI) commands, we will create a “Triage Profile” that automatically executes key plugins and dumps the resulting output into JSON format.
The Extraction Program
This Python program uses the Volatility 3 library to programmatically extract process lists and network connections from a memory dump.
import volatility3.plugins.windows.pslist as pslist
import volatility3.plugins.windows.netscan as netscan
from volatility3.framework import contexts, automagic
from volatility3.framework import interfaces
import json

def automated_triage(memory_dump_path):
    # Set up the Volatility Context
    ctx = contexts.Context()
    ctx.config['automagic.LayerStacker.single_location'] = memory_dump_path
    automagic.choose_automagic(automagic.available(ctx), ctx)

    results = {}

    # 1. Execute Process List Plugin
    print("[*] Extracting Process List...")
    plugin = pslist.PsList(ctx, ctx.config)
    proc_list = plugin.run()

    # Prepare the output for the LLM
    results['processes'] = []
    for row in proc_list:
        results['processes'].append({
            "pid": row.UniqueProcessId,
            "name": row.ImageFileName.cast("string", encoding='utf-8', errors='replace'),
            "ppid": row.InheritedFromUniqueProcessId,
            "create_time": str(row.CreateTime)
        })

    # 2. Execute Network Scan Plugin
    print("[*] Extracting Network Connections...")
    net_plugin = netscan.NetScan(ctx, ctx.config)
    net_list = net_plugin.run()

    results['network'] = []
    for row in net_list:
        results['network'].append({
            "src_ip": row.LocalIpAddress,
            "dst_ip": row.ForeignIpAddress,
            "state": row.State,
            "pid": row.Owner
        })

    return results

# Save the extracted data to a JSON file for the next phase
triage_data = automated_triage("infected_dump.mem")

with open("triage_artifacts.json", "w") as f:
    json.dump(triage_data, f, indent=4)
Key engineering decision: We are not saving the entire raw output. We are filtering for fields that the LLM can use (PID, Name, Parent PID, IP Address). Sending 1 GB of raw text to an LLM context window is expensive, and it introduces noise (hallucinations).
Phase 2: The Logic Layer (“Brain”)
Raw JSON is still difficult to read. Prior to sending this to an LLM, we need a logic layer to enhance the data. This is where we apply deterministic rules — things we know are bad — so the LLM doesn’t have to guess.
For example, we could use YARA to scan the memory of the process identified in Phase 1 with a known malicious signature.
import yara

def scan_process_memory(pid, memory_dump_path, rule_path):
    rules = yara.compile(filepath=rule_path)

    # In a real-world implementation, you would carve the process memory space
    # using Volatility before passing it to YARA.
    # Here, we simulate scanning a dumped process memory file.
    matches = rules.match(pid_dump_file)

    return [match.rule for match in matches]
Data Normalization
The most important part is normalization. If Volatility states the PID is 4096, and the Network Scan states the owner is 4096, then we merge both into a single “Entity” object.
- Entity: svchost.exe (PID 4096)
- Behavior: Began execution at 02:00 AM
- Network: Established a connection to 192.168.1.55 (Port 443)
- YARA: Identified APT_Ghost_Rat
This pre-correlated object is the one we will pass to the LLM.
Phase 3: LLM Summary (“Voice”)
At this point, we have a structured, enhanced JSON object. The purpose of the LLM is not to “identify” the malware (YARA already did), but to provide the human analyst with a coherent incident timeline.
Context-Aware Prompt
The prompt should be designed to avoid “creative writing.” We desire a factual summary.
System role: You are a Tier 3 Digital Forensics Analyst. Your role is to provide a summary of forensic artifacts into a coherent incident timeline. Do not make any assumptions. Use only the data in the provided JSON.
Input:
{
  "suspect_process": "powershell.exe",
  "pid": 5521,
  "parent": "explorer.exe",
  "network": "10.0.0.5 -> 185.x.x.x:443 (ESTABLISHED)",
  "yara_matches": [
    "Suspicious_PowerShell_WebClient"
  ]
}
Task: Provide a 3-sentence summary of this activity.
Output:
Using this pipeline, the system provides the human analyst with a readable summary of the activity:
“At 02:14:55 UTC, a process named ‘powershell.exe’ (PID 5521) was launched by ‘explorer.exe’. Immediately after its launch, the new process created a network connection to the remote IP 185.x.x.x on port 443. LLM scans found the ‘Suspicious_PowerShell_WebClient’ signature, suggesting that the new process may be establishing a C2 communication channel.”
Architecture Limitations and Guardrails
While this automation significantly reduces the triage time, engineers must implement guardrails:
- Hallucination checks: Never allow the LLM to generate file hashes or IP addresses not present in the original JSON. Develop a post-processing script that regex-matches each IP in the LLM’s response against the original JSON. If the IP is not found in the original JSON, mark the summary as “Unreliable.”
- Privacy deidentification: Before sending logs to an outside LLM service (OpenAI or Anthropic), deidentify any PII in your logs. If you require data sovereignty, consider utilizing a local LLM (Llama-3-8b) trained on security logs.
- Context window management: Don’t send the full string output of strings.exe. It is too long, and too much is junk. Only send high-confidence indicators.
Conclusion
Automating DFIR is not about replacing the human analyst — it is about giving the analyst a head start. By chaining Volatility for extraction, YARA for identification, and LLMs for summary, we convert a 2-hour manual triage process into a 5-minute automated report. This enables the human analyst to concentrate on the “why” and “how” of the attack — rather than the “what”.
Opinions expressed by DZone contributors are their own.
Comments