Azure Observability
In this article, we will explore Azure Observability, the difference between monitoring and observability, its components, different patterns, and antipatterns.
Join the DZone community and get the full member experience.
Join For FreeIn this article, we will explore Azure Observability, the difference between monitoring and observability, its components, different patterns, and antipatterns.
Azure Observability is a powerful set of services provided by Microsoft Azure that allows developers and operations teams to monitor, diagnose, and improve the performance and availability of their applications. With Azure Observability, you can gain deep insights into the performance and usage of your applications and quickly identify and resolve issues.
Azure Monitoring and Azure Observability
Azure Monitoring and Azure Observability are related but different concepts in the Azure ecosystem.
Azure Monitor is a service that provides a centralized location for collecting and analyzing log data from Azure resources and other sources. It includes features for collecting data from Azure services such as Azure Virtual Machines, Azure App Services, and Azure Functions, as well as data from other sources such as Windows Event Logs and custom logs. The service also includes Azure Log Analytics, which is used to analyze the log data and create custom queries and alerts.
Azure Observability, on the other hand, is a broader concept that encompasses a set of services provided by Azure for monitoring, diagnosing, and improving the performance and availability of your applications. It includes Azure Monitor but also encompasses other services such as Azure Application Insights, Azure Metrics, and Azure Diagnostics.
Azure Monitor is a service that provides log data collection and analysis, while Azure Observability is a broader set of services that provides deep insights into the performance and availability of your application. Azure Observability is built on top of Azure Monitor, and it integrates with other services to provide a comprehensive view of your application's performance.
Key Components of Azure Observability
One of the key components of Azure Observability is Azure Monitor. This service provides a centralized location for collecting and analyzing log data from Azure resources and other sources. It includes features for collecting data from Azure services such as Azure Virtual Machines, Azure App Services, and Azure Functions, as well as data from other sources such as Windows Event Logs and custom logs. This allows you to have a comprehensive view of your environment and understand how your resources are performing.
Another important component of Azure Observability is Azure Log Analytics. This service is used to analyze the log data collected by Azure Monitor and to create custom queries and alerts. It uses a query language called Kusto, which is optimized for large-scale data analysis. With Azure Log Analytics, you can easily search and filter through large amounts of log data and create custom queries and alerts to notify you of specific events or issues.
Azure Application Insights is another service provided by Azure Observability. This service provides deep insights into the performance and usage of your applications. It can be used to track requests, exceptions, and performance metrics and to create custom alerts. With Azure Application Insights, you can gain a better understanding of how your users interact with your applications and identify and resolve issues quickly.
Azure Metrics is another service provided by Azure observability. It allows you to collect and analyze performance data from your applications and services, including CPU usage, memory usage, and network traffic. This will give you a real-time view of your resource's performance and allow for proactive monitoring.
Finally, Azure Diagnostics is a service that is used to diagnose and troubleshoot issues in your applications and services. It includes features for collecting diagnostic data, such as performance counters, traces, and logs, and for analyzing that data to identify the root cause of issues. With Azure Diagnostics, you can quickly identify and resolve issues in your applications and services and ensure that they are performing optimally.
Example: Flow of Observability Data From an Azure Serverless Architecture
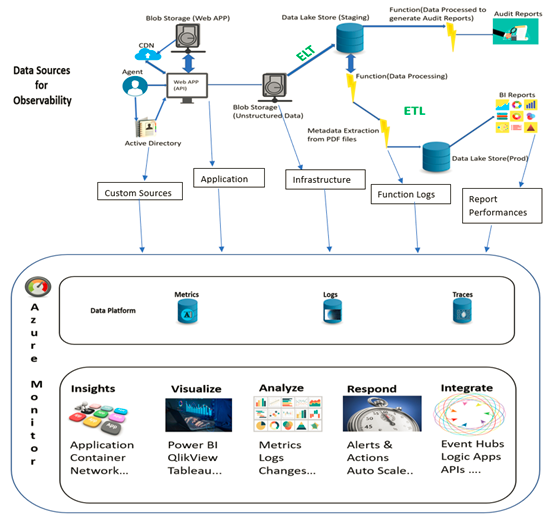
An example of using Azure Observability to monitor and improve the performance of an application would involve the following steps:
Enabling Azure Monitor for your application: This involves configuring Azure Monitor to collect log data from your application, such as requests, exceptions, and performance metrics. This data can be collected from Azure services such as Azure App Services, Azure Functions, and Azure Virtual Machines.
Analyzing log data with Azure Log Analytics: Once data is collected, you can use Azure Log Analytics to analyze the log data and create custom queries and alerts. For example, you can create a query to identify all requests that returned a 500-error code and create an alert to notify you when this happens.
Identifying and resolving performance issues: With the data collected and analyzed, you can use Azure Application Insights to identify and resolve performance issues. For example, you can use the performance metrics collected by Azure Monitor to identify slow requests and use Azure Diagnostics to collect additional data, such as traces and logs, to understand the root cause of the issue.
Monitoring your resources: With Azure Metrics, you can monitor your resource's performance and understand the impact on the application. This will give you a real-time view of your resources and allow for proactive monitoring.
Setting up alerts: Azure Monitor, Azure Log Analytics, and Azure Application Insights can set up alerts; this way, you can be notified of any issues or potential issues. This will allow you to act before it becomes a problem for your users.
Continuously monitoring and improving: After resolving the initial issues, you should continue to monitor your application using Azure Observability to ensure that it is performing well and identify any new issues that may arise. This allows you to continuously improve the performance and availability of your application.
Observability Patterns
Azure Observability provides a variety of patterns that can be used to monitor and improve the performance of your application. Some of the key patterns and metrics include:
Logging: Collecting log data such as requests, exceptions, and performance metrics and then analyzing this data using Azure Monitor and Azure Log Analytics. This can be used to identify and troubleshoot issues in your application and to create custom queries and alerts to notify you of specific events or issues.
Tracing: Collecting trace data such as request and response headers and analyzing this data using Azure Diagnostics. This can be used to understand the flow of requests through your application and to identify and troubleshoot issues with specific requests.
Performance monitoring: Collecting performance metrics such as CPU usage, memory usage, and network traffic and analyzing this data using Azure Metrics. This can be used to identify and troubleshoot issues with the performance of your application and resources.
Error tracking: Collecting and tracking errors and exceptions and analyzing this data using Azure Application Insights. This can be used to identify and troubleshoot issues with specific requests and to understand how errors are impacting your users.
Availability monitoring: Collecting and monitoring data related to the availability of your application and resources, such as uptime and response times, and analyzing this data using Azure Monitor. This can be used to identify and troubleshoot issues with the availability of your application.
Custom metrics: Collecting custom metrics that are specific to your application and analyzing this data using Azure Monitor and Azure Log Analytics. This can be used to track key performance indicators (KPIs) for your application and to create custom alerts.
All these patterns and metrics can be used together to gain a comprehensive understanding of the performance and availability of your application and to quickly identify and resolve issues. Additionally, Azure Observability services are integrated; this way, you can easily correlate different data sources and have a holistic view of your application's performance.
While Azure Observability provides a powerful set of services for monitoring, diagnosing, and improving the performance of your applications, there are also some common mistakes/contrasts that should be avoided to get the most out of these services. Here are a few examples of Azure Observability contrasts:
Not collecting enough data: Collecting insufficient data makes it difficult to diagnose and troubleshoot issues and can lead to incomplete or inaccurate analysis. Make sure to collect all the relevant data for your application, including logs, traces, and performance metrics, to ensure that you have a comprehensive view of your environment.
Not analyzing the data: Collecting data is not enough; you need to analyze it and act. Not analyzing the data can lead to missed opportunities to improve the performance and availability of your applications. Make sure to use Azure Monitor and Azure Log Analytics to analyze the data, identify patterns and issues, and act.
Conclusion
In summary, Azure observability architecture is a set of services that allows for data collection, data analysis, and troubleshooting. It provides a comprehensive set of services that allows you to monitor, diagnose, and improve the performance and availability of your applications. With Azure Observability, you can gain deep insights into your environment and quickly identify and resolve issues, ensuring that your applications are always available and performing at their best.
Opinions expressed by DZone contributors are their own.
Comments