Observability With eBPF
Take an in-depth look at eBPF, a technology that allows you to run sandboxed programs within the Linux kernel.
Join the DZone community and get the full member experience.
Join For FreeeBPF is a groundbreaking technology that allows you to run sandboxed programs within the Linux kernel. This provides a safe and efficient way to extend the kernel's capabilities without modifying its source code.
High-Level Overview
Below is an overview of the stack:
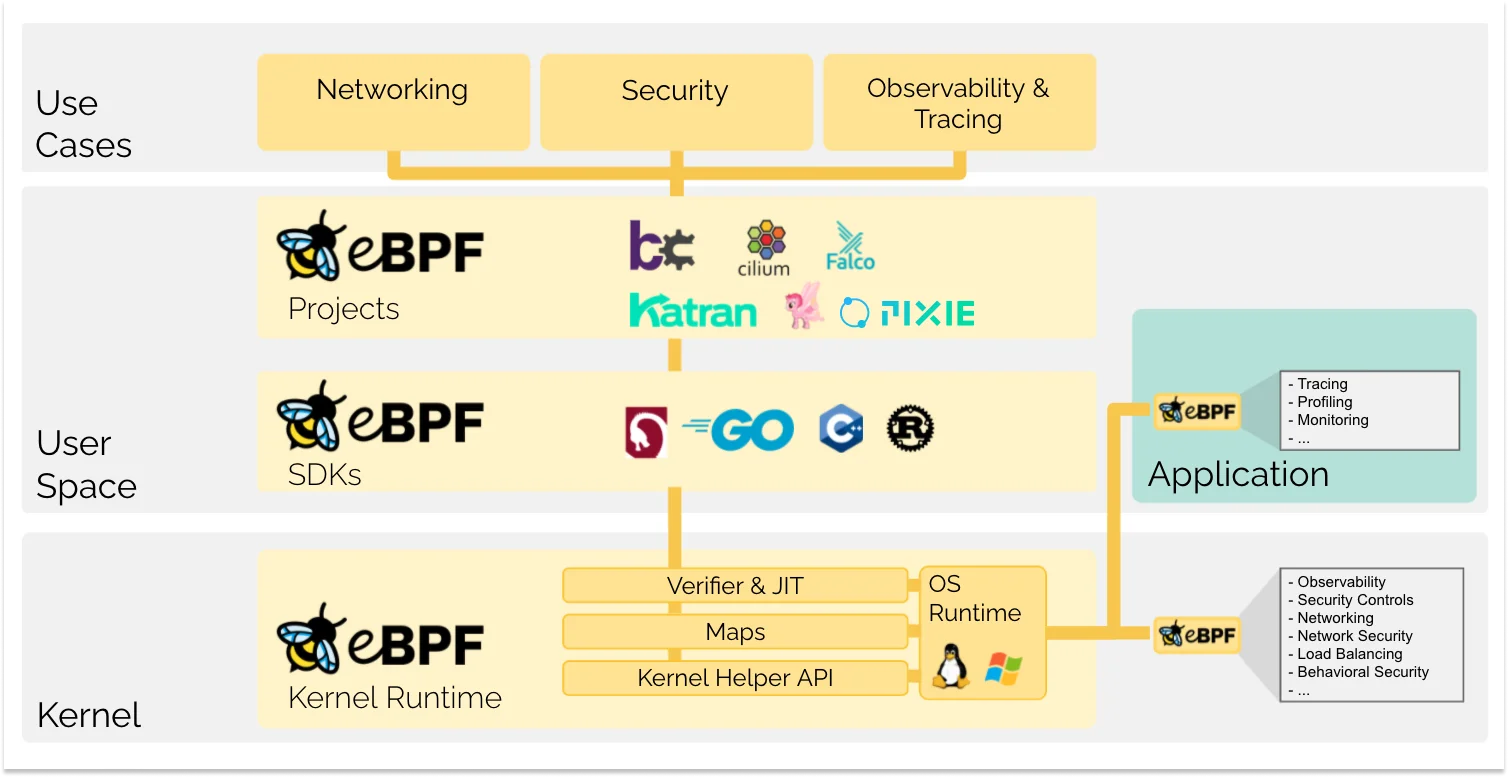
Interception Points and Probes
eBPF programs are triggered by events and execute when the kernel or an application reaches a specified interception point. Standard interception points include system calls, function starts/ends, kernel tracepoints, network events, among others.
Should there be no existing interception point for a specific requirement, one has the option to establish a kernel probe (kprobe) or user probe (uprobe), enabling the attachment of eBPF programs virtually anywhere within the kernel or user applications.
Once the appropriate interception point is pinpointed, the eBPF program can be introduced into the Linux kernel through the bpf system call, commonly facilitated by one of the eBPF libraries.
Often, eBPF is employed not directly, but through frameworks such as Cilium, bcc, or bpftrace. These frameworks offer a layer of abstraction over eBPF, removing the need to write programs from scratch and instead allowing for the definition of intent-based directives that are then executed via eBPF.
In instances where no such abstraction layer is available, it becomes necessary to author programs directly. The Linux kernel mandates that eBPF programs be submitted as bytecode. Although it's technically feasible to code in bytecode directly, the prevalent practice is to use a compiler suite like LLVM to transmute pseudo-C code into eBPF bytecode.
Load, Verification, and Compilation
Upon loading into the Linux kernel, the eBPF program undergoes a two-stage process before being linked to the chosen interception point.
Firstly, a verification phase confirms the safety of the eBPF program. This phase checks that the program adheres to various criteria, such as:
- The entity loading the eBPF program possesses the necessary capabilities (privileges). In the absence of enabled unprivileged eBPF, only privileged entities can load eBPF programs.
- The program is stable and does not jeopardize the system.
- The program is guaranteed to complete its execution (i.e., it won't enter an infinite loop, thereby stalling further processes).
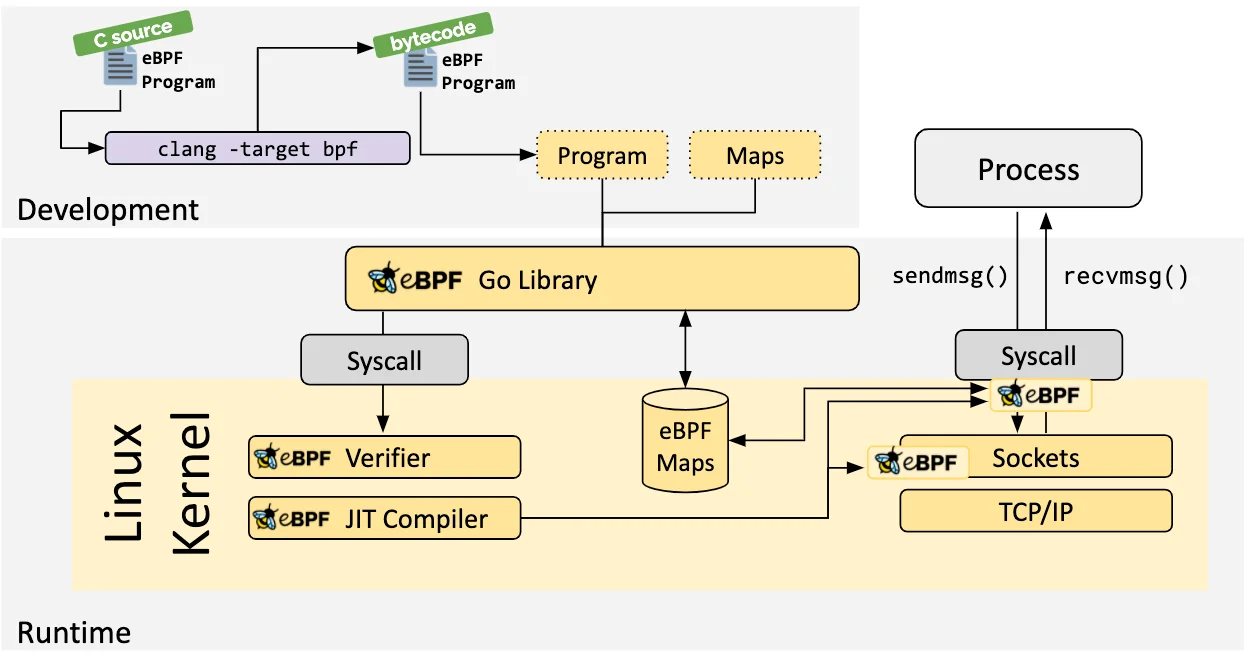
The Just-in-Time (JIT) compilation step translates the generic bytecode of the program into the machine specific instruction set to optimize execution speed of the program. This makes eBPF programs run as efficiently as natively compiled kernel code or as code loaded as a kernel module.
eBPF maps are like data structures that can be accessed both from within eBPF programs and from user-space applications using a system call. This allows eBPF programs to share information and store state.
Why Use eBPF for O11y?
- Performance: Since eBPF runs in the kernel and doesn’t need to switch between user space and kernel space frequently, it is highly efficient and has very low overhead.
- Flexibility: eBPF can be used for various use cases like network monitoring, security enforcement, debugging, and performance tuning.
- Non-intrusive: eBPF can gather detailed system data without modifying application code or rebooting the system.
Example: Tracing File Opens With eBPF
Imagine you want to monitor and trace every time a process opens a file on your system. eBPF can achieve this by hooking into the openat() syscall (a system call used to open files in Linux) and providing real-time insights without affecting system performance.
Here's a simple step-by-step example using bcc (BPF Compiler Collection), a popular front-end for writing eBPF programs:
Step 1: Install bcc
First, you need to install bcc tools on your system. For example, on Ubuntu:
sudo apt-get install bpfcc-tools linux-headers-$(uname -r)Step 2: Write a Simple eBPF Program
This eBPF program traces the openat() syscall, logs the process ID (PID), process name, and file path each time a file is opened.
#!/usr/bin/python

from bcc import BPF

# eBPF program that hooks into the openat syscall
bpf_code = """
#include <uapi/linux/ptrace.h>
#include <linux/sched.h>

struct data_t {
    u32 pid;
    char comm[TASK_COMM_LEN];
    char fname[256];
};

BPF_PERF_OUTPUT(events);
int trace_openat(struct pt_regs *ctx, int dfd, const char __user *filename, int flags) {
    struct data_t data = {};

    // Capture process ID and name
    data.pid = bpf_get_current_pid_tgid() >> 32;
    bpf_get_current_comm(&data.comm, sizeof(data.comm));

    // Capture file name
    bpf_probe_read_user(&data.fname, sizeof(data.fname), filename);

    // Send the data to user-space
    events.perf_submit(ctx, &data, sizeof(data));
    return 0;
}
"""
# Load the eBPF program
b = BPF(text=bpf_code)

# Attach eBPF program to the openat syscall
b.attach_kprobe(event="sys_openat", fn_name="trace_openat")

# Function to print the output
def print_event(cpu, data, size):
    event = b["events"].event(data)
    print(f"PID: {event.pid}, Process: {event.comm.decode('utf-8')}, File: {event.fname.decode('utf-8', 'replace')}")

# Open a perf buffer to receive events from kernel space
b["events"].open_perf_buffer(print_event)

# Continuously listen for events and print them
while True:
    b.perf_buffer_poll()
Step 3: Explanation of the Code
- Hooking the syscall: The eBPF program hooks into the
openat()system call usingkprobes(kernel probes). This allows the program to execute whenever any process callsopenat()to open a file. - Data collection: The eBPF program captures the process ID, process name (
comm), and the name of the file being opened. It uses helper functions likebpf_get_current_comm()to get the process name andbpf_probe_read_user()to read the filename from user space. - Sending data to user-space: The eBPF program uses a perf buffer (
events.perf_submit()) to send this data from the kernel space back to the user-space, where we print the information. - User-space script: The Python script attaches the eBPF program to the
openat()syscall and prints out the data collected from kernel space, such as the process name and file being opened.
Step 4: Running the eBPF Program
Once you run the script with root privileges, you will see output like this:
PID: 12345, Process: bash, File: /etc/passwd
PID: 12346, Process: vim, File: /home/user/file.txt
PID: 12347, Process: python, File: /tmp/log.txt
This means that whenever any process opens a file, the script captures and displays:
- PID: Process ID that opened the file
- Process name: The name of the process (e.g.,
bash,vim) - File path: The path of the file being opened
This example shows how eBPF can be used for real-time monitoring of system events (in this case, file opens) with minimal performance impact.
Best Practices for Non-Invasive Observability With eBPF
1. Start Small and Gradually Increase Scope
Begin by observing high-level metrics (e.g., syscall counts or network traffic) rather than capturing detailed information such as individual function calls. Once you’re confident about performance impacts, gradually expand to more detailed probes.
2. Use Existing Tools Before Writing Custom eBPF Programs
Tools like bcc (BPF Compiler Collection) or bcc-tools, bpftrace, and libbpf offer pre-built solutions for observability and reduce the risk of writing unsafe or inefficient eBPF programs. Examples:
execsnoopfor tracing process executionopensnoopfor tracing file open eventstcptracerfor observing TCP connections
3. Minimize Overhead by Selecting Efficient Probes
Avoid attaching eBPF programs to high-frequency events (like scheduler-related events or network packet processing) unless necessary. Instead, focus on infrequent events such as specific syscalls or functions. Use kprobes and tracepoints selectively to avoid overhead. Prefer tracepoints when available, as they are designed for observability and impose less overhead.
4. Leverage BPF Maps Effectively
eBPF programs use BPF maps to store and share data between the kernel and user space. Choose appropriate map types (e.g., hash maps, arrays) and ensure they are properly sized to avoid memory overhead. Implement strategies to batch data collection and reduce the frequency of user-space reads.
5. Rate-Limiting and Filtering
Implement rate-limiting in eBPF programs to prevent excessive data collection during high-frequency events.Use filtering to target only specific events or processes, thus reducing the amount of data being collected and processed.
6. Minimize Probe Execution Time
eBPF programs should be designed to run in a short and bounded time to avoid affecting system performance. Kernel enforces time limits on eBPF programs, but even approaching these limits can degrade performance. Avoid complex logic and loops in your eBPF code to ensure that it runs quickly.
7. Monitor Overhead Carefully
Always monitor the overhead introduced by eBPF programs. The Linux kernel provides tools like bpftool to inspect and measure the performance impact of eBPF programs. Measure the following:
- Latency of the observed application
- CPU utilization increase due to eBPF programs
- Memory usage of BPF maps
8. Use BPF Type Format (BTF) for Compatibility
Utilize BTF (BPF Type Format) to ensure that your eBPF programs are portable and work across different kernel versions. BTF allows eBPF programs to access kernel internals without requiring version-specific modifications.
9. Ensure Safety With Verifier Compliance
The kernel’s eBPF verifier ensures the safety of eBPF programs by analyzing them before they are loaded. Keep programs simple and avoid unsafe operations, such as accessing uninitialized data or performing out-of-bounds memory accesses, which could cause verifier failures.
10. Stay Updated With Kernel Versions
The eBPF ecosystem evolves quickly, and newer kernel versions often bring optimizations and new features that improve the performance and safety of eBPF programs. Consider running a newer kernel (e.g., 5.x or later) to benefit from these improvements.
11. Use Off-Critical-Path Data Collection
Where possible, move data collection and heavy processing off the critical path. For example, collect minimal data in the eBPF probe itself and offload more detailed processing to user-space applications.
12. Security Considerations
Make sure eBPF programs are used in a secure manner. Since eBPF operates at the kernel level, improperly written or malicious programs can expose the system to vulnerabilities. Leverage cgroup BPF or LSM BPF to control and restrict eBPF programs.
By adhering to these best practices, you can effectively leverage eBPF for observability without introducing significant overhead or risk to the system. Always focus on simplicity, efficiency, and safety when designing and deploying eBPF programs.
Opinions expressed by DZone contributors are their own.
Comments