The Human Side of Logs: What Unstructured Data Is Trying to Tell You
Metrics show what happened. Unstructured data shows why. In this article, we learn why we don’t just ignore the messy signals.
Join the DZone community and get the full member experience.
Join For FreeIt’s Friday afternoon, and your dashboards look great. Charts are green. CPU usage is stable. Database query times are within your SLA. You’re feeling great and ready for the weekend.
But little do you know, there’s a significant issue being overlooked by all your metrics — and it’s about to ruin your weekend.
Unfortunately, you don’t know about the problem yet. That’s because there’s a disparity between your metrics and the actual user experience. Your dashboards might look great, but your users are telling a different story.
It happens to even the best of us. On April 17, 2025, for example, Walmart's website experienced a significant outage. Users were unable to add items to their carts or access certain pages. Revenue was lost, user complaints surged on X and Downdetector, and undoubtedly someone was woken up from a deep sleep to log on and help get it fixed.
Critical signals don’t always show up in CPU graphs or 5xx error charts. They surface in chat threads, Downdetector complaints, and even failed login attempt logs. The first signals often come from people, not probes.
Why? Because traditional monitoring tools focus on structured data, such as CPU usage, memory consumption, database usage, and network throughput. And while these metrics are essential, they can miss the nuances of user behavior and experience.
But unstructured data, such as error messages, user feedback, and logs, can tell a more thorough story. It can provide critical insights into system issues that structured data can overlook and that you otherwise wouldn’t know about — until it’s too late.
The signs are there — if you're listening.
In this article, I’ll explore why unstructured data matters, where you should look for unstructured data, what signals to watch for, and how observability platforms can help you tap into unstructured data without drowning you in noise.
Why Unstructured Data Matters
Structured data is the data that comes in the formats you expect — rows, columns, numbers, stats — and tells you all about what logically happened. It’s the duration of an API call, the response status code, or the CPU load on a node.
Unstructured data, on the other hand, is the messy data. And it’s everywhere. It can be found in support tickets, bug reports, chat threads, error messages, and offhand complaints. It’s the data that often arrives in natural language, not numeric values. It’s messy, not always clear in meaning, and as the name suggests, it’s unstructured.
But unstructured data is critical. It tells you where confusion lives, where intent breaks down, and where the user’s mental model clashes with what the software does. It captures the emotions, intentions, and frustrations that users feel when systems misbehave.
And when ingested, interpreted, and aggregated, important patterns can emerge. For example, unstructured data can start to paint a picture if your app is seeing:
- A surge in password reset attempts
- Rage clicks after a UI release
- A sudden drop in engagement
-
Support tickets clustered around a broken journey
Sometimes your best clues aren’t in the metrics — they’re in this unstructured data. Structured observability gives you the dashboard. Unstructured data gives you the story. And if you're not reading both, you're missing half the plot.
What Signals Should You Watch For?
So, where should you look for unstructured data, and what should you watch for? There are many sources. Here are a few to start:
- Pay attention to session logs that show users repeatedly attempting the same action. That’s not just a retry — it’s friction.
- Watch for freeform error messages that never get piped into your dashboard. That’s often where the real context behind a failure lives.
- Don’t ignore the chatter on Slack, Jira, or even social media. When three engineers complain about the same “sluggish page,” chances are there’s a performance regression in your latency graph smoothed over.
- Even vague user feedback can be invaluable. A spike in “can’t log in” support tickets may be attributed to session expiry handling, rather than infrastructure failure. You’ll only catch it if you’re collecting and analyzing the whole narrative — system logs, yes, but also what people say and do when something doesn’t work the way they expect.
- Watch for security anomalies. Failed login attempts, credential stuffing, token mismatches — these may not trigger alarms if thresholds aren’t breached, but patterns buried in raw logs can signal a threat weeks before your SIEM lights up.
How Observability Platforms Can Wrangle Unstructured Data
One of the biggest misconceptions about unstructured data is that it has to be cleaned, labeled, and modeled before it’s useful.
Yes, that was true in the past. Teams often spend hours writing regular expressions or building brittle parsers just to extract a few fields from a messy log line.
But that’s no longer the case.
Modern observability platforms are designed to ingest unstructured data at scale without requiring perfect formatting or predefined schemas. You can pump in raw error messages, user reviews, support tickets, and Slack threads — and the platform handles the rest. Machine learning, natural language processing, and pattern recognition do the bulk of the work.
That means you don’t need a data wrangler to find value. A modern observability platform can:
- Automatically surface spikes in login failures by IP address block or geographic location.
- Cluster similar feedback into themes using sentiment analysis, even if the wording varies.
- Correlate failed transactions to specific deployments, even when the logs don’t follow strict naming conventions.
To be effective, you need an observability platform that can ingest both structured and unstructured data. One that provides a comprehensive view of system health. One that, by analyzing unstructured data, helps you to identify and address issues proactively — before your weekend is ruined.
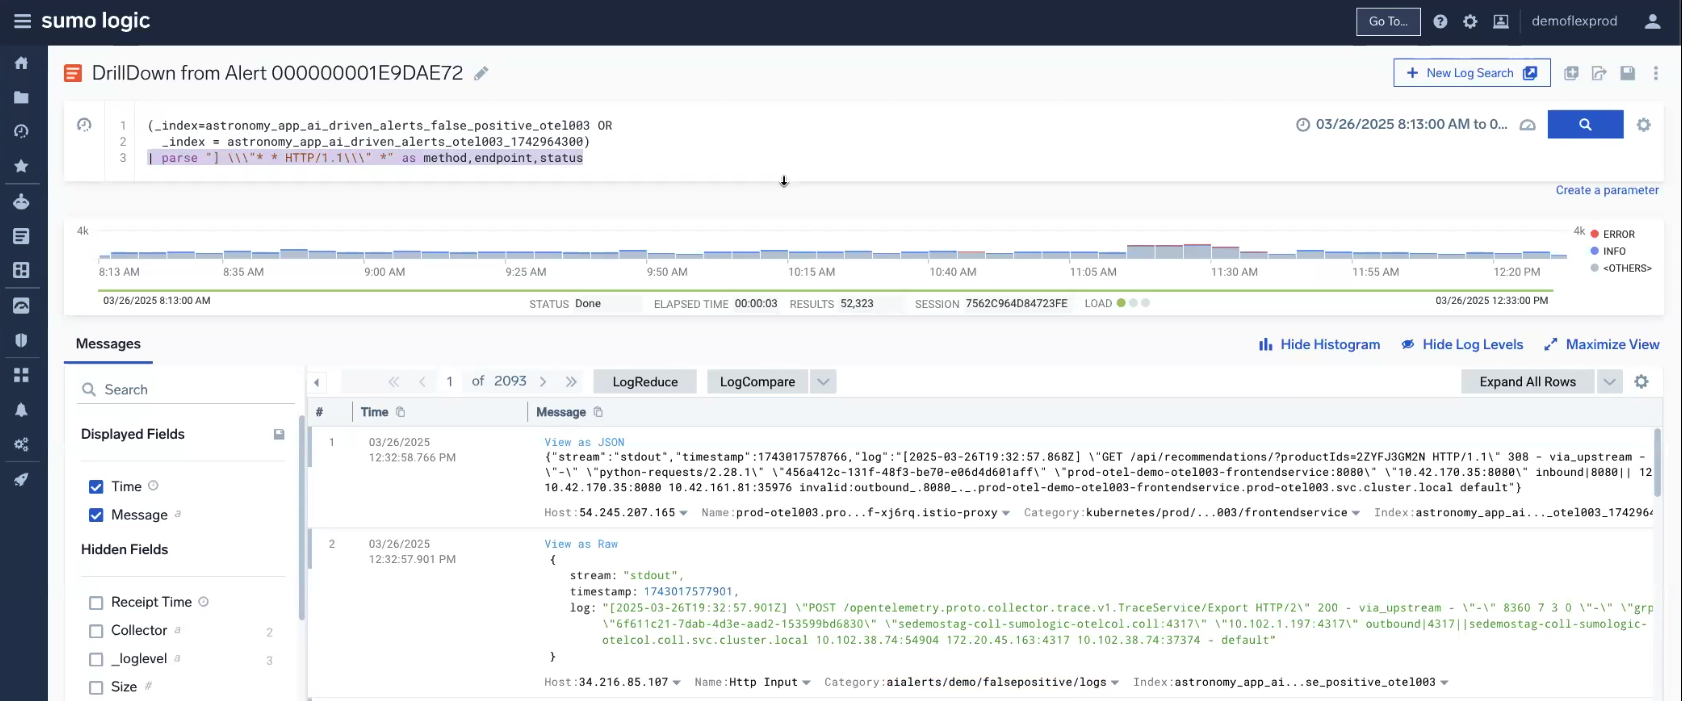
For example, here’s a screenshot from Sumo Logic showing a parse statement from a section of unstructured log data, and how it helps you make sense of the data.
With a modern platform like this, you can use a “schema-on-read” approach. You just store the data as is, then analyze it when needed. And if you can get friendly pricing, you won’t have to worry about the amount of ingest; you can ingest everything — system logs, application traces, and behavioral data — and explore it later without gaps.
Example Use Cases
For example, let’s say you work at an e-commerce company that experiences a sudden surge in negative comments on social media and customer reviews, all of which mention difficulties with the checkout process. Traditional monitoring tools, focused on structured data like transaction success rates, show no anomalies.
But by employing sentiment analysis on unstructured data sources, you identify a pattern: customers are frustrated with a recent update to the checkout interface. This insight means you can promptly address the issue, improve customer satisfaction, and stop any potential revenue loss.
When observability platforms process behavioral signals at scale, the value isn’t just technical — it’s operational and financial.
- E-commerce teams can identify and resolve friction in the checkout flow before it tanks conversion rates.
- SaaS platforms can correlate a rise in support volume with a regression in a recent release and take action before churn increases.
- SRE and platform teams can detect misconfigurations or silent failures earlier, which means reduced incident duration and lower downtime costs.
This kind of pattern recognition turns what used to be support overhead into strategic insight.
Conclusion
You’re already tracking the numbers — latency, error rates, CPU usage. But that’s only half the story. The other half lives in the messy commotion: Slack rants, support tickets, log messages, and user reviews that don’t fit into a tidy schema.
Unstructured data is where behavioral signals live. It can show you why things are breaking, not just what is broken. It captures confusion, intent, and frustration long before structured telemetry raises a red flag.
If you're responsible for user experience, reliability, or security, you can’t afford to ignore what people are saying — or how they're interacting — with your product. The tools exist to make unstructured data useful. Now it’s a matter of putting them to work. The human side of logs is talking. Start listening.
Opinions expressed by DZone contributors are their own.
Comments