Stop Debugging Glue Jobs Manually: Building an Agentic Observability Layer for Data Pipelines
Glue failures scatter evidence across logs, metadata, and table state. A triage layer pulls it together and flags whether a rerun is safe.
Join the DZone community and get the full member experience.
Join For FreeThe Pipeline Did Not Fail Cleanly
Most pipeline failures don't look like "the job failed."
Consider a common scenario. A Glue job reads overnight event files, applies business rules, and writes to an Iceberg curated table. The job runs at its scheduled time and errors out partway through. The control table shows SUCCESS for the previous batch and FAILED for the current one, which is what you'd expect. The problem is what happened between those two states: the job wrote nine of the day's twelve partitions to the staging table before failing. A downstream report ran on its own schedule, picked up the partial data, and the discrepancy didn't surface until a downstream consumer noticed records were missing.
By the time someone looks at the failure, the question is no longer "Why did the job fail?" It's "Is it safe to rerun, and what's already corrupted downstream?"
That's where debugging gets messy. CloudWatch logs, Glue run metadata, the source S3 path, record counts, data quality results, target table state, and Iceberg snapshots. An experienced engineer can connect those signals, but it takes time, and a less experienced engineer often misses one. In a busy production environment that delay leads to blind reruns, duplicate records, overwritten partitions, or worse.
The frustrating part is that the evidence existed. The pipeline just had no structured way to explain itself.
That's the gap a triage layer can fill. Not by fixing the pipeline. Not by changing schemas. Not by restarting jobs. By observing the evidence already produced, classifying the failure, explaining what likely happened, and recommending what to do next.
What Agentic Observability Means
The word "agentic" gets misused a lot right now, especially in data engineering. It's worth being precise.
An agentic observability layer is not an LLM with permission to control production. It's a controlled workflow that collects pipeline evidence, builds incident context, classifies the failure against known categories, and produces a structured recommendation. The loop is observe, classify, explain, recommend, and that's where it stops. Everything past "recommend" stays with engineers, deterministic rules, or approval workflows.
The difference from normal alerting is the depth of the output. A normal alert says "Glue job daily_customer_interactions failed." An agentic observability layer should produce something closer to: "The job failed because the input contains a new column not present in the curated schema. The staging write started before the failure, so a blind retry will create duplicate records. Quarantine the batch, review the schema contract, and rerun with the same batch_id after validation."
That difference is what saves time during an incident. The goal isn't replacing engineers. It's reducing the manual triage work needed before someone can make a real decision.
Reference Architecture
This does not need to start as a new platform. The triage layer can sit beside existing Glue pipelines and consume signals that already exist.
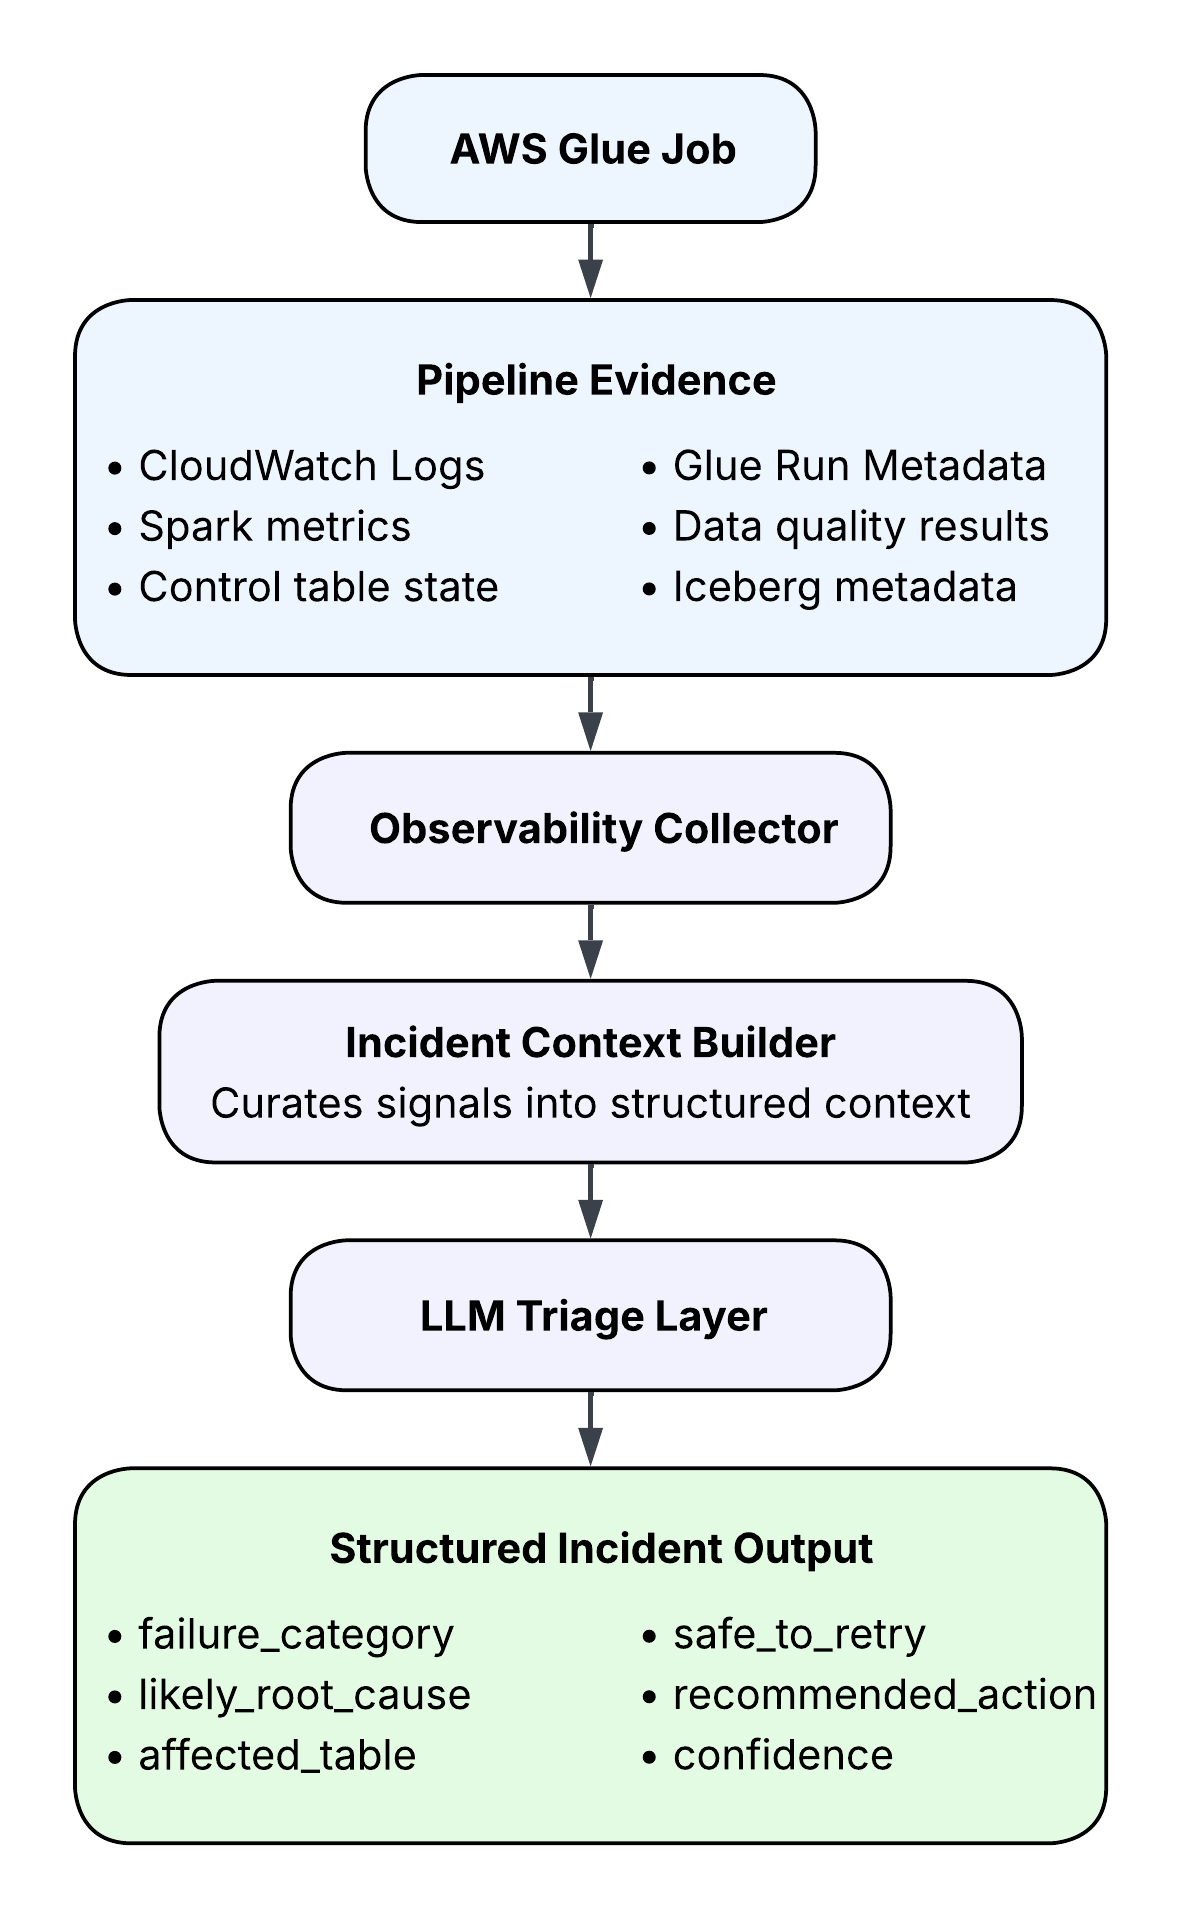
The component that matters most here is the incident context builder. The LLM should never receive a raw dump of ten thousand log lines. That produces noisy, low-confidence output and burns tokens. The collector should pull a curated set of signals: Glue job name and run ID, status and duration, batch ID, source path, target table, the last fifty error log lines, data quality results, record counts, attempt count, recent deployment version, table snapshot or commit ID, and control table status.
That's enough context to analyze the failure without guessing from disconnected log lines.
Where This Fits
Before going further, one thing worth being honest about: this pattern depends on the platform already having its house in order. The agent can only work with the observability that the platform already has. It is not a substitute for basic pipeline hygiene.
It works when the platform tracks batch IDs, clear source paths, data quality results, structured logs, table commits, deployment versions, and ownership mapping. Without those signals, the agent has very little to reason over. If a pipeline doesn't track batch IDs, the agent can't reliably tell whether a run is a retry or a new batch. If quality results aren't stored, it can't reason about input validity. If table commits aren't tracked, it can't tell whether the failure happened before or after a write.
LLMs don't create observability. They summarize and reason over the observability that already exists. The teams that get the most out of this pattern are the ones with disciplined data engineering underneath.
Failure Categories
Manual debugging takes time, partly because every failure looks unique at first glance. Most don't stay unique once you classify them. A small fixed set of categories makes the output easier to review, compare, and route.
| Failure category | Common signals | Recommended action |
|---|---|---|
| Schema drift | New column, missing column, cast failure, contract mismatch | Quarantine the batch and review the schema contract |
| Data skew | Long-running tasks, shuffle spill, uneven partitions | Repartition or isolate skewed keys |
| Small file pressure | High file count, slow planning, frequent commits | Compact affected partitions |
| Source delay | Missing input path, low record count, late file arrival | Wait, retry later, or mark the batch delayed |
| Code regression | Recent deployment plus transformation error | Roll back or compare with the previous run |
| Permission issue | Access denied, catalog failure, IAM or Lake Formation error | Fix access policy before retrying |
| Partial write risk | Failure after write started | Check staging and control tables before rerun |
| Unknown | Weak or conflicting evidence | Escalate to an engineer with summarized context |
The category list isn't only documentation. It's part of the system contract. The agent picks from this list rather than inventing categories on each run, which makes downstream routing tractable. Schema drift can go to the data contract owner. Permission issues route to the platform team. Source delays go to the ingestion owner. Partial write risk triggers a manual review workflow rather than auto-retry.
This is what makes the system more useful than a chatbot that summarizes logs.
Structured Incident Output
The output should also be structured. Free-form summaries help humans skim, but they're hard to store, compare, or evaluate over time. JSON works better because it can be written to an incident table and consumed by Slack, Teams, Jira, or ServiceNow without parsing prose.
{
  "pipeline_name": "daily_customer_interactions",
  "job_run_id": "jr_2026_05_02_001",
  "status": "FAILED",
  "failure_category": "SCHEMA_DRIFT",
  "likely_root_cause": "Input file contains a new column named device_type that is not defined in the curated table schema.",
  "affected_source_path": "s3://raw/events/date=2026-05-02/",
  "affected_table": "curated.customer_interactions",
  "safe_to_retry": false,
  "recommended_action": "Quarantine the batch, update the schema contract, and rerun with the same batch_id after validation.",
  "confidence": 0.87
}
A structured output gives engineers a quick summary, and it gives downstream tools something reliable to use. If safe_to_retry is false, the orchestrator blocks automatic retry. If failure_category is PERMISSION_ERROR, the issue routes to the platform queue. If confidence is low, the system asks for human review. If the same failure category recurs across runs, dashboards can track it over time.
One important framing point: the LLM is not the system of record. The control table, logs, table metadata, and quality checks remain the source of truth. The agent is a reasoning layer that produces structured evidence on top of that.
Implementation Sketch
A simple implementation starts with assembling the incident context. The example below is intentionally simplified. In production, the LLM call should use structured outputs or schema-validated responses rather than free-form text parsing.
def build_incident_context(job_run, control_record, dq_results, recent_logs):
    return {
        "job_name": job_run["JobName"],
        "job_run_id": job_run["Id"],
        "status": job_run["JobRunState"],
        "started_on": str(job_run["StartedOn"]),
        "completed_on": str(job_run.get("CompletedOn")),
        "batch_id": control_record.get("batch_id"),
        "source_path": control_record.get("source_path"),
        "target_table": control_record.get("target_table"),
        "attempt_count": control_record.get("attempt_count"),
        "control_status": control_record.get("status"),
        "data_quality_results": dq_results,
        "recent_error_logs": recent_logs[-50:]
    }
The classifier receives a fixed category list and explicit rules about what it shouldn't recommend.
def classify_failure(llm_client, incident_context):
    prompt = f"""
    You are analyzing a failed data pipeline run.

    Classify the failure into one of these categories:
    SCHEMA_DRIFT, DATA_SKEW, SOURCE_DELAY, PERMISSION_ERROR,
    CODE_REGRESSION, PARTIAL_WRITE_RISK, SMALL_FILE_PRESSURE, UNKNOWN.

    Return only valid JSON with:
    failure_category, likely_root_cause, safe_to_retry,
    recommended_action, confidence.

    Rules:
    - Do not recommend a retry if there is partial write risk.
    - Do not recommend schema changes without human review.
    - Do not recommend permission changes without platform approval.
    - Use UNKNOWN when evidence is weak or conflicting.

    Incident context:
    {incident_context}
    """
    return llm_client.invoke(prompt)
In a real implementation, this prompt should be paired with a strict response schema (failure_category as an enum, likely_root_cause as a string, safe_to_retry as a boolean, recommended_action as a string, confidence as a float between 0 and 1), and the system should reject any output that doesn't match. In production, structured outputs are the better choice when the API supports them. The free-form prompt above is illustrative.
The result gets stored, not acted on:
def store_incident_summary(summary, incident_table):
    incident_table.put_item(
        Item={
            "pipeline_name": summary["pipeline_name"],
            "job_run_id": summary["job_run_id"],
            "failure_category": summary["failure_category"],
            "safe_to_retry": summary["safe_to_retry"],
            "recommended_action": summary["recommended_action"],
            "confidence": summary["confidence"],
            "created_at": current_timestamp()
        }
    )
The agent writes an explanation. Other systems decide what to do with it.
What the Agent Should Never Decide
This boundary is the most important design choice in the whole pattern, and it's worth being explicit about.
An observability agent helps engineers understand a failure. It does not control production data systems. Even at high confidence, certain actions stay out of scope:
- Changing table schemas
- Granting IAM or Lake Formation permissions
- Deleting data
- Marking a partially written batch as successful
- Overriding data quality failures
- Promoting quarantined data
- Rewriting production tables
- Triggering cross-pipeline backfills
- Compacting or expiring table snapshots without approval
These actions move from observability into production control, and that line should stay clear. In regulated or business-critical environments, the safest design lets the agent produce structured evidence and recommendations while deterministic rules, approval workflows, or engineers decide whether anything actually executes.
An agent saying "this looks like schema drift, the batch is not safe to retry" is useful. The same agent updating the curated table schema on its own is not. It's a future incident waiting to happen. Same with permissions: the agent flagging an IAM issue is useful; the agent granting itself access is a security violation.
The trade-off here is real. Letting the agent take action would reduce the mean time to recovery. But the cost of a confident wrong action (silently corrupted data, an unauthorized permission grant, a dropped partition) is much higher than the cost of a few extra minutes of human review. In a regulated data environment, that trade-off is usually easy to justify.
This matters as teams move toward self-healing pipelines. Before a pipeline can safely fix itself, it has to first explain itself reliably, at scale, with measurable accuracy. That bar isn't met yet in most production environments.
Evaluating the Triage Layer
A triage layer should be evaluated like any other production component. "The summary looks good" is not an evaluation.
To check whether the pattern behaves reasonably, a small synthetic evaluation can be assembled across common Glue failure modes. Each scenario includes a short set of log lines, control-table state, data quality results, and table metadata, and the agent is scored on two things: whether it picks the correct failure category, and whether the safe_to_retry decision is appropriate.
This is a starter evaluation, not a benchmark. Ten synthetic scenarios are enough to sanity-check the design. A real production rollout needs hundreds of labeled historical incidents, edge cases, and human-reviewed outcomes. Anything less should be treated as an early prototype, not production validation.
| Scenario | Expected category | Agent category | Safe-to-retry decision |
|---|---|---|---|
| Missing source path | SOURCE_DELAY | SOURCE_DELAY | Correct |
| New column in input | SCHEMA_DRIFT | SCHEMA_DRIFT | Correct |
| Access denied on catalog table | PERMISSION_ERROR | PERMISSION_ERROR | Correct |
| Shuffle spill and one long task | DATA_SKEW | DATA_SKEW | Correct |
| Failure after staging write | PARTIAL_WRITE_RISK | PARTIAL_WRITE_RISK | Correct |
| Too many small files | SMALL_FILE_PRESSURE | SMALL_FILE_PRESSURE | Correct |
| Recent code deployment plus null pointer | CODE_REGRESSION | CODE_REGRESSION | Correct |
| Low record count, no hard error | SOURCE_DELAY | UNKNOWN | Conservative escalation |
| Cast failure due to bad input value | SCHEMA_DRIFT | SCHEMA_DRIFT | Wrong, recommended retry |
| Conflicting log signals | UNKNOWN | UNKNOWN | Correct escalation |
In a small evaluation like this one, a well-designed classifier should pick the expected category in most scenarios and, more importantly, get the safe-to-retry decision right in nearly all of them. The illustrative results above show eight correct retry decisions, one conservative escalation (the agent returns UNKNOWN rather than guessing), and one wrong call.
That wrong call is the most instructive. On the cast failure, the agent classifies the issue correctly as schema drift but recommends cleanup-and-retry instead of quarantine-and-contract-review. A wrong root cause is inconvenient. A wrong retry recommendation can corrupt data. Safe-retry precision should be weighted higher than classification accuracy when evaluating this kind of system, and that weighting should be reflected in the prompt rules and in the validation rubric.
The metrics worth tracking in production:
| Metric | Why it matters |
|---|---|
| Classification accuracy | Whether the agent identifies the right failure type |
| Safe-retry precision | Whether retry recommendations are actually safe |
| False confidence rate | Confident-but-wrong recommendations |
| Mean triage time | Reduction in manual debugging time |
| Human override rate | How often engineers reject the recommendation |
| Cost per incident | LLM and log-processing cost per failed run |
False confidence rate deserves attention. A low-confidence wrong answer is manageable because engineers know to scrutinize it. A high-confidence wrong answer is dangerous because teams stop scrutinizing. Confidence belongs in the output, but it should never be treated as truth. It's one signal among several in the routing decision.
Closing
Glue job failures aren't hard because the logs are long. They're hard because the evidence is scattered across logs, run metadata, data quality results, control tables, and table commits, and an engineer has to assemble it before deciding what to do next.
An agentic observability layer turns that scattered evidence into a structured incident summary. The safest version of this pattern is controlled triage, not autonomous repair: observe, classify, explain, recommend, and stop there. Deterministic rules, approval workflows, and engineers decide what happens next.
Before pipelines can fix themselves, they need to explain themselves. That's the work worth doing first.
Opinions expressed by DZone contributors are their own.
Comments