Benchmarking Elasticsearch With Rally
We take a look at this great tool created by the team at Elastic to help benchmark the performance of your Elasticsearch clusters.
Join the DZone community and get the full member experience.
Join For FreeIf you rely on Elasticsearch for centralized logging, you cannot afford to experience performance issues. Slow queries, or worse, cluster downtime, is not an option. Your Elasticsearch cluster needs to be optimized to deliver fast results.
More on the subject:
- Monitoring AWS Lambda Invocations with the ELK Stack
- 5 Easy Ways to Crash Elasticsearch
- Elasticsearch API 101
The problem is that optimizing Elasticsearch for performance is one of the major challenges facing any team running Elasticsearch at scale. There are so many factors to take into consideration — cluster size, node roles, the number of indices, and shard size to name a few. While there are no official rule-of-thumb recommendations for most of these variables, one best practice is to continuously test and benchmark the performance of your cluster.
In a previous article, we wrote about a simple Dockerized benchmarking tool we use to test our Elasticsearch clusters, but in this article, I’d like to cover Rally — a benchmarking tool developed by the folks at Elastic that is a bit more complex and covers a wide range of use cases and configurations.
What Is Rally?
Initially announced back in 2016, Rally 1.0 was only released in July 2018 and is the benchmarking tool used by the Elasticsearch development team to run their nightly benchmarking tests.
The beauty about Rally is that it can act not only as a load generator but it can also build, set up, and tear down Elasticsearch clusters for you which helps you test in a vanilla environment. You can use Rally to benchmark against an existing Elasticsearch cluster, manage benchmark configurations, run and compare results, and find potential performance issues using what are called telemetry devices (e.g. JIT, GC, perf).
Let’s take a closer look.
Installing Rally
The required steps for installing Rally depend on how you intend to conduct your benchmarking — against an existing Elasticsearch cluster or against a vanilla cluster that will be provisioned as part of the test.
The steps below include all the prerequisites needed for the latter scenario. In any case, I recommend referring to Rally’s documentation before you start for different instructions per OS and scenario.
For setting up and installing Rally on Ubuntu, first install python3 and pip:
sudo apt update
sudo apt-get install gcc python3-pip python3-dev
Then, install git:
sudo apt install gitSince we want Rally to install Elasticsearch, we will need to install JDK as well:
sudo apt install default-jdkYou’ll need to also set the JAVA_HOME environment variable to point to the JDK you installed:
sudo vim /etc/environment
JAVA_HOME="/usr/lib/jvm/java-8-openjdk-amd64"
Verify with:
source /etc/environment
echo $JAVA_HOME
Last but not least, install Rally with:
sudo pip3 install esrally Configuring Rally
Before you run Rally, it needs to be configured.
You can configure a set of advanced settings using the –advanced-config flag (more about this later), but if you simply run Rally it will execute a simple configuration that auto detects settings and chooses default settings:
esrally


    ____        ____
   / __ \____ _/ / /_  __
  / /_/ / __ `/ / / / / /
 / _, _/ /_/ / / / /_/ /
/_/ |_|\__,_/_/_/\__, /
                /____/

Running simple configuration. Run the advanced configuration with:

  esrally configure --advanced-config

* Setting up benchmark root directory in /home/ubuntu/.rally/benchmarks
* Setting up benchmark source directory in /home/ubuntu/.rally/benchmarks/src/elasticsearch

Configuration successfully written to /home/ubuntu/.rally/rally.ini. Happy benchmarking!

More info about Rally:

* Type esrally --help
* Read the documentation at https://esrally.readthedocs.io/en/1.0.2/
* Ask a question on the forum at https://discuss.elastic.co/c/elasticsearch/rally
Running a Test (a.k.a. Race)
Before you run your first benchmark test, let’s understand some of the Rally terminology:
esrally list tracksYou should see a list of track names and descriptions, together with the size of the data (compressed and uncompressed) and available challenges you can run.
When running a race, you will need to define the version of Elasticsearch you want to benchmark on as well as the track and challenge name (be sure to run Rally as a non-root user):
- Race – a benchmarking experiment.
- Track – a benchmarking scenario.
So you will be running a race using a track.
To see what kind of benchmarking scenarios you have available, use:
esrally --distribution-version=6.5.0 --track=http_logs
--challenge=append-no-conflicts
Rally will commence the test by first downloading the Elasticsearch version you defined and the relevant data. It will then run the actual benchmark and report the results.
It will take quite a while, so be patient.
At the end of the race, you will see a detailed report displayed via stdout. Here is a sample of some of the metrics included in the report:
------------------------------------------------------
    _______             __   _____
   / ____(_)___  ____ _/ /  / ___/_________  ________
  / /_  / / __ \/ __ `/ /   \__ \/ ___/ __ \/ ___/ _ \
 / __/ / / / / / /_/ / /   ___/ / /__/ /_/ / /  /  __/
/_/   /_/_/ /_/\__,_/_/   /____/\___/\____/_/   \___/
------------------------------------------------------

|   Lap |                               Metric |                   Task |      Value |    Unit |
|------:|-------------------------------------:|-----------------------:|-----------:|--------:|
|   All |                  Total indexing time |                        |    21.3582 |     min |
|   All |          Min indexing time per shard |                        |    3.61242 |     min |
|   All |       Median indexing time per shard |                        |    3.81058 |     min |
|   All |          Max indexing time per shard |                        |    6.00437 |     min |
|   All |                     Total merge time |                        |    21.5519 |     min |
|   All |             Min merge time per shard |                        |    3.86743 |     min |
|   All |          Median merge time per shard |                        |    4.14517 |     min |
|   All |             Max merge time per shard |                        |    5.28807 |     min |
|   All |            Total merge throttle time |                        |   0.117617 |     min |
|   All |    Min merge throttle time per shard |                        |  0.0117333 |     min |
|   All | Median merge throttle time per shard |                        |  0.0140667 |     min |
|   All |    Max merge throttle time per shard |                        |     0.0455 |     min |
|   All |                   Total refresh time |                        |    9.50888 |     min |
|   All |           Min refresh time per shard |                        |     1.7852 |     min |
|   All |        Median refresh time per shard |                        |     1.8887 |     min |
|   All |           Max refresh time per shard |                        |    1.99403 |     min |
|   All |                     Total flush time |                        |    0.03755 |     min |
|   All |             Min flush time per shard |                        | 0.00398333 |     min |
|   All |          Median flush time per shard |                        |    0.00765 |     min |
|   All |             Max flush time per shard |                        |  0.0116333 |     min |
|   All |                     Median CPU usage |                        |       97.9 |       % |
|   All |                   Total Young Gen GC |                        |    157.366 |       s |
|   All |                     Total Old Gen GC |                        |      1.068 |       s |
|   All |                           Store size |                        |   0.835177 |      GB |
|   All |                        Translog size |                        |    1.00106 |      GB |
|   All |                           Index size |                        |    1.83624 |      GB |
|   All |                      Totally written |                        |    6.54809 |      GB |
|   All |               Heap used for segments |                        |    5.49747 |      MB |
|   All |             Heap used for doc values |                        |  0.0361557 |      MB |
|   All |                  Heap used for terms |                        |    5.13023 |      MB |
|   All |                  Heap used for norms |                        |  0.0531006 |      MB |
|   All |                 Heap used for points |                        |  0.0679445 |      MB |
|   All |          Heap used for stored fields |                        |   0.210037 |      MB |
|   All |                        Segment count |                        |         74 |         |
----------------------------------
[INFO] SUCCESS (took 6812 seconds)
----------------------------------
Based on your chosen track (http_logs in our case), Rally shows various metrics indicating how Elasticsearch performed. For example, Rally reports how long it took to index all the documents and perform a merge:
|   All |                  Total indexing time |                        |    21.3582 |     min |
|   All |                     Total merge time |                        |   14.6848 |     min |
The report Rally provides is extremely detailed. You can take a look at all the different metrics made available and what they mean in Rally’s documentation.
Analyzing Results in Kibana
As I mentioned above, Rally supports a variety of advanced configurations, including the ability to store benchmark metrics in an Elasticsearch index for analysis in Kibana.
To use this option, you will, of course, need a separate Elasticsearch and Kibana deployment.
To run the advanced configuration routine, use:
esrally configure --advanced-configA series of configuration settings are displayed. Just run with the default settings, but for Metrics store type, enter 2 for storing on Elasticsearch and then provide connections settings as requested — your Elasticsearch hostname (default is localhost) and port and authentication details if you’re using X-Pack.
Once you run a race, you will see a Rally metrics index:
curl -X GET "localhost:9200/_cat/indices?v"
health status index uuid pri rep docs.count docs.deleted store.size pri.store.size
yellow open rally-races-2018-12 CjaNkA5ZSv-NR4kna_6vcg 1 1 16 0 37.5kb 37.5kb
green open .kibana_1 _2L8d15cRKSY8mk23tfKlw 1 0 3 0 11.9kb 11.9kb
yellow open rally-metrics-2018-12 8QCNwy11RcetDfzQDVkJng 1 1 31249 0 3.8mb 3.8mb
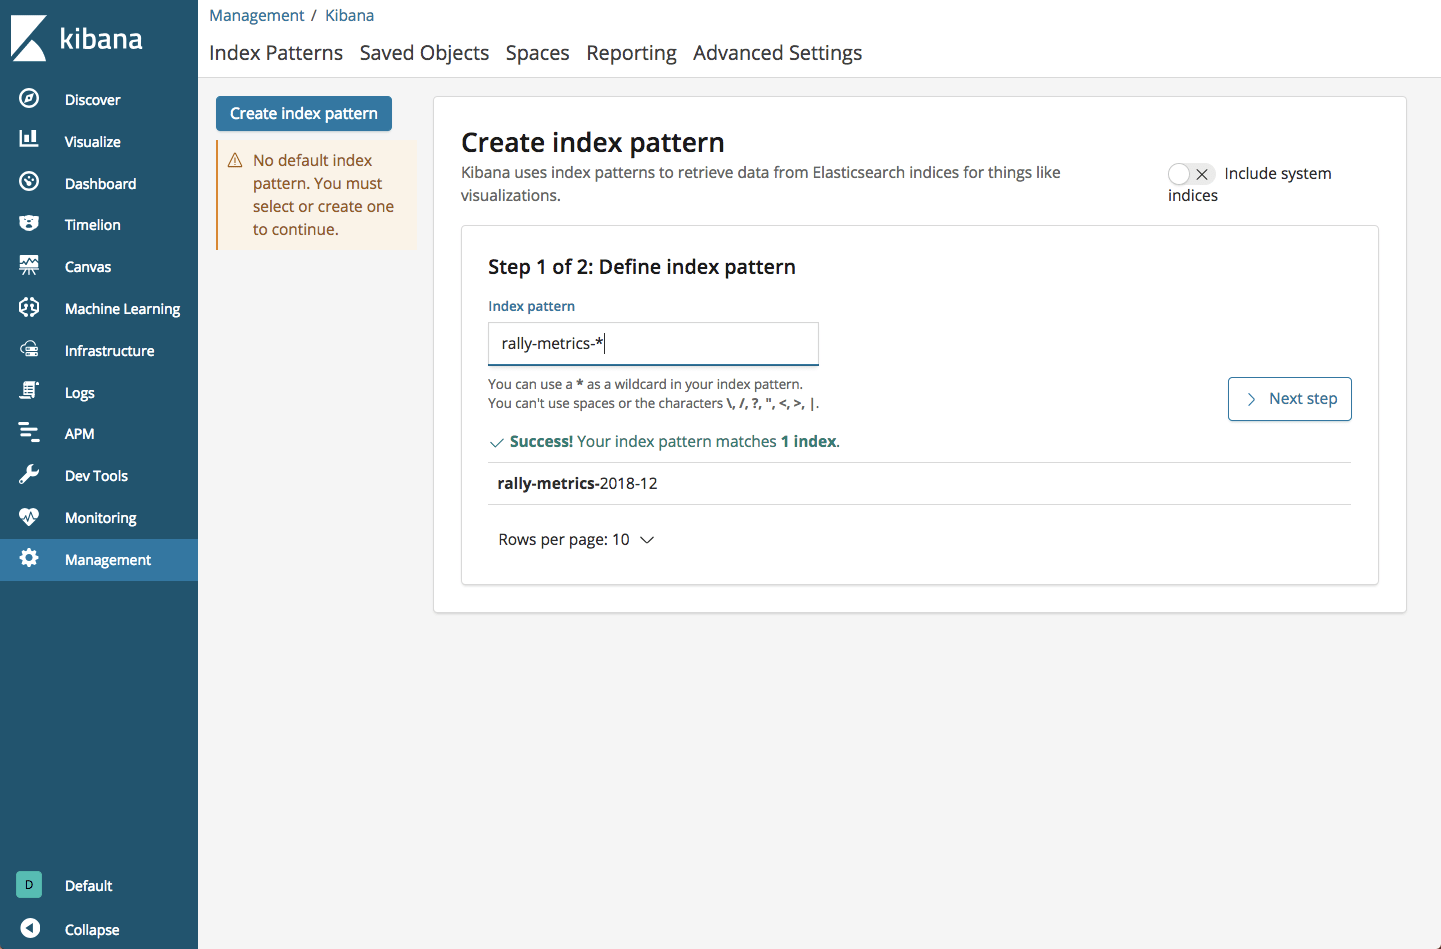
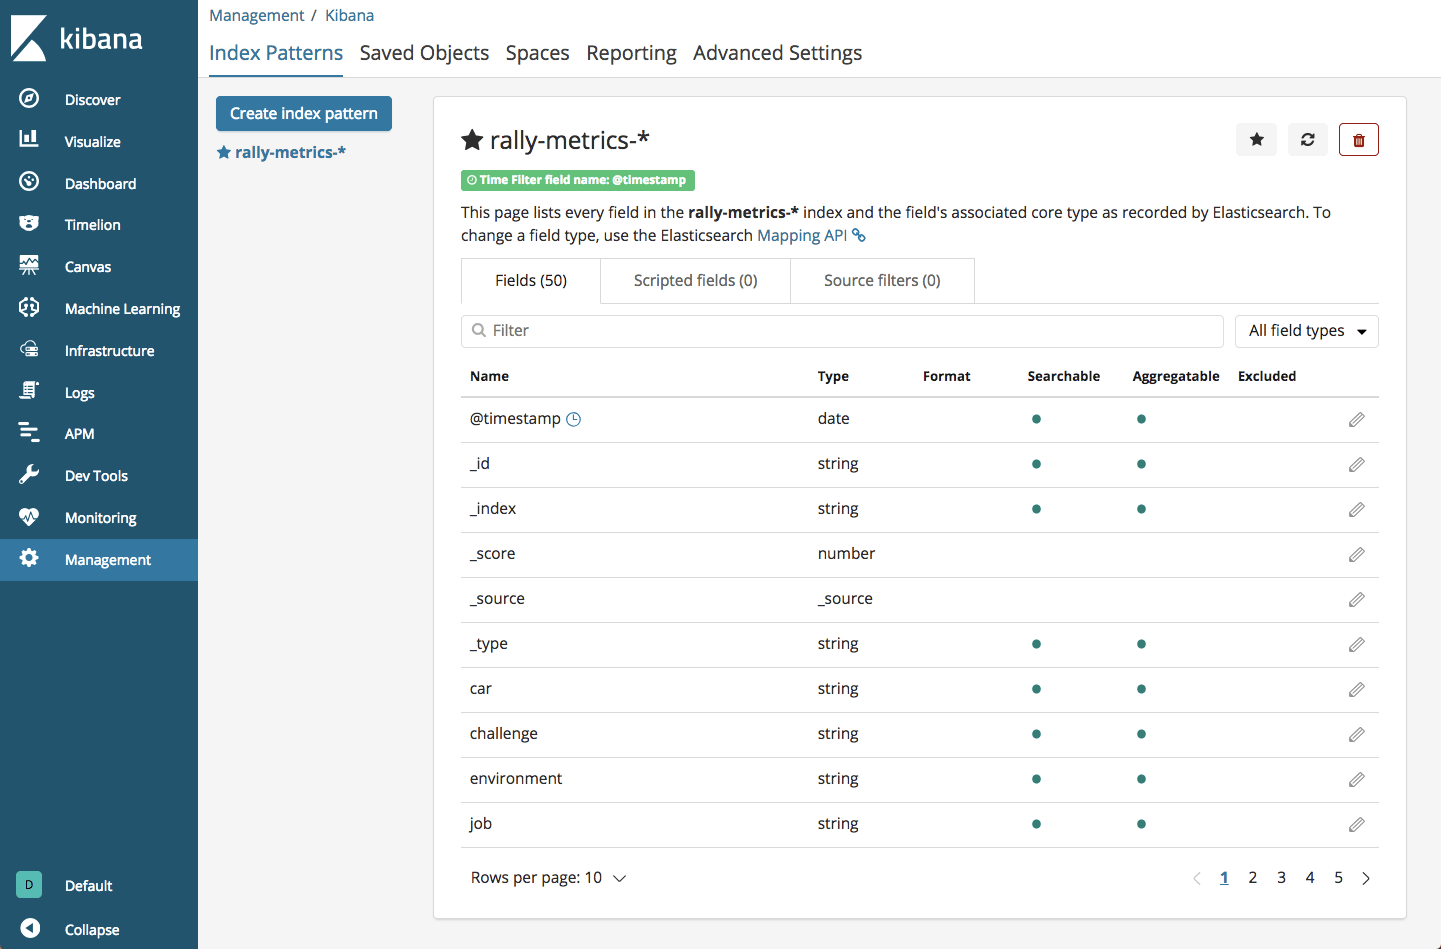
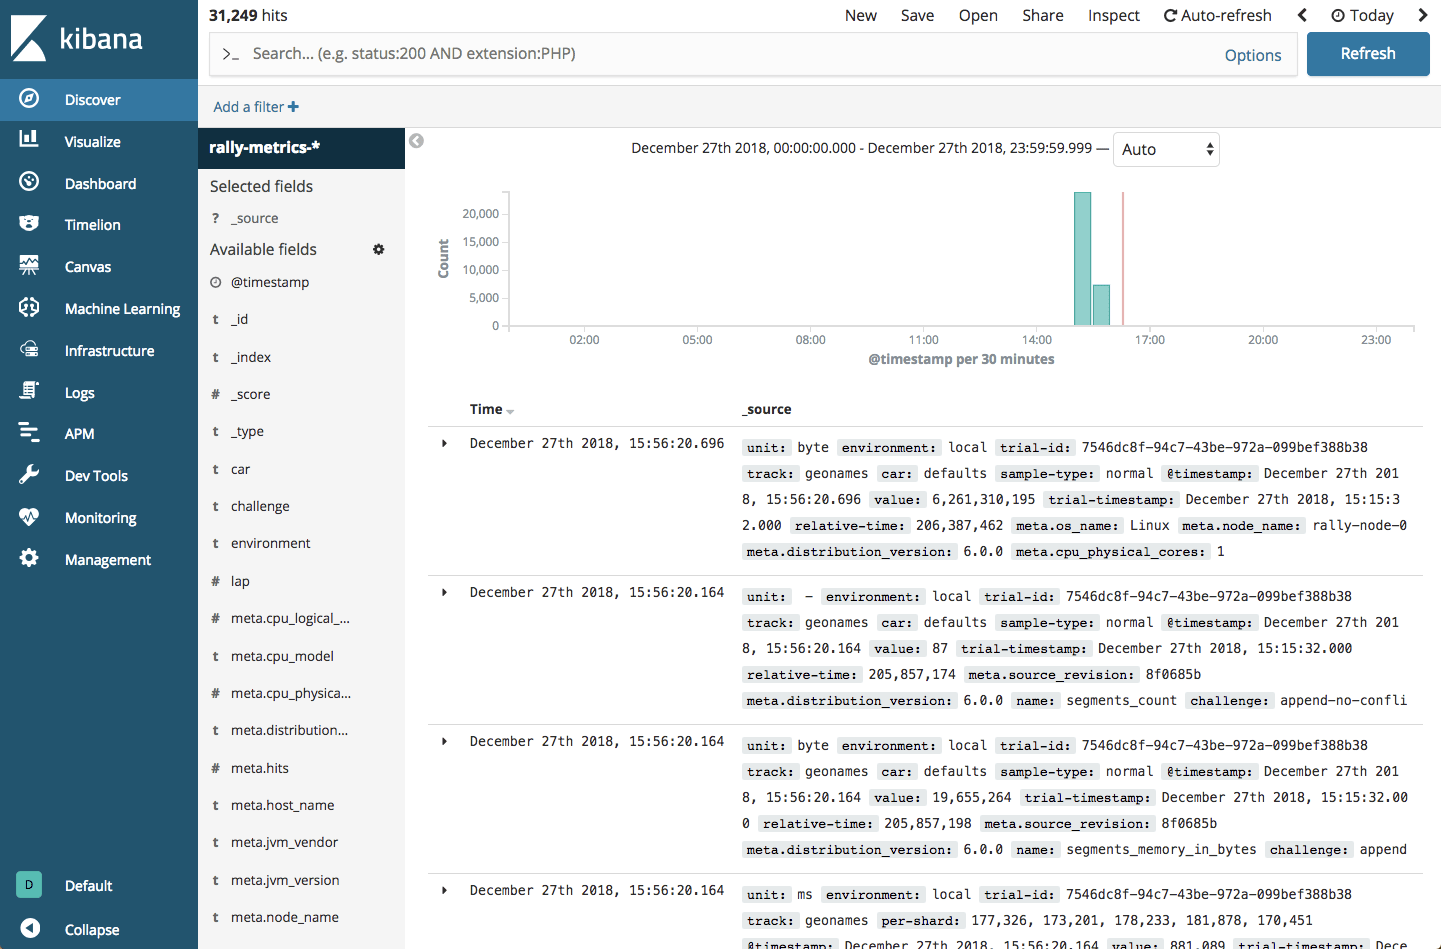
yellow open rally-results-2018-12 kYk8JRleTk-l5k-nwO4cxw 1 1 85 0 27.5kb 27.5kbWe can then define this index in Kibana:
Endnotes
I just touched the surface of what Rally can do. I ran Rally using one of the provided tracks and a provisioned Elasticsearch cluster, but you can create your own customized tracks, test against remote Elasticsearch clusters, and create tournaments (comparing races for measuring performance improvements).
Rally is not easy to handle and requires a good understanding of the ins and outs of Elasticsearch performance metrics, but the information Rally provides gives you a good understanding of how Elasticsearch is performing under different loads and what is required for optimization.
Before using Rally on your own Elasticsearch clusters, use the instructions here to play around with the tool and become familiar with its operation. Once you feel you’ve gained familiarity with Rally, run it in a sandboxed environment. In any case, do not run Rally against production clusters.
Published at DZone with permission of Daniel Berman. See the original article here.
Opinions expressed by DZone contributors are their own.
Comments