

Build a GitHub Contribution City With Java and Quarkus
Turn your contribution calendar into an SVG skyline, add it to your profile, and build a DZone-inspired version with a custom palette and character shapes.
GitHub's contribution calendar gives you an already iconic overview of your activity over the year. Each day has a square, and its color changes with the contribution level. And of course, those days and contributions can also be arranged into buildings, with a week becoming a small part of a city and busier weeks adding height to the skyline.
I had some spare minutes and built Quarkus Contribution City around this idea, using Java and Quarkus to generate an SVG from GitHub's contribution data. The visual inspiration came from Pink Pixel's skyline, and you can see a version with my real data on my GitHub profile. A scheduled GitHub Action updates the image at night.
For a Java developer, this is a small project you can follow from the API request through to the image. You can use the released action on your own profile, then change the drawing code locally once you have a feel for how the city is put together. For this article, I created a special DZone example that adds a small piece of character art above the buildings.
Add the City to Your Profile
Your GitHub profile README lives in a public repository with the same name as your account. For my account, that repository is myfear/myfear. Open your own profile repository, or create it with a README if you haven't used this GitHub feature before.
Copy the project's complete publishing workflow into .github/workflows/contribution-city.yml on the default branch. This example checks out your profile repository and the action's v1 release line. It then generates the image and publishes it to an output branch. The workflow includes the repository write permission needed for that last step.
The generation step uses the repository owner's username, so the same configuration can be copied between personal profile repositories. You can add the layout options to that step:
- name: Generate contribution city
  id: city
  uses: ./.city-action
  with:
    github-token: ${{ secrets.CONTRIBUTION_TOKEN || secrets.GITHUB_TOKEN }}
    username: ${{ github.repository_owner }}
    weeks: '53'
    height: '14'
    theme: github-dark
The local path refers to the action checkout made earlier in the example workflow. The built-in GITHUB_TOKEN is the starting point for reading your visible contribution data. An optional CONTRIBUTION_TOKEN secret can supply a personal token when additional access is needed. The calendar returned by GitHub depends on the token's permissions and your account's contribution visibility settings.
After committing the workflow, open Actions in your profile repository, select publish-contribution-city, and choose Run workflow. A successful run creates contribution-city.svg on the output branch. Add this image reference to your profile README, replacing both occurrences of USERNAME:
The example also has a daily schedule for 03:17 UTC. Subsequent runs create a commit when the generated image changes. For this setup, the workflow and its run history can be found in your profile repository, while the Java implementation is maintained in the action's repository.
Give Each Week a Building
The city is arranged in time order, with the most recent week on the right. Every building is two character cells wide, so all weeks occupy the same horizontal space. Weekly contribution totals determine the height, and daily contribution levels provide the window colors. Month labels beneath the street help you find your place in the year.
Height needs a little extra thought. A very busy week can have many times the contributions of a quiet one. With a linear scale, those quieter weeks would be compressed close to the street. The city uses a logarithmic scale, which gives them more room while preserving the order of weekly totals.
For each week, the calculation can be expressed as:
int height = weeklyTotal == 0 ? 1
        : 1 + (int) Math.round(
                Math.log1p(weeklyTotal)
                        / Math.log1p(maximumWeeklyTotal)
                        * (maxHeight - 1));
With a maximum of 20 contributions and a height limit of 14, a week with three contributions gets seven window rows. The busiest week gets 14, and a week with zero contributions keeps one row. Quiet periods therefore retain their position in the calendar. An antenna marks the busiest displayed week; when totals are tied, the most recent week receives it.
The two columns of windows are filled by cycling through the days of the week. This repeats the daily pattern in taller buildings, so window count is a visual texture. The weekly total controls height, while the window colors carry the daily contribution levels. Together, they give you a view of the pattern across your calendar.
You can change weeks to 12 for a shorter view. The tallest building is then calculated from those recent weeks, which lets the selected period use the available height. Keep this in mind when comparing images: the same week can appear taller in a shorter view. The displayed contribution total still covers the full calendar returned by GitHub.
Follow the Data Through Java
The released project uses Quarkus with the Quarkus GitHub Action extension. That extension connects an @Action method to workflow inputs, outputs, and the job summary. Inside the method, the drawing process comes down to three steps:
ContributionCalendar calendar = contributionClient.fetch(
        configuration.username(),
        inputs.getGitHubToken().orElseThrow(),
        context.getGithubGraphQLUrl());
Scene scene = cityBuilder.build(calendar, configuration.options());
String svg = svgRenderer.render(scene, configuration.options().theme());
The client reads the contribution calendar with one GraphQL request and converts the response into Java records for the calendar, weeks, and days. CityBuilder uses these records to place roofs, windows, and the street in a grid. SvgRenderer turns that grid into the final SVG. Changes to the skyline can therefore be made in plain Java classes, with the GitHub connection kept in the client.
The SVG contains the shapes and text needed to display the city. Adjacent characters with the same color are grouped during rendering, and their horizontal positions are set explicitly to keep the columns aligned. Identical data and options produce identical file contents, which allows the publisher to compare images before creating a commit. The action sets up Java and JBang, builds the selected source revision, and runs the packaged application.
Change the Layout Locally
To try a change, install JDK 21 and JBang, with Git and Bash available. The repository includes a Maven wrapper. JBang is also used by the integration tests to run the packaged action through the same launcher used in GitHub Actions.
git clone --branch v1.0.0 https://github.com/myfear/quarkus-contribution-city.git
cd quarkus-contribution-city
./mvnw verify
The tests use local test data and a local GraphQL server, so you can run them without GitHub credentials. They also generate SVG previews under target/previews. Open github-dark.svg, recent-12.svg, and empty.svg in a browser to compare a full calendar, a shorter period, and a calendar with zero contributions.
Start with the height calculation in CityBuilder, then run the same command again and compare the previews. The saved data stays the same between runs, which makes the effect of your change easier to see. The project is available under the Apache License 2.0, and the v1.0.0 release gives you a fixed starting point.
Give the City a DZone Landmark
Version 1.0.0 exposes weeks, height, and the two built-in themes through workflow inputs. For a custom shape, you extend the Java code in your fork. The Scene record gives you a grid of cells to change before the SVG is rendered, and that is where we'll add the DZone lettering.
Each cell has a character, a role such as roof or window, and the color information used by the renderer. A character mask is enough to describe a new shape: # marks a filled block, and spaces leave the background visible. By arranging those blocks, you can draw letters, an arch, or a stepped tower.
For this example, the lettering is placed above the weekly buildings. It has its own fixed shape, while the buildings below continue to show the contribution calendar. The image uses a snapshot of my real account data, with 534 contributions returned by GitHub on October 5, 2026, when I wrote this article.
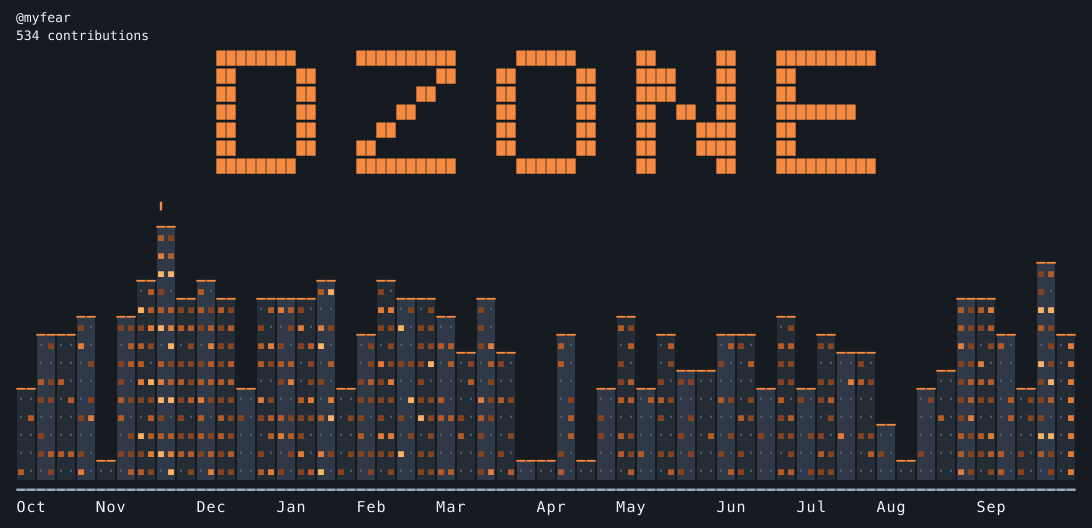
Add this class to the existing city package in your fork, at src/main/java/com/themainthread/contributioncity/city/DZoneLandmark.java:
package com.themainthread.contributioncity.city;

import java.util.ArrayList;
import java.util.Collections;
import java.util.List;

import com.themainthread.contributioncity.render.Theme;

public final class DZoneLandmark {
    public static final Theme THEME = new Theme("dzone-example", "#161b22", "#242c36", "#303947",
            "#f58a42", "#9ba9ba", "#edf2f7",
            List.of("#536070", "#86431f", "#b85b25", "#e57d36", "#ffb365"));

    private static final List<String> MASK = List.of(
            "####   #####   ###   #   #  #####",
            "#   #      #  #   #  ##  #  #    ",
            "#   #     #   #   #  ##  #  #    ",
            "#   #    #    #   #  # # #  #### ",
            "#   #   #     #   #  #  ##  #    ",
            "#   #  #      #   #  #  ##  #    ",
            "####   #####   ###   #   #  #####");

    private DZoneLandmark() {
    }

    public static Scene addTo(Scene city) {
        int landmarkWidth = MASK.getFirst().length() * 2;
        int width = Math.max(city.width(), landmarkWidth);
        int left = (width - landmarkWidth) / 2;
        List<List<Cell>> rows = new ArrayList<>();
        Cell block = new Cell('█', CellKind.ROOF, 0, -1);
        for (String line : MASK) {
            List<Cell> row = new ArrayList<>(Collections.nCopies(width, Cell.SKY));
            for (int column = 0; column < line.length(); column++) {
                if (line.charAt(column) == '#') {
                    row.set(left + column * 2, block);
                    row.set(left + column * 2 + 1, block);
                }
            }
            rows.add(row);
        }
        rows.add(Collections.nCopies(width, Cell.SKY));
        for (List<Cell> sourceRow : city.rows()) {
            List<Cell> row = new ArrayList<>(sourceRow);
            row.addAll(Collections.nCopies(width - city.width(), Cell.SKY));
            rows.add(row);
        }
        return new Scene(city.username(), city.totalContributions(), rows);
    }
}
The theme defines the background, two building shades, roof, street, and label colors, followed by the five window colors. Those window colors follow GitHub's contribution levels from zero through four. Here, the roof color is also used for the lettering, so the decoration has a consistent orange color across all seven rows.
Inside addTo, each marked position is expanded to two cells because the renderer's cells are taller than they are wide. The lettering is centered, a blank row is added beneath it, and the original city rows are copied below. Short calendars receive extra background space on the right to make room for the lettering. The dates, counts, and order of the weekly buildings are preserved.
To use the decoration in your fork, import DZoneLandmark from the city package in ContributionCityAction. Replace the existing scene-building and rendering lines with:
Scene scene = cityBuilder.build(calendar, configuration.options());
Scene decorated = DZoneLandmark.addTo(scene);
String svg = svgRenderer.render(decorated, DZoneLandmark.THEME);
This selects the example's palette in Java. The published @v1 action continues to accept github-dark and mono; your fork contains the additional drawing code. For a local preview, add the following after the existing Files.writeString call in PreviewTest.write, with the same import for DZoneLandmark:
Scene decorated = DZoneLandmark.addTo(builder.build(calendar, options));
Files.writeString(directory.resolve(name.replace(".svg", "-dzone.svg")),
        renderer.render(decorated, DZoneLandmark.THEME));
Run ./mvnw verify again and open target/previews/github-dark-dzone.svg. The build also writes the shorter and empty versions with the -dzone.svg suffix, so you can check how the decoration fits several calendars. When you're ready to use your fork on GitHub, update the second checkout in the publishing workflow to your fork's repository and a commit containing your changes. The generation step then runs the customized action from that checkout.
Try It With Your Own Contributions
Try Quarkus Contribution City with your own GitHub account and add the generated SVG to your profile. Start with the released action, then fork the project and change the character mask to give your city a landmark of its own. You could draw a stepped tower from your hometown or add your team's initials above the street, using the DZone version as a starting point.
Share your version in a GitHub issue, or open a pull request if you'd like to contribute a new shape.
Published at DZone with permission of Markus Eisele. See the original article here.
Opinions expressed by DZone contributors are their own.