Building a Real-Time Anomaly Detection Experiment With Kafka and Cassandra
See how to build a real-time anomaly detection experiment that can handle 19B daily data events with Kafka and Cassandra.
Join the DZone community and get the full member experience.
Join For FreeAnomaly detection is a cross-industry method for discovering unusual occurrences in event streams — it’s applied to IoT sensors, financial fraud detection, security, threat detection, digital ad fraud, and plenty of other applications. Such systems inspect streaming data to check for anomalies or irregularities and send alerts upon detection to process those exceptions and determine if they do, in fact, represent a security threat or other issue.
Detection systems look for anomalies within streaming data by comparing events with historical patterns, recognizing both previously-classified anomalies and new events that differ significantly from what is expected. Performing this detection requires a technology stack that leverages machine learning, statistical analysis, algorithmic optimization techniques, and data-layer technologies to ingest, process, analyze, disseminate, and store streaming data.
Actually creating an anomaly detection system for applications that can generate millions or even billions of events each day comes with major development challenges, from the computational hurdles that anomaly detection algorithms must overcome to the performance and scalability needs that the system’s data-layer technologies must meet. At Instaclustr, we recently created a purely experimental anomaly detection application (we don’t sell anomaly detection) utilizing open source Apache Kafka and Apache Cassandra as its data-layer technologies and then analyzed the effectiveness of this architecture from a scalability, performance, and cost-effectiveness standpoint.
Building an anomaly detection pipeline
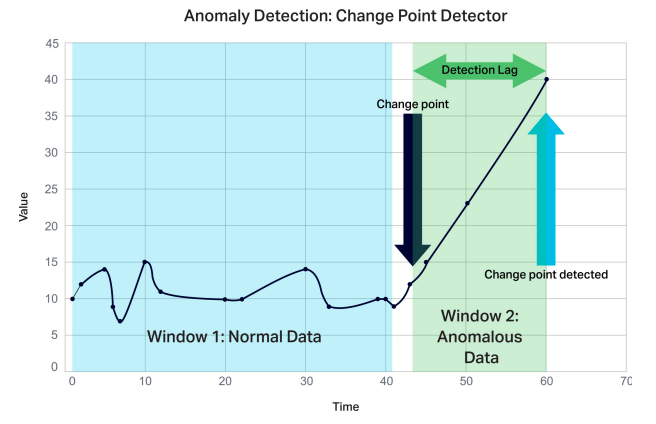
Break or changepoint analysis provides a method for performing a simple type of unsupervised anomaly detection. Our system uses a CUSUM (CUmulative SUM) algorithm that analyzes a stream of events to check whether recent events are different from previous ones.
The anomaly detection pipeline flows as follows:
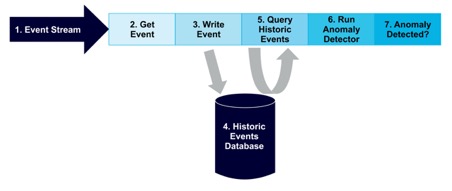
Events arrive in a stream
Get the next event from the stream
Write the event to the database
(Data is stored in the historic events database)
Query the historic data from the database
If there are sufficient observations, run the anomaly detector
If a potential anomaly is detected, take appropriate action
Architecture and technology decisions
Apache Kafka and Apache Cassandra are strong technology choices for supporting an anomaly detection system for a number of reasons: they’re affordable, performant, scalable, and work seamlessly together.
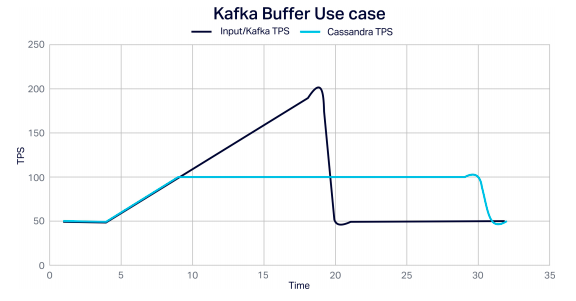
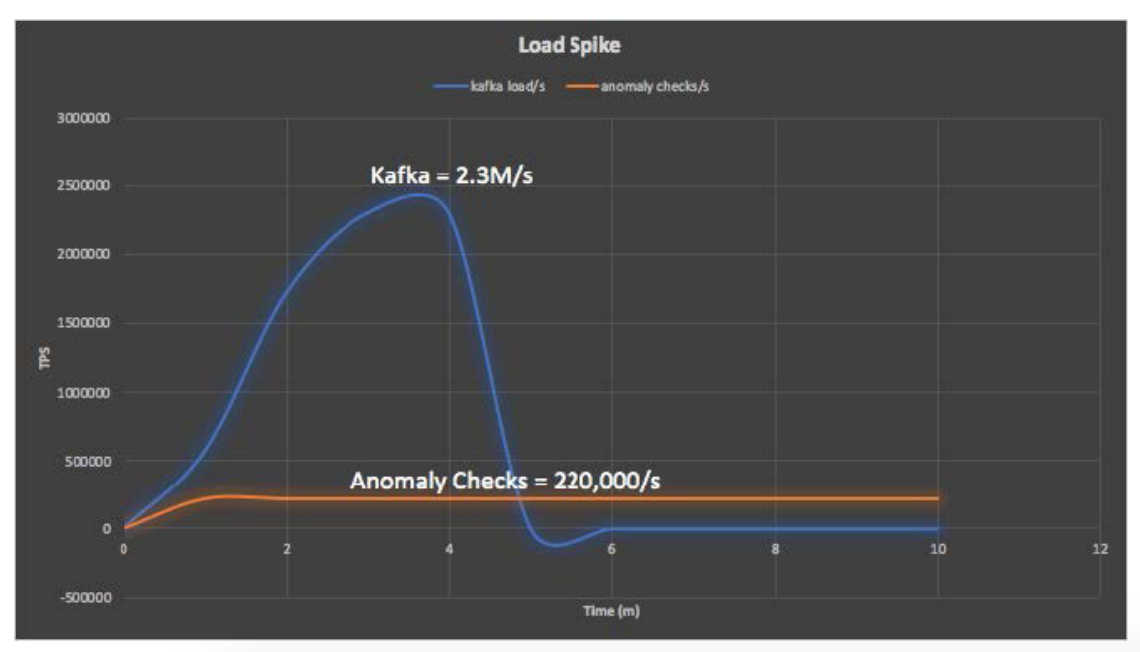
Kafka enables fast and linearly scalable ingestion of streaming data, supporting multiple heterogeneous data sources, data persistence, and replication by design to eliminate data loss even when some nodes fail. Kafka’s store and forward design also allows it to serve as a buffer separating volatile external data sources from the Cassandra database, so that Cassandra isn’t overwhelmed when large data surges occur, and data is further protected from loss. It’s simple to send data in Kafka elsewhere, such as to a Cassandra database, and to process streaming data continuously in real-time. Here's an example of Kafka handling a spike in load, allowing Cassandra to continue processing events at a steady rate:
At the same time, Cassandra serves as a strong choice for the rapid storage of high-velocity streaming data and time-series data in particular, because it’s write-optimized. Cassandra also thrives at the task of rereading data, due to its support of random access queries though the use of a sophisticated primary key, comprised of a simple or composite partition key and zero or more clustering keys that determine the order in which data is returned. Like Kafka, Cassandra also provides linear scalability and maintains data even during failures.
For our anomaly detection experiment, we combined Kafka, Cassandra, and our application in a Lambda architecture, with Kafka and the streaming pipeline serving as the “speed layer” and Cassandra as the “batch” and “serving” layer.
We also trialed the idea of using an even simpler Kappa architecture, leveraging the fact that Kafka has an immutable copy of the data to run the anomaly detection pipeline solely as a Kafka streams application. We discovered, however, that Kafka is efficient only when replaying previous data contiguously and in order because it lacks indices or support for random access queries. This means that for a massive range of IDs, the consumer would be required to read large quantities of irrelevant records before finding the matching IDs. Non-scalable alternative ideas include having a partition for each ID, or to use streams state stores to cache the data – which isn’t practical given that the big data in question cannot be kept in RAM in its entirety. Therefore, we proved our Lambda architecture to be necessary and the best approach.
Anomaly detection data model and application design
With our technology choices made and architecture established, we turned to the experiment’s data model and application design.
Our data model utilizes a numeric <key, value> pair, including a Kafka timestamp embedded in the Kafka metadata at the moment data is ingested. Data is then stored in Cassandra as a time series, enabling efficient reading of the previous N values (for our experiment, 50) for a given key (id). The data model uses a Compound Primary Key, with id as the partition key and time as the clustering key, making it possible to retrieve row data in descending order.
create table event_stream (

     id bigint,

     time timestamp,

     value double,

     Primary key (id, time)

) with clustering order by (time desc);
Using the following Cassandra query allows us to retrieve up to the last 50 records for a specific key, which can then be processed by the detection algorithm.
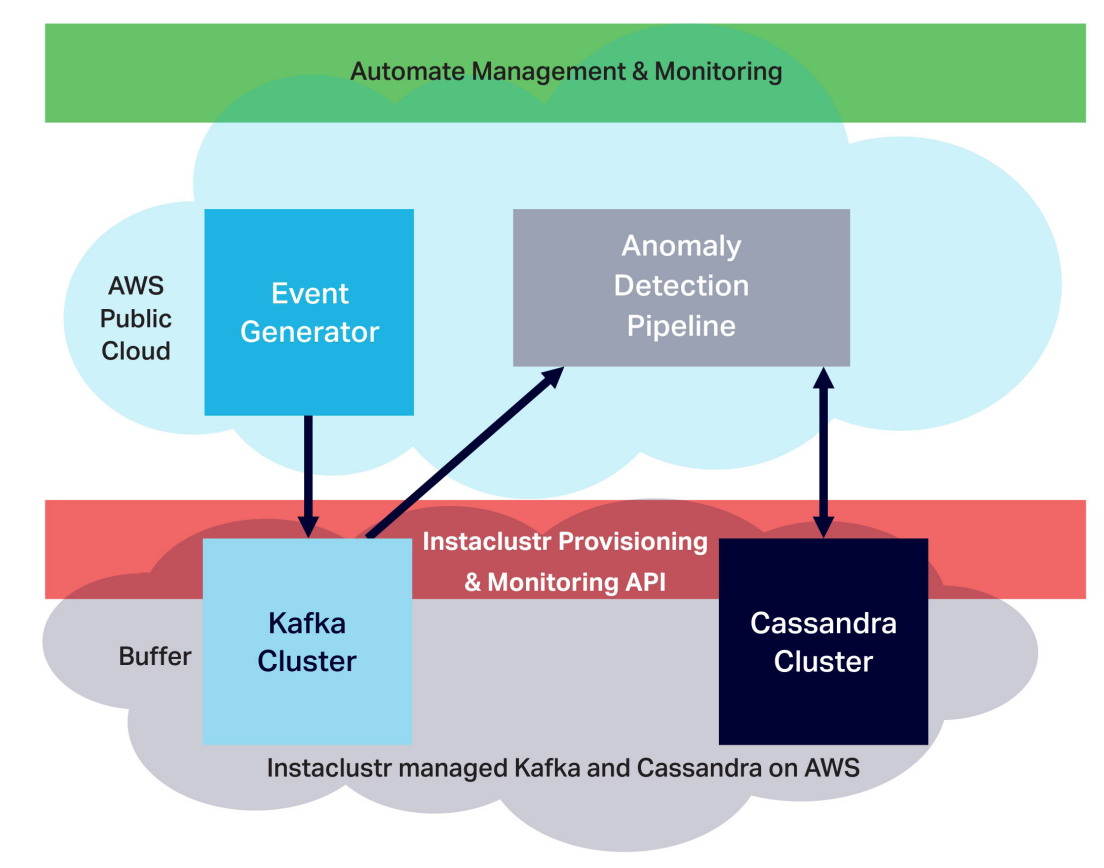
SELECT * from event_stream where limit 50;The main components of the anomaly detection application include the event generator (relying on a Kafka producer), Kafka cluster, anomaly detection pipeline, and Cassandra cluster.
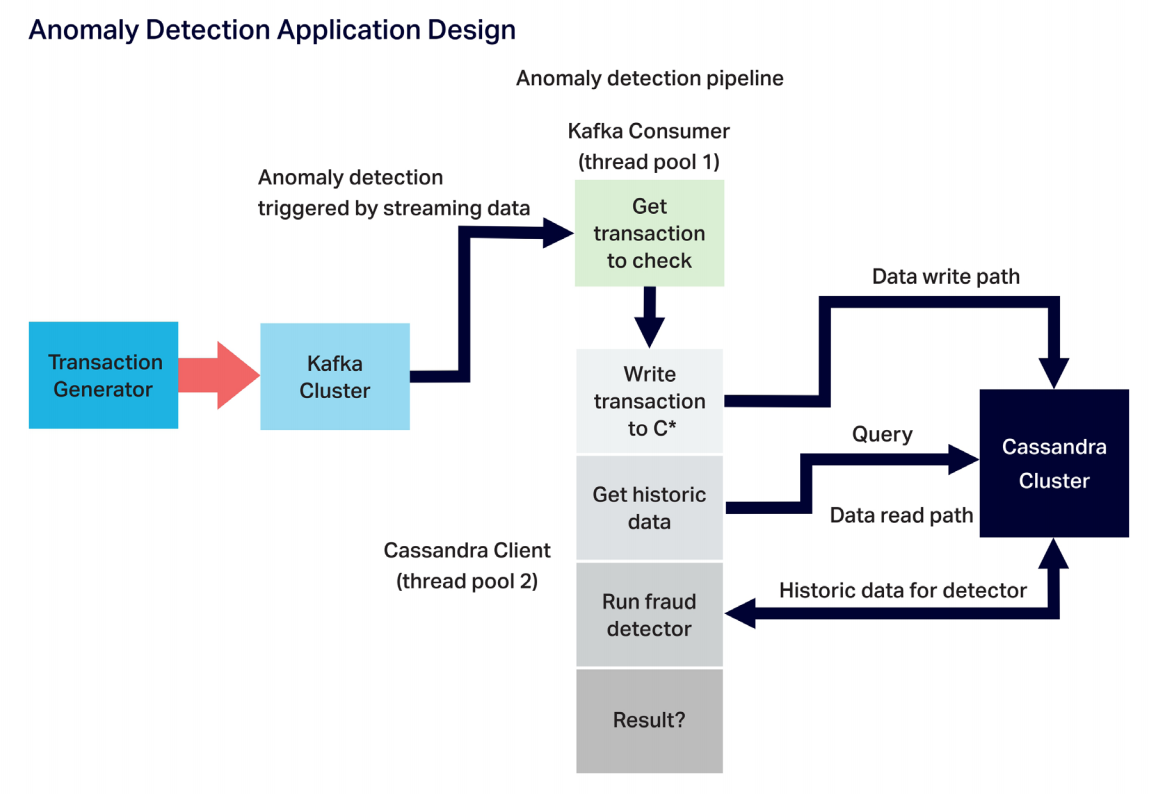
The anomaly detection pipeline itself includes the Kafka consumer (with its own thread pool) and the processing stages (using a separate thread pool). For each event that arrives via the consumer, the Cassandra client writes the event to Cassandra, reads historic data from Cassandra, runs the anomaly detection algorithm, and makes the decision as to whether the event carries a high risk of being an anomalous one. The application can scale simply by increasing the threads, application instances, and server resources each component has available.
Automation and instrumentation in the cloud
At a high level, we deployed the experiment to the cloud by building the Kafka and Cassandra clusters on the Instaclustr managed platform on AWS. This allowed us to quickly and easily create clusters of any size (including for any cloud provider, node types and number), and to easily manage its operations and perform comprehensive monitoring of the experiment. We then used Kubernetes on AWS EKS to automate the application’s provisioning, deployment, and scaling. To make the application observable when running on Kubernetes — in order to monitor, debug, and fine-tune each stage of the pipeline and then report the scalability and performance metrics of the anomaly detection application — we used open source Prometheus for metrics monitoring and OpenTracing and Jaeger for distributed tracing.
Deploying the application in production on Kubernetes
With the event generator and anomaly detection pipeline deployed on AWS using Kubernetes (AWS EKS) — which comes with a learning curve and takes serious effort in order to get AWS EKS running, create worker nodes, and configure and deploy the application in a smooth manner — we have a repeatable process for application scalability. We can also easily change, reconfigure, and tune the application and run it in as many Kubernetes Pods as necessary to meet our scaling needs.
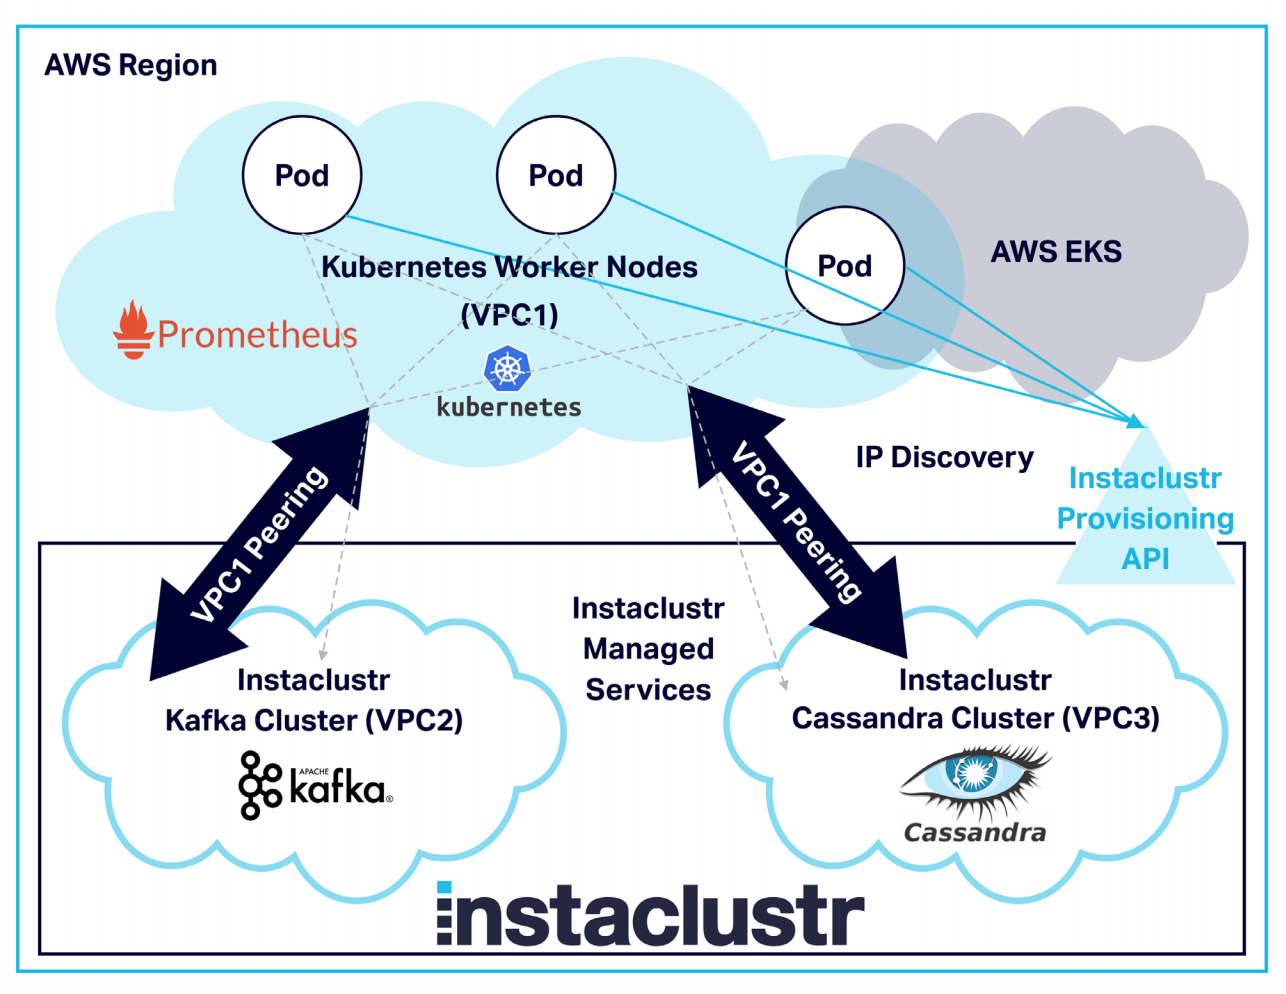
We also used VPC Peering to establish secure communication through private IP addresses between our application (running in Kubernetes on AWS EKS) and the Instaclustr clusters (all running on the same AWS region). VPC requests can be initiated using the management console and APIs — those requests are then accepted and configured in AWS. We used the Instaclustr provisioning API to allow the applications running in Kubernetes Pods to dynamically discover and connect to the private IP addresses of the cluster nodes.
 To meet our monitoring needs we instrumented the application with Prometheus. This involves running the Prometheus operation on the Kubernetes cluster, configuring and running the Prometheus to monitor all application Pods, and allowing ingress to the server from outside the cluster. In this way, Prometheus is able to monitor any number of Pods dynamically as they are created and destroyed.
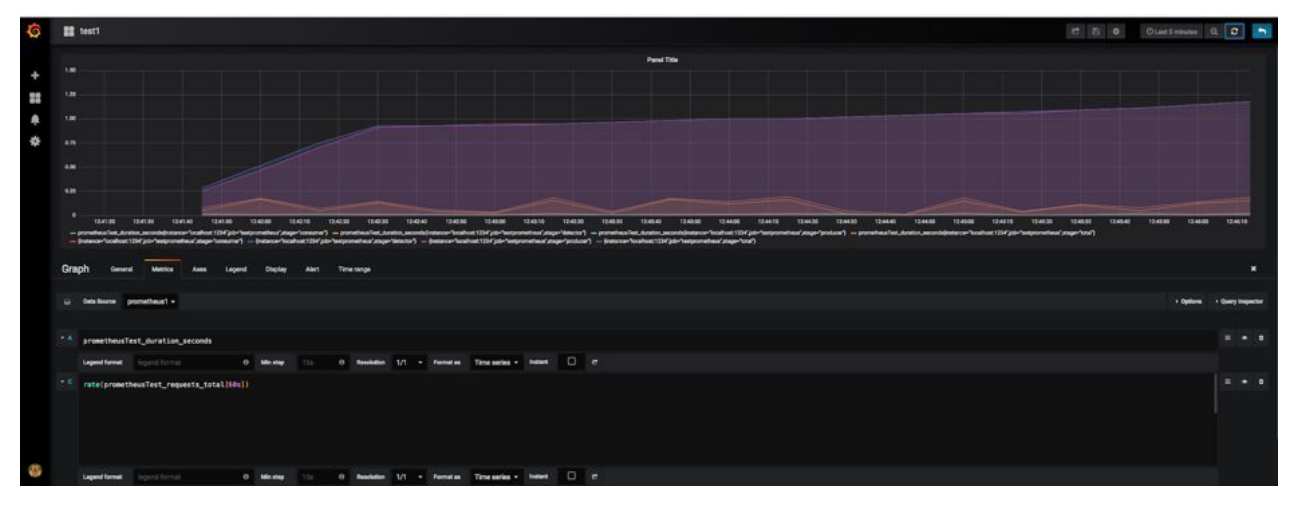
Prometheus runs in the Kubernetes cluster and enables us to reach the Prometheus Server URL in a browser, where we can view the full metrics produced by the application.
Using this architecture, we’re able to go into detail on the application’s performance, by writing expressions and by graphing metrics from Prometheus such as detector rate and duration using Grafana.
We also instrumented the application with OpenTracing, arriving at the Jaeger dependencies diagrammed below (further views show single traces in detail). This view outlines the system’s topology, as well as the tracing across process boundaries from producers to consumers.

Running the anomaly detection pipeline at scale
With the anomaly detection pipeline architected and deployed, we turned our attention to ensuring it could scale. Instead of simply running the system on huge clusters right away, we took a slow and measured approach in increasing the scale while monitoring, debugging, and fine-tuning components as we recognized opportunities for greater efficiency. Guided by our Prometheus metrics, we optimized the anomaly detection application and clusters, changing the number of Pods running the applications as well as the thread pools, Kafka consumers and partitions, and Cassandra connections — maximizing performance as the scale of Kafka and Cassandra clusters increased through additional nodes. For example, we discovered that we could optimize throughput with increasing Pods by keeping the number of Kafka partitions and Cassandra connections to a minimum.
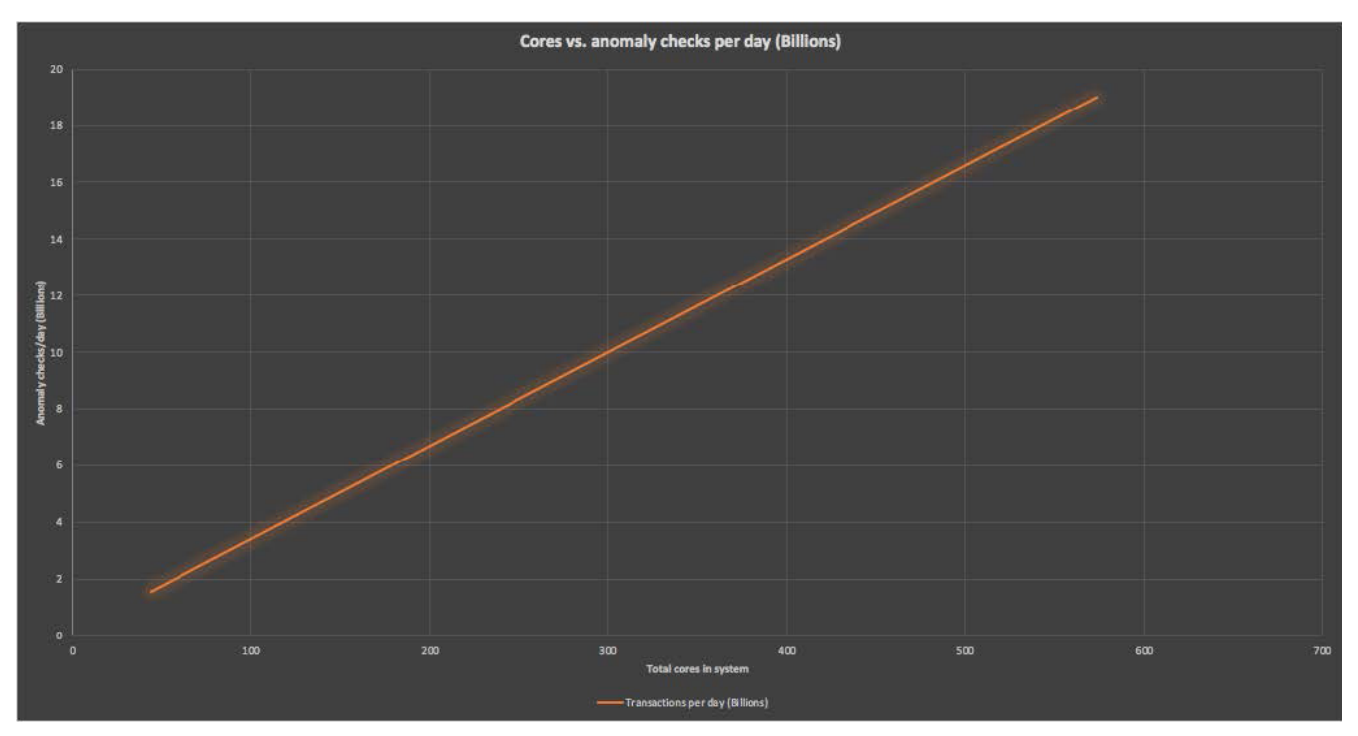
With a managed Cassandra cluster, it’s simple to add extra nodes. It was, therefore, possible to incrementally increase cluster sizes, develop an appropriate tuning methodology, and implement near-linear scalability. The graph below displays with near-linear scalability as the number of total cores increases.
Final experiment results
Considering the use case where Kafka acts as a buffer protecting Cassandra from event load spikes, our goal was for a Kafka cluster to be capable of processing at least 2 million writes per second for several minutes. At the same time, the rest of the anomaly detection pipeline would need to scale to its maximum capacity in order to process the events backlog as quickly as possible, and without being hampered by event load spikes.
In our initial testing, nine Kafka producer Pods were enough to achieve more than 2 million writes per second, when using a Kafka cluster with nine nodes and eight CPU cores per node, with 200 partitions.
When it came to using large clusters to achieve our most substantial results, we used clusters with these specifications (all running in AWS, US East North Virginia):
Instaclustr-managed Kafka cluster — EBS: high throughput 1500 9 x r4.2xlarge-1500 (1,500 GB Disk, 61 GB RAM, 8 cores), Apache Kafka 2.1.0, Replication
Instaclustr-managed Cassandra cluster — Extra Large, 48 x i3.2xlarge (1769 GB (SSD), 61 GB RAM, 8 cores), Apache Cassandra 3.11.3, Replication
AWS EKS Kubernetes cluster Worker Nodes — 2 x c5.18xlarge (72 cores, 144 GB RAM, 25 Gbps network), Kubernetes Version 1.10, Platform Version eks.3
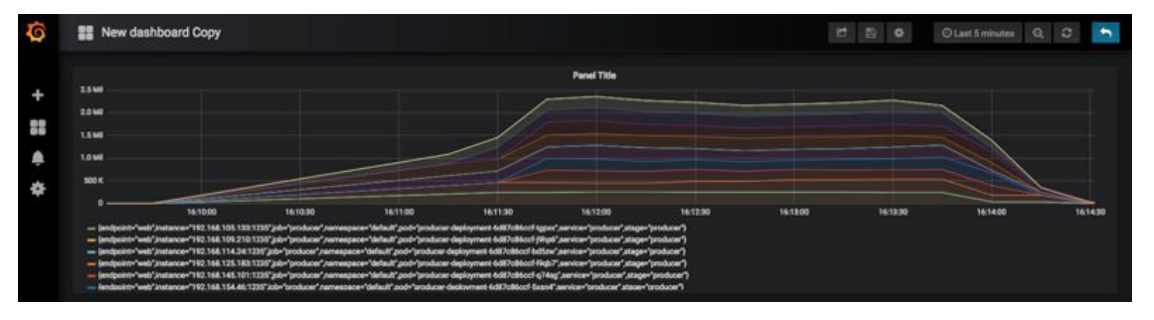
The stacked Grafana graph below displays Prometheus metrics showing that the Kafka producer ramps up from one to nine Kubernetes Pods, with a two-minute load time, and peaks at handling 2.3 million events per second.
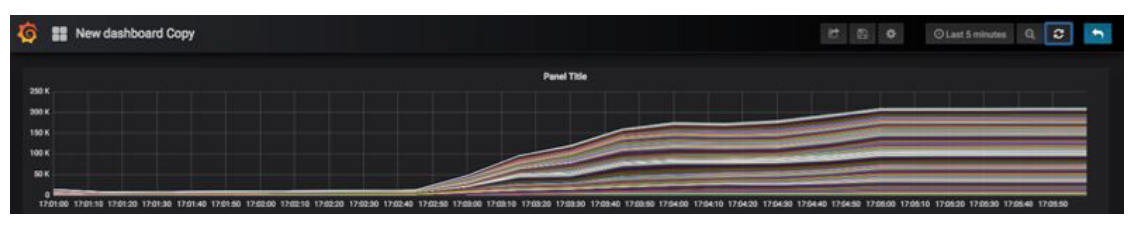
The following graph demonstrates that the anomaly check rate reaches a sustainable 220,000 events per second, and continues to run until all events are processed. In this case, the anomaly detection application is running on 100 Kubernetes Pods.
In summary, Kafka reached a peak of 2.3 million writes per second, and the rest of the pipeline ran a sustainable 220,000 anomaly checks per second. That amounts to a massive 19 billion anomaly checks performed per day.
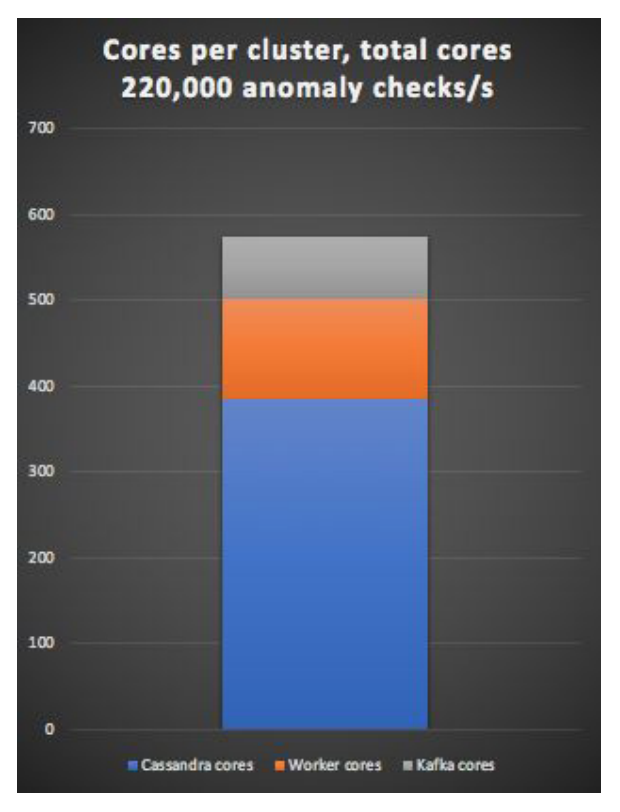
The anomaly detection system uses 574 total cores, with 384 Cassandra cores, 118 Kubernetes cluster worker cores, and 72 Kafka cores. 109 application Pods (for the Kafka producer and detection pipeline) ran on the Kubernetes cluster, along with some Prometheus Pods. All totaled, the system processed 400 anomaly checks per second per core.
Although the Kafka cluster is capable of processing more than ten times the event load as the Cassandra cluster (2.3 million per second versus 220,000 per second), the Cassandra cluster is more than five times the size of the Kafka cluster. Therefore, it’s clearly more practical to take the approach of using Kafka as a buffer to deal with load spikes as opposed to increasing the number of nodes in the Cassandra cluster by 10x.
Comparing this experiment with others, a similar system with its results published last year reached 200 anomaly checks per second using 240 cores. This system used supervised anomaly detection, requiring once-daily training of classifiers, for which the development team used Apache Spark for machine learning, feature engineering, and classification, along with Kafka and Cassandra.
Adjusting for the different resources powering each system, our experience achieved a result with approximately 500 times more throughput, as well as faster real-time latency. The other system also featured more overhead because of its feature engineering phase, and the use of Apache Spark added up to 200 seconds of latency, making it impossible to offer anomaly detection in real-time.
In contrast, our experiment does provide real-time anomaly detection and blocking, with a detection latency averaging just 500 milliseconds. This processing time does increase if and when the incoming load exceeds the pipeline’s capacity, raising the possibility that detected anomalies would need to be addressed by another method (such as freezing the full account and contacting the customer if necessary).
Cost-effective, scalable anomaly detection
With this anomaly detection experiment able to scale easily and process 19 billion events each day, it’s fully capable of meeting the needs of even large enterprises (if, of course, it were a go-to-market solution — which it is not). From a price perspective, the cost of running the system using on-demand AWS instances amounts to $1000 per day — so for just one dollar, it’s possible to run anomaly checks on 19 million events.
Total costs to a business would also need to account for the development of the anomaly detection application, as well as ongoing maintenance, managed service costs, and other related expenses. Because the system is simple to scale up and down, it can easily be fitted to match an enterprise’s specific business requirements, with the total infrastructure costs scaling proportionally as well (for instance, the smallest system tested in our experiment checker 1.5 billion events per day, amounting to about $100 per day in AWS infrastructure costs).
Opinions expressed by DZone contributors are their own.
Comments