Building an Open-Source Observability Toolchain
Read this article to explore the benefits of building an open-source toolchain for the observability of distributed systems and more.
Join the DZone community and get the full member experience.
Join For FreeThis is an article from DZone's 2022 Performance and Site Reliability Trend Report.
For more:
Read the Report
Open-source software (OSS) has had a profound impact on modern application delivery. It has transformed how we think about collaboration, lowered the cost to maintain IT stacks, and spurred the creation of some of the most popular software applications and platforms used today.
The observability landscape is no different. In fact, one could argue that open-source observability tools have been even more transformative within the world of monitoring and debugging distributed systems. By making powerful tools available to everyone — and allowing anyone to contribute to their core construct — open-source observability tools allow organizations of all sizes to benefit from their powerful capabilities in detecting error-prone patterns and offering insights of a framework's internal state.
In this article, we will discuss the benefits of building an open-source toolchain for the observability of distributed systems, strategies to build an open-source observability framework, best practices in administering comprehensive observability, and popular open-source tools.
Embracing an Open-Source Observability Framework
In spite of their individual benefits, observability tools have limited scope and are mostly focused to monitor only one of the key pillars of observability. Adopting multiple tools also discourages the concept of a single source of truth for comprehensive observability. As an alternative to using individual tools for observing indicators, an observability platform helps with contextual analysis by enriching the data collected by monitoring, logging, and tracing tools. A single observability platform also spans the full scope of an organization's distributed systems to give you a comprehensive view of a cluster state.
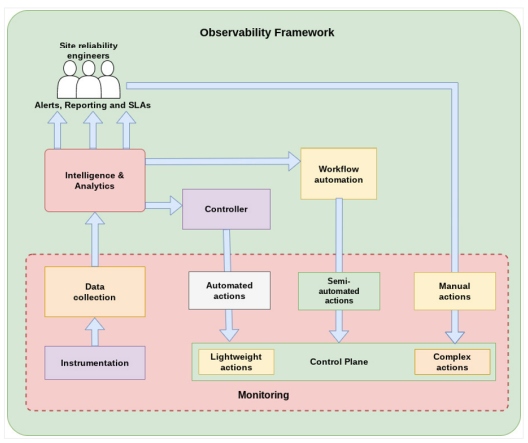
Figure 1: An observability framework in distributed systems
Observability frameworks are typically categorized into:
- Centralized frameworks – These are typically designed for large enterprises that consume a lot of resources and need to monitor numerous distributed systems at once. As such frameworks are supported by a lot of hardware and software, they are expensive to set up and maintain.
- Decentralized frameworks – These frameworks are preferred for use cases that do not immediately require as much equipment or training and that do require a lower up-front investment towards software licenses. As decentralized frameworks aid collaboration and allow enterprises to customize source code to meet specific needs, these are considered to be one of the popular choices when building an entire tech stack from scratch.
Benefits of Using Open-Source Observability Tools
Observability in itself is built around the open-source concept that relies on the decentralized access of key indicators for collaborative action and performance enhancement. Building an open-source framework for observability relies on fewer dependencies than centralized, proprietary software solutions.
Many organizations use OSS because it’s free and easy to use, but there’s more to it than that. Open-source tools also offer several advantages over proprietary solutions to monitor how your applications are performing. Beyond monitoring application health, open-source observability tools enable developers to retrofit the system for ease of use, availability, and security. Using OSS tools for observability offers numerous other benefits, including:
- Easily extensible for seamless integration with most modern stacks
- Being vendor-agnostic, which helps observe multi- or hybrid-cloud setups
- Easy customization to support various use cases
- Enhanced visibility and alerting by factoring custom anomalies
- Accelerated development workflows by using pre-built plugins and code modules
- Low operating investment by saving on license costs
- Community contributions for enhancements and support
Strategies To Build an Open-Source Observability Framework
In order to get the most out of an open-source observability framework, it is important to embrace the principles of openness and collaboration. For comprehensive observability, it is also important to factor in crucial considerations when building an observability framework with open-source tools.
Some recommended strategies to build an open-source observability framework include proactive anomaly detection, time-based event correlation, shift-left for security, and adopting the right tools.
Proactive Anomaly Detection
An optimally designed observability framework helps predict the onset of potential anomalies without being caught off-guard. It is important to be able to identify the root cause and fix the problem before it impacts the cluster performance or availability.
A distributed system's observability strategy should be built upon the four golden signals: latency, saturation, errors, and traffic. These signals are key representations of the core aspects of a cluster state’s services that collectively offer a contextual summary of its functioning and performance issues.
Although the high-level information produced by these signals might not be granular on its own, when combined with other data of the key pillars, such as event logs, metrics, or traces, it's easier to pinpoint the source of a problem (see Figure 2).
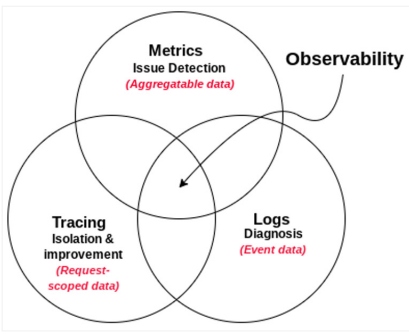
Figure 2: Key pillars of observability
Time-Based Event Correlation
Event logs offer rich insights to identify anomalies within distributed systems. Use open-source tools that help capture occurrences, such as when an application process was executed successfully or a major system failure occurred. Contextual analysis of such occurrences helps developers quickly identify faulty components or interactions between endpoints that need attention.
Logs should also combine timestamps and sequential records of all cluster events. This is important because time-series data helps correlate events by pinpointing when something occurred, as well as the specific events preceding the incident.
Shift Left for Security
Open-source tools are often considered vulnerable to common attack patterns. As a recommended strategy, open-source tools should be vetted for inherent flaws and potential configuration conflicts they may introduce to an existing stack. The tools should also support the building of an observability framework that complements a shift-left approach for security, which eliminates the need for reactive debugging of security flaws in production environments.
Beyond identifying the root cause of issues, the toolchain should enrich endpoint-level event data through continuous collection and aggregation of performance metrics. This data offers actionable insights to make distributed systems self-healing, thereby eliminating manual overheads to detect and mitigate security and performance flaws.
Adopting the Right Tools
Observing distributed systems extensively relies on a log and metrics store, a query engine, and a visualization platform. There are different observability platforms that focus on measuring these indicators individually. Though they work independently, several of them work together extremely well, creating comprehensive observability setups tailored to an organization’s business objectives.
Along with considerations for the observability components, consider what it means to observe a system by factoring in scalability. For instance, observing a multi-cloud, geographically distributed setup would require niche platforms when compared to monitoring a monolithic, single-cluster workload.
Administering Observability for Performance and Site Reliability
By providing in-depth insights of software processes and resources, observability allows site reliability engineers (SREs) to assure optimum performance and health of an application. However, the challenges of observing the state and behavior of a distributed system are often more complex than assumed. While it is important to inspect the key indicators, it is equally important to adopt the right practices and efficient tools that support observability to collectively identify what is happening within a system, including its state, behavior, and interactions with other components.
Some recommended best practices to enable effective observability in distributed systems include:
- Enforce the use of service-level agreements (SLAs) in defining performance indicators
- Use deployment markers for distributed tracing
- Set up alerts only for critical events
- Centralize and aggregate observability data for context analysis
- Implement dynamic sampling for optimum resource usage and efficient pattern sampling
Popular Open-Source Tools for Observability of Distributed Systems
There are several open-source observability tools that can provide insight into system performance, identify and diagnose problems, and help you plan capacity upgrades. While each tool comes with its own strengths and weaknesses, there are a few that stand out above the rest. It is also a common approach to use them together to solve different complexities. The table below outlines some popular open-source observability tools, their core features, benefits, and drawbacks to help understand how they differ from each other.
| Tools | Best Known For | For Benefits | Drawbacks |
|---|---|---|---|
| LogStash | Log collection and aggregation |
|
Lacks content routing capabilities |
| Fluentd | Collection, processing, and exporting of logs |
|
Adds an intermediate layer between log sources and destinations, eventually slowing down the observability pipeline |
| Prometheus with Grafana | Monitoring and alerting |
|
Lacks long-term metric data storage for historical and contextual analysis |
| OpenTelemetry | Observability instrumentation |
|
Does not provide a visualization layer |
Summary
Observability is a multi-faceted undertaking that involves distributed, cross-functional teams to own different responsibilities before they can trust the information presented through key indicators. Despite the challenges, observability is essential for understanding the behavior of distributed systems. With the right open-source tools and practices, organizations can build an open-source observability framework that ensures systems are fault-tolerant, secure, and compliant. Open-source tools help design a comprehensive platform that is flexible and customizable to an organization’s business objectives while benefiting from the collective knowledge of the community.
This is an article from DZone's 2022 Performance and Site Reliability Trend Report.
For more:
Read the Report
Opinions expressed by DZone contributors are their own.
Comments