Building Observable Applications With OpenTelemetry
In this article, learn how to start instrumenting your applications for observability and gain insights into how they operate.
Join the DZone community and get the full member experience.
Join For FreeIn the ever-evolving landscape of software development, complexity is a constant companion. As applications grow and evolve, they become increasingly intricate, making it more challenging to monitor, understand, and optimize their behavior. Developers are increasingly responsible for adding instrumentation into their code so the inner workings of their applications can be observed externally. That data then provides valuable insights to stakeholders across the business.
This is where the concept of observability comes into play. Observability, in the context of software, refers to the ability to understand the internal state of a system by examining its outputs. It's like being able to understand what's happening inside a machine by just looking at the dials and gauges on its control panel.
In this blog, we explain why instrumentation is important and demonstrate easy ways to make your projects observable.
Why Observability Is Important
The process of building business applications has evolved dramatically over the past 20 years. We’ve evolved from using large and complex monolithic applications located in data centers to designing solutions with smaller interconnected services and components. These methods may produce a similar result from a user’s point of view, but they are far more efficient and cost-effective for businesses, and easier to troubleshoot for IT teams.
As a developer, many years ago you might have had access to a dashboard that monitored how a business application was performing. If a server started flashing red on the dashboard, someone would be sent to inspect the hardware and find out if its hard drive was full, or if it had an issue with its power supply. But times have changed. Now software is extremely complex and relies on a diverse range of interconnected components that all need to work in order for the business to function.
Today’s applications have so many components that it’s impossible to display all of them on a single dashboard. Organizations have also become more complex, with multiple teams such as DevOps and product management wanting to know how the application or solution works.
So how can developers continue to innovate in this environment? We’ve all seen how, as software becomes more complicated, and codebases interconnect, unexpected behavior—and bugs—emerge. This means that developers spend more time fixing bugs and less on developing new features and functionality that add competitive advantages to a product.
Using Metrics, Logs, and Traces
The way to solve these issues is to develop software that is instrumented, which makes it observable. This means that the software sends out signals that can help developers and product managers determine how it’s functioning. It’s important for developers to create strict and well-defined boundaries between different services and microservices so they can identify where problems are occurring, and stop them from propagating to connected resources.
Metrics provide numeric value measurements of events, such as the time taken for a transaction to complete, or how many customers viewed a video. Metrics make it possible to identify trends and understand performance over time.
Logs list the events that occur in the application. Developers need to build their applications to produce a log entry whenever there is a significant action, for example, when a transaction fails or a resource is accessed.
Traces provide the end-to-end lifecycle of a request as it passes through multiple parts of a system. If you can understand the full journey of a request, you can identify bottlenecks that might affect system performance.
Developers are responsible for instrumenting their code and making observability a characteristic of their applications. If an application is properly instrumented, it’s much easier to troubleshoot and manage. Observability can alert developers of problems before they happen, such as potential scaling issues if load increases. It can even answer non-technical questions, such as how long it takes for a customer to complete a transaction, or search for a specific product.
Overview of OpenTelemetry and AWS Distro for OpenTelemetry (ADOT)
OpenTelemetry is a Cloud Native Computing Foundation (CNCF) project that provides a single set of APIs, libraries, agents, and collector services to capture distributed traces and metrics from your application. It's a vendor-neutral tool that allows you to instrument your applications once and send the telemetry data to any backend of your choice.
AWS Distro for OpenTelemetry (ADOT) is a secure, production-ready, AWS-supported distribution of the OpenTelemetry project. With ADOT, you can easily instrument your applications running on AWS and send the data to the AWS observability services. ADOT includes enhanced support for AWS services and AWS SDKs, providing you with a seamless and efficient observability solution.
How To Instrument Code Using AWS
Instrumenting your code involves adding code to your application to generate observability data.
You can manually instrument your code by adding annotations or a few lines of code to create spans, which are units of work within a trace. For example, you might create a span for a complex calculation or a call to an external service. This allows you to isolate parts of your application in the visual trace that is generated, making it easier to identify and debug issues.
For instance, if you have a Python application running on AWS Lambda, you can use the OpenTelemetry Python library to instrument your code. Here's an example of how you might create a span:
from opentelemetry import trace


tracer = trace.get_tracer(__name__)


with tracer.start_as_current_span("my_span"):

    # Your code here
In this example, a new span named my_span is created for the code inside the with block. This span will appear in the trace visualizations in your observability tool, allowing you to see how long the code inside the span took to execute and how it relates to other spans in the trace.
AWS also provides services such as AWS X-Ray, which provides a complete view of requests as they travel through your application, and Amazon CloudWatch, which collects and visualizes real-time logs, metrics, and event data in automated dashboards. ADOT supports exports to X-Ray and CloudWatch as well.
Apart from logs, traces, and metrics, ADOT provides a fourth instrumentation tool called Baggage. Baggage can show contextual information - for example, a Client ID - that can be passed along different race spans to provide valuable insights into the end-to-end experiences of a client’s journey through the system.
How to Get Started With ADOT
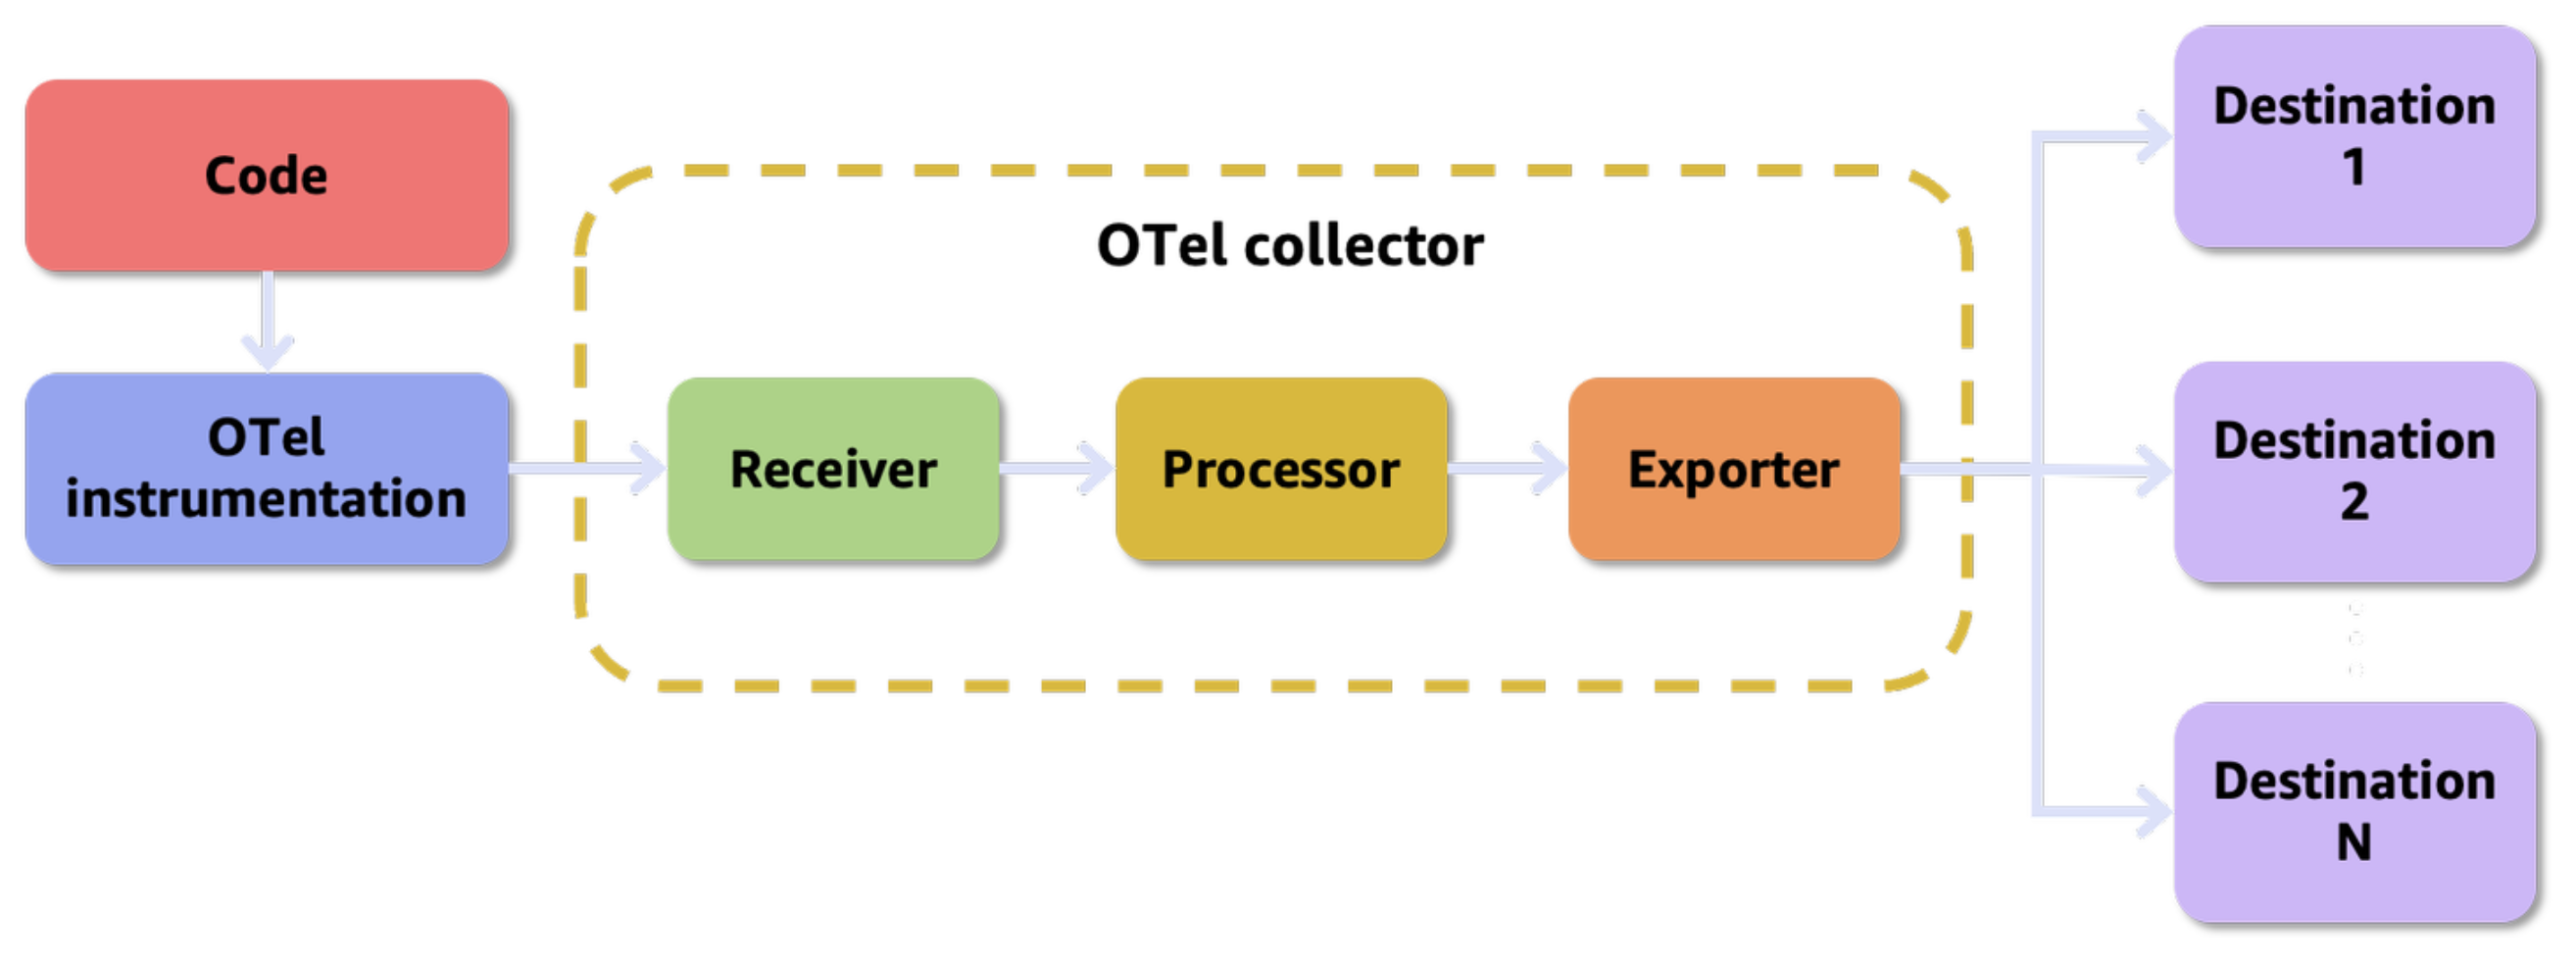
To get started with ADOT, you need to set up the OpenTelemetry Collector, configure it to collect traces and metrics, and then send the data to AWS observability services.
You can use the ADOT Lambda layer for AWS Lambda functions. This layer includes the OpenTelemetry Collector, which collects and exports telemetry data. You can add this layer to your Lambda function in the AWS Management Console, AWS CLI, or in your SAM or CloudFormation template.
For Amazon ECS and Amazon EKS services, you can use the ADOT container image. This image includes the OpenTelemetry Collector and can be used as a sidecar container in your ECS tasks or EKS pods. The sidecar container collects and exports telemetry data from the other containers in the task or pod.
Summary
Building observable applications is crucial in today's complex software landscape. With OpenTelemetry and AWS, you can easily instrument your applications, collect and analyze traces, logs, and metrics, and gain deep insights into your application's performance and behavior. Whether you're running a serverless application on AWS Lambda or a containerized application on Amazon ECS or EKS, ADOT makes it easy to get started with observability.
As a developer, it’s important that you build code that’s well-instrumented and observable. This is the best way to ensure your systems are secure, extensible, and maintainable. Note that these are all non-functional requirements, they have nothing to do with the actual functions of the application itself.
Remember, the key to successful observability is not just about collecting data: it's about asking the right questions, understanding the data you have, and using that data to make informed decisions. So, start instrumenting your applications today and gain the insights you need to build better applications tomorrow.
If you are interested, watch the on-demand session on this topic presented at AWS re:Invent 2022.
Opinions expressed by DZone contributors are their own.
Comments