

How Cache Invalidation Caused Memory Pressure and API Failures at Scale
Aggressive cache invalidation caused memory pressure, latency spikes, and request failures. Reducing invalidations with time-based expiry restored success to 99.9%.
 ·
·
Join the DZone community and get the full member experience.
Join For FreeMost production systems do not fail loudly. They degrade quietly.
This case started with an API that was technically “healthy.” It was serving traffic, success rates were high, and no critical alerts were firing. Yet recurring degradation periods caused the service to miss its service-level agreement (SLA) target for request success. During the worst degradation periods, request success could fall to approximately 98%, against a target of 99.9%. Some requests were simply failing. Because the API sat directly in the purchase path, the gap between 98% and 99.9% meant real checkout failures, abandoned transactions, and lost product revenue.
What followed was not a quick fix or a scaling exercise. It was a deep investigation into how memory behavior, caching strategy, and system design interacted under load.
This article walks through that process, not as a theoretical exercise, but as a practical approach to diagnosing and fixing degradation in a live production system.
The Problem: Stable Metrics, Unstable System
At first glance, nothing looked catastrophically wrong, which actually made the investigation significantly harder. Average latency was acceptable. Error rates were low. Infrastructure scaling policies were functioning as expected.
The issue appeared only when looking at tail behavior. 95th- and 99th-percentile (P95 and P99) latencies were inconsistent. During traffic spikes, request failures increased. Retries amplified the load, which further stressed the system. Predictably, the worst incidents happened during high-traffic events like Black Friday and Christmas sales.
EEE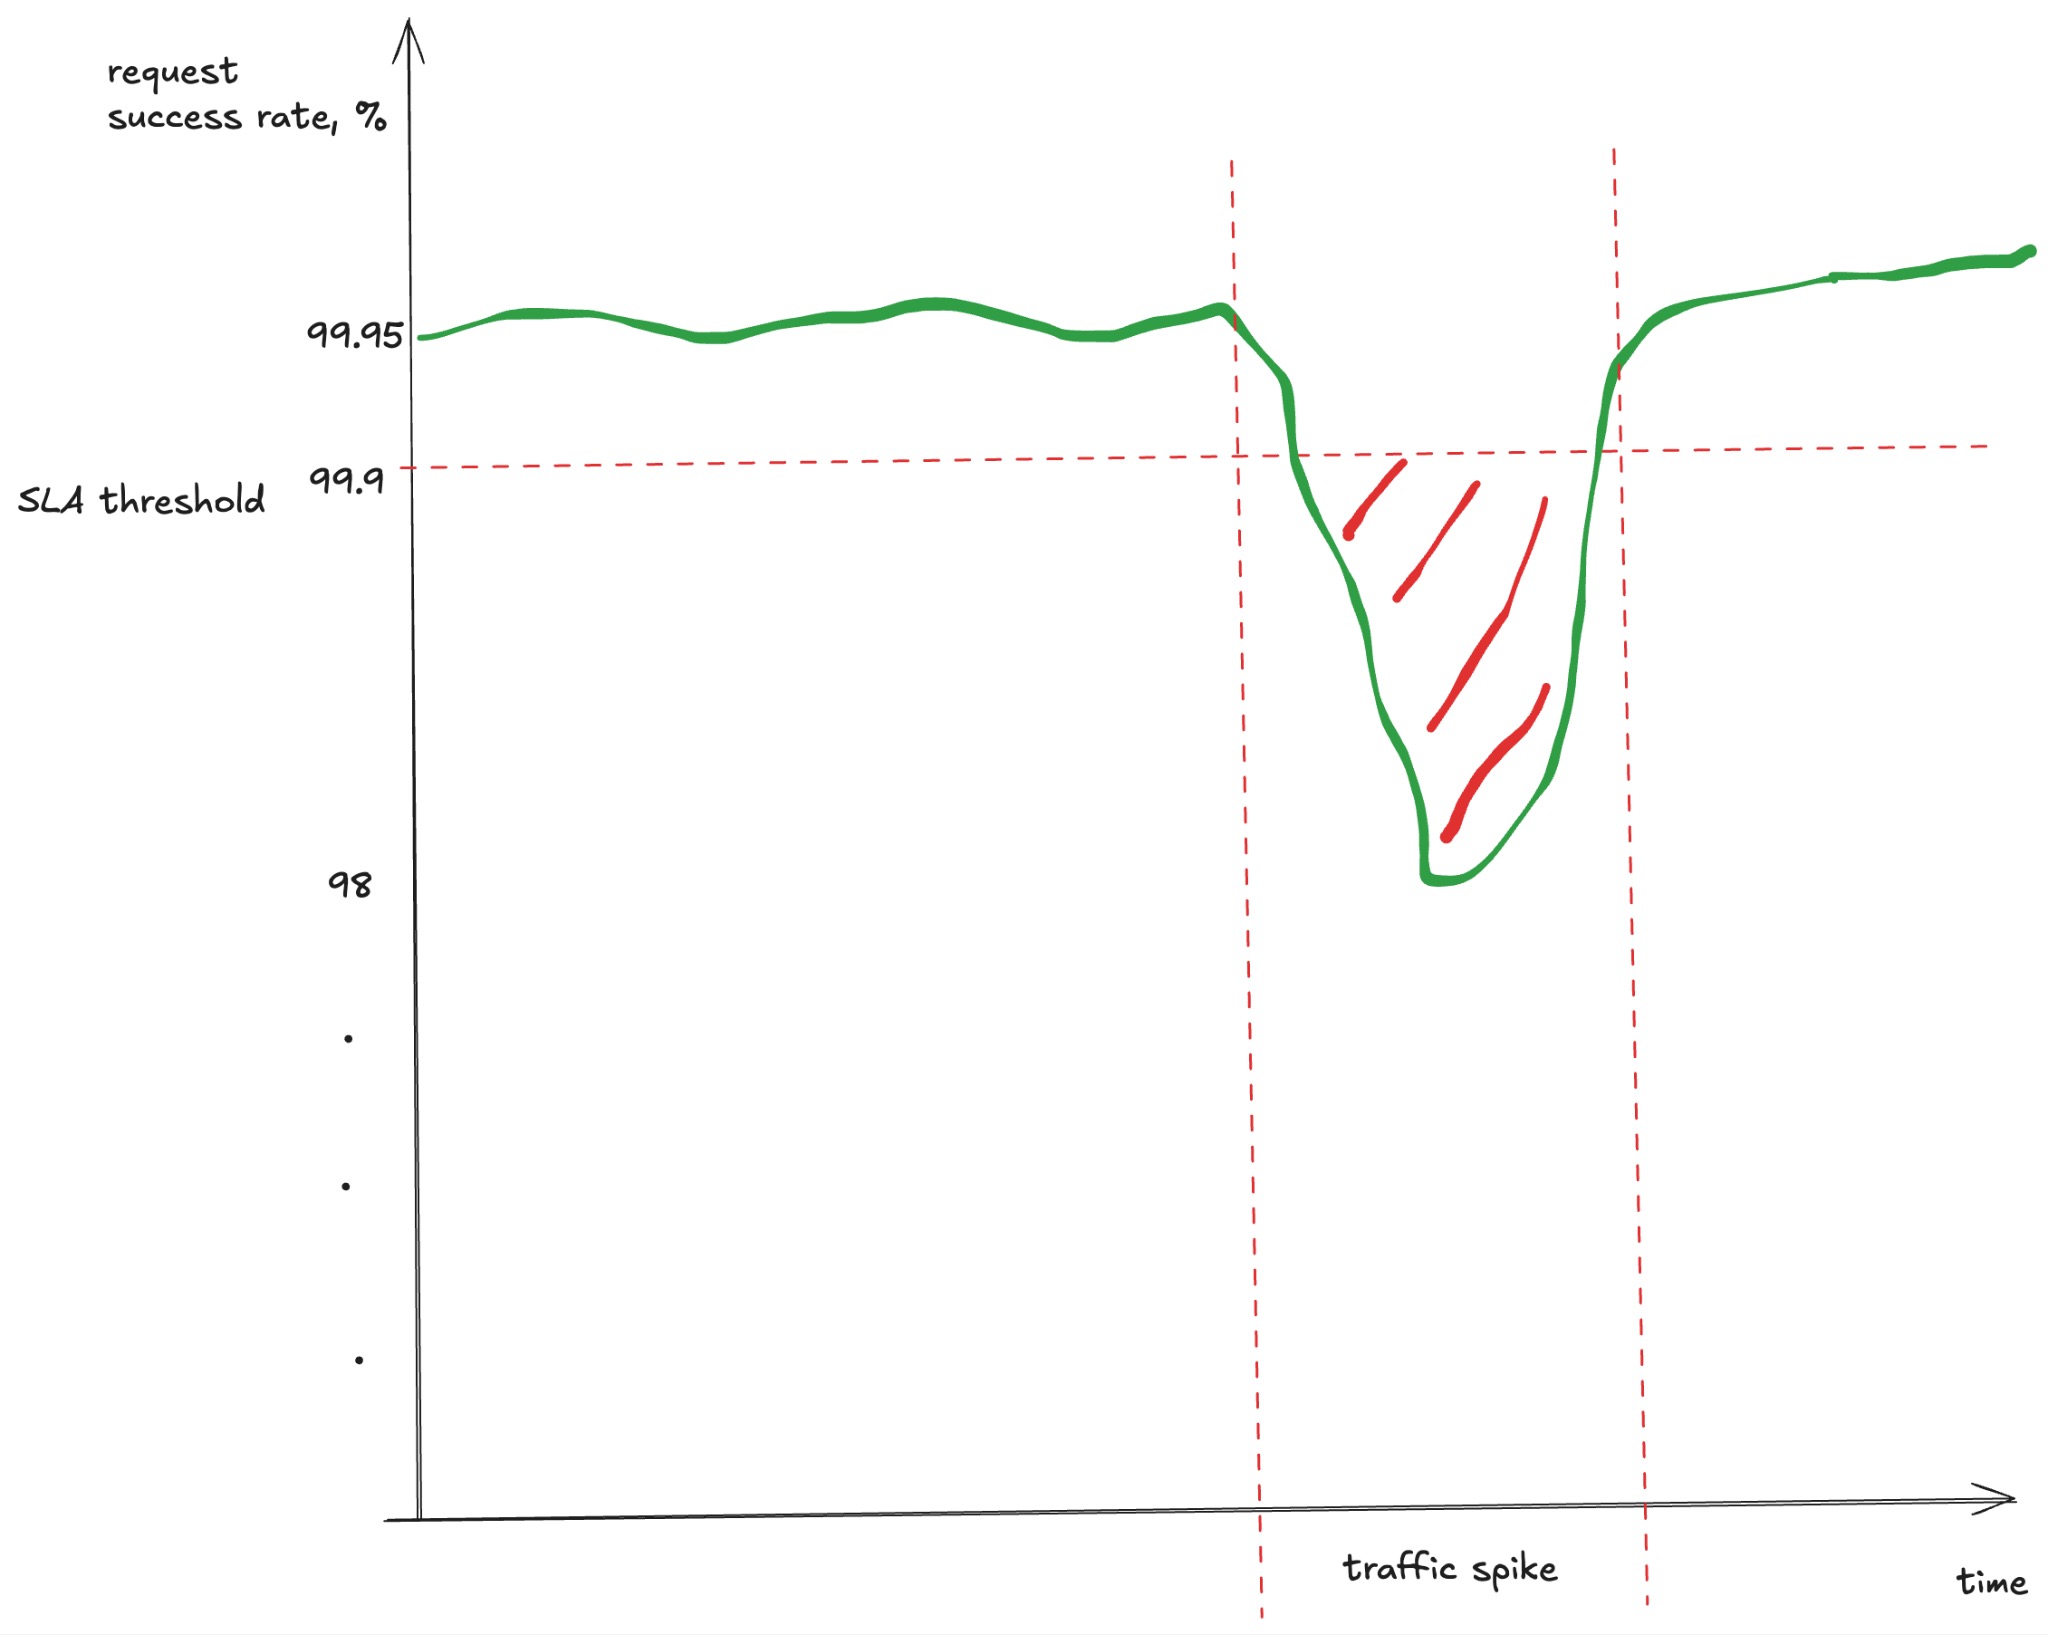
Observability First, Always
The investigation began with correlating signals across metrics, traces, and logs.
Memory utilization was the first thing to check. Under peak load, memory usage would spike sharply, followed by increased garbage collection activity. These GC cycles introduced latency pauses that aligned closely with SLA drops.
To make this visible, memory and latency were tracked together:
def record_metrics(latency_ms, heap_used, gc_pause_ms):
    metrics.emit("api.latency", latency_ms)
    metrics.emit("api.heap_used_mb", heap_used)
    metrics.emit("api.gc_pause_ms", gc_pause_ms)
(This and the following snippets are simplified pseudocode. Implementation details have been generalized.)
Distributed traces added more context. Slow requests were not uniformly distributed. They clustered around specific execution paths tied to cache interactions.
Structured logs filled in the missing detail.
def log_cache_event(key, action, size):
    logger.info({
        "event": "cache",
        "key": key,
        "action": action,
        "size_bytes": size
    })
By logging cache events and request metadata, it became clear that latency spikes often followed bursts of cache invalidation activity.
The timing was the strongest clue. Latency degradation did not appear randomly or simply whenever traffic increased. It consistently followed spikes in cache invalidation activity. Those invalidations triggered recomputation, which increased memory allocations and garbage collection pressure shortly afterward.
That made a simple capacity shortage less likely as the primary cause: adding more capacity might have provided additional headroom, but it would not have explained why degradation repeatedly followed the same application-level event. For the same reason, we treated increased GC activity as a consequence of the problem rather than the root cause.
The system was not randomly degrading. It was reacting to specific internal behavior.
Root Cause: Memory Pressure From Invalidation
The API used a result invalidation mechanism to ensure freshness. When upstream data changed, cached results were aggressively invalidated and recomputed.
On paper, the design made perfect sense. In production, it became the source of instability.
Frequent invalidation caused repeated recomputation, and each recomputation allocated new objects. Under load, this led to memory churn and extra heap pressure.
A simplified version of the logic looked roughly like this:
def get_result(key):
    if cache.is_invalidated(key):
        result = recompute(key)
        cache.set(key, result)
        return result
    return cache.get(key)
The issue was not correctness. It was frequency. Hot keys were invalidated too often, and the cache never stabilized. The system kept rebuilding the same data repeatedly.
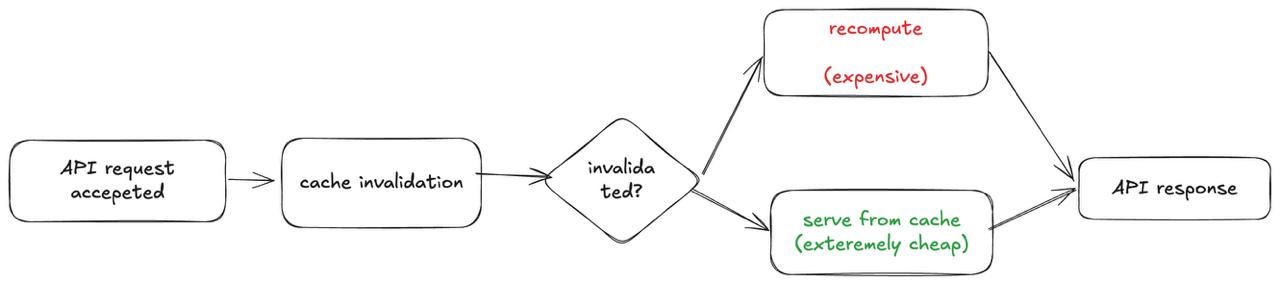
The system was operating correctly, but it was still unstable under load.
Designing the Experiment
The working hypothesis was relatively straightforward. The invalidation strategy was too aggressive and was the primary driver of memory pressure.
Rather than rewriting the mechanism, the team introduced controlled changes.
The core experiment was to disable result invalidation before serving responses, allowing cached data to persist longer until the cache naturally evicted older entries.
def get_result_no_invalidation(key):
    result = cache.get(key)
    if result is not None:
        return result
    result = recompute(key)
    cache.set(key, result)
    return result
This change was not deployed globally. It was introduced behind a feature flag and rolled out gradually.
def get_result_with_flag(key, user_id):
    if feature_flags.is_enabled("disable_invalidation", user_id):
        return get_result_no_invalidation(key)
    return get_result(key)
Before rollout, baseline metrics were captured. Memory usage, GC frequency, cache hit rate, and latency distributions were measured to establish a comparison point.
Evaluating the Tradeoff
Disabling invalidation introduces risk. Data may become stale. The question was whether that staleness was actually a problem.
It turned out that the underlying data did not require strict freshness. Close to 99% of the underlying data changed no more frequently than once every 10 minutes. Recomputing cached results much more often than the source data itself changed was simply wasting resources.
To bound the amount of staleness while reducing the load, we introduced time-based expiry:
def get_result_with_ttl(key, ttl_seconds=300):
    entry = cache.get_with_metadata(key)
    if entry and not entry.is_expired(ttl_seconds):
        return entry.value
    result = recompute(key)
    cache.set(key, result)
    return result
This ensured that data would eventually refresh without triggering excessive recomputation.
Rollout and Validation
To prevent destabilizing the system even further, we decided to roll out the change gradually. A small percentage of traffic was routed through the new logic.
The effect was visible almost immediately. Heap graphs flattened, GC pauses dropped, and the latency spikes that had dominated dashboards during peak traffic largely disappeared. Retry rates decreased. The system stopped amplifying its own load. User-facing request failures dropped significantly.
As confidence grew, we expanded the feature flag to cover all traffic.
Measurable Impact
We saw a clear improvement after the change was implemented and rolled out. After the rollout, request success returned to approximately 99.9%, and the degradation periods that had pushed it toward 98% largely disappeared.
The API powered a public-facing e-commerce system and sat directly on the purchase request path, so latency spikes and failed requests translated into abandoned purchase flows and failed transactions.
During the rollout, we also measured an increase in product revenue.
This is often the missing link in engineering discussions. Reliability work is not just about writing postmortems and creating action items. It can also have a visible monetary impact.
Lessons From the Fix
The most important lesson is that degradation rarely comes from a single failure. It emerges from the complex interactions of multiple system components.
In this case, caching, memory management, and retry behavior combined to create instability.
Another key insight is that correctness and reliability are often in tension. A system that is perfectly fresh but unstable is less useful than one that is slightly stale but consistently available.
Finally, observability was essential to diagnosing this problem. Without high-quality signals, this issue would have been misdiagnosed as a capacity problem. The fix would have been scaling infrastructure, not addressing the root cause.
Closing Thoughts
Restoring the API to its 99.9% SLA target was not about incremental tuning. It requires identifying and correcting fundamental inefficiencies.
In this case, the turning point was recognizing that a well-intentioned mechanism was harming the system under real-world conditions.
The broader takeaway is that production systems rarely collapse because of a single catastrophic failure. When systems degrade without failing, the answer is rarely more infrastructure. It is often better visibility, disciplined experimentation, and the willingness to challenge default design choices.
Opinions expressed by DZone contributors are their own.
Comments