ChartistJSF: A Responsive Chart Library for Java Server Faces (JSF) Apps
ChartistJSF offers a wonderful library of interactive charts that offer a responsive interface for your users. Learn how to create these charts here!
Join the DZone community and get the full member experience.
Join For FreeChartistJSF is a responsive and simple chart library forJava Server Faces (JSF) applications. ChartistJSF is based on Chartist.js, which is a lightweight and responsive JavaScript-based chart library. To be compatible with Java Server Pages applications, ChartistJSF is built on the top of PrimeFaces.
ChartistJSF offers several benefits when compared to other chart libraries. In ChartistJSF, styles and functionalities are separated, so there is a great deal of flexibility in maintaining charts. Another note about ChartistJSF is the use of SVG instead of canvas-based graphics. SVG graphics are more lightweight, have good presentation quality and, because of their XML-based structure, their elements can be easily manipulated using JavaScript and CSS. Moreover, by using the @media query of CSS (thanks to the separation of styles and functionality), charts are responsive and more controllable. Last but not least, ChartistJSF supports AJAX updates.
ChartistJSF provides three types of charts: line charts, bar charts, and pie charts. Integrating any of these charts in JSF applications is easy and straightforward by following four simple steps:
To begin the PrimeFaces and ChartistJSF libraries must be available in the project. These libraries can be acquired via Maven or downloaded separately.
Same as every JSF based application, a managed bean has to be created to back the chart model.
Chart model, data series, and a listener method (to react to chart interactions events such as selecting an item on the chart) are defined in the managed bean.
To graphically present the data model, chart components have to be added to the xhtml file.
Let’s demonstrate how easily each of these charts can be integrated into a demo JSF application by following the above four steps.
Line Chart:
The first step is to add a dependency to the required libraries. In this demonstration, ChartistJSF 2.1 is used. For ChartistJSF version 2.1, PrimeFaces version 6 has to be available in the project. In a Maven based project, the dependencies to ChartistJSF andPrimeFaces are:
<dependency>
    <groupId>org.chartistjsf</groupId>
    <artifactId>ChartistJSF</artifactId>
    <version>2.1</version>
</dependency>

<dependency>
    <groupId>org.primefaces</groupId>
    <artifactId>primefaces</artifactId>
    <version>6.0</version>
</dependency>
Next step is to create a managed bean. The ChartBackBean.java bean contains:
- The Chart model: LineChartModel.
- Data series: Two data series with some random numbers will be created for demonstration purposes.
- A Listener method to react to onClick events from the chart. This method reacts when an item on the chart is selected. The value of the selected item will be presented below the chart by the help of PrimeFaces messaging mechanism.
The LineChartBean.java managed bean is as follows:
@ManagedBean
public class ChartBackBean {

    private LineChartModel lineChartModel;

    public ChartBackBean () {
        createLineModel();
    }

    public void createLineModel() {

        lineChartModel = new LineChartModel();
        lineChartModel.setAspectRatio(AspectRatio.GOLDEN_SECTION);

        lineChartModel.addLabel("1");
        lineChartModel.addLabel("2");
        lineChartModel.addLabel("3");
        lineChartModel.addLabel("4");
        lineChartModel.addLabel("5");
        lineChartModel.addLabel("6");
        lineChartModel.addLabel("7");
        lineChartModel.addLabel("8");

        LineChartSeries lineChartSeries1 = new LineChartSeries();
        lineChartSeries1.setName("Series 1");

        lineChartSeries1.set(12);
        lineChartSeries1.set(21);
        lineChartSeries1.set(7);
        lineChartSeries1.set(15);
        lineChartSeries1.set(12);
        lineChartSeries1.set(21);
        lineChartSeries1.set(7);
        lineChartSeries1.set(15);

        LineChartSeries lineChartSeries2 = new LineChartSeries();
        lineChartSeries2.setName("Series 2");

        lineChartSeries2.set(14);
        lineChartSeries2.set(2);
        lineChartSeries2.set(8);
        lineChartSeries2.set(9);
        lineChartSeries2.set(14);
        lineChartSeries2.set(2);
        lineChartSeries2.set(8);
        lineChartSeries2.set(9);
        Axis xAxis = lineChartModel.getAxis(AxisType.X);
        lineChartModel.addSeries(lineChartSeries1);
        lineChartModel.addSeries(lineChartSeries2);
        lineChartModel.setAnimateAdvanced(true);
        lineChartModel.setShowTooltip(true);
    }

    public void itemSelect(ItemSelectEvent event) {

       FacesMessage msg = new FacesMessage(FacesMessage.SEVERITY_INFO, "Item selected", "Item Value: "+
((ChartSeries) lineChartModel.getSeries().get(event.getSeriesIndex())).getData().get(event.getItemIndex())
                + ", Series name:" +
 ((ChartSeries) lineChartModel.getSeries().get(event.getSeriesIndex())).getName());

        FacesContext.getCurrentInstance().addMessage(event.getComponent().getClientId(), msg);
    }
    public LineChartModel getLineModel() {
        return lineChartModel;
    }
    public void setLineModel(LineChartModel lineModel) {
        this.lineChartModel = lineModel;
    }
}
The LineChartModel class provides methods to control other properties of the chart model. For instance, the animation property of the chart can be controlled by the setAnimateAdvanced(Boolean boolean) method.
To add the chart model component to the .xhtml page, the following name space has to be added to the page:
xmlns:ct=http://www.chartistjsf.org/charts
The chart component is then added by:
<ct:chart id="lineChart" type="line" model="#{lineChartBean.lineModel}"/>
To make the chart send and receive ajax messages, the following line has to be added inside the <ct:chart/> tags:
<p:ajax event="itemSelect" listener="#{ lineChartBean.itemSelect}" update="lineChartMessage" />
And finally to react to ajax updates, the PrimeFaces message components are used for this demonstration:
<p:message id="lineChartMessage" for="lineChart" showDetail="true" />
<html xmlns="http://www.w3.org/1999/xhtml"
      xmlns:h="http://java.sun.com/jsf/html"
      xmlns:f="http://java.sun.com/jsf/core"
      xmlns:ui="http://java.sun.com/jsf/facelets"
      xmlns:p="http://primefaces.org/ui"
      xmlns:ct="http://www.chartistjsf.org/charts">

    <f:view contentType="text/html">
        <h:head>
            <f:facet name="first">
                <meta content='text/html; charset=UTF-8' http-equiv="Content-Type"/>
                <title>Prime Faces</title>
            </f:facet>
        </h:head>
        <h:body>
            <div style="width: 60%; height: 60%; margin-left: auto; margin-right: auto; margin-top: auto; margin-bottom: auto;">
                <ct:chart id="lineChart" type="line" model="#{lineChartBean.lineModel}">
                    <p:ajax event="itemSelect" listener="#{lineChartBean.itemSelect}" update="lineChartMessage"  />
                </ct:chart>
            </div>
            <p:message id="lineChartMessage" for="lineChart" showDetail="true" />
        </h:body>

    </f:view>
</html>
The result is a pretty line chart which reacts to users interactions.
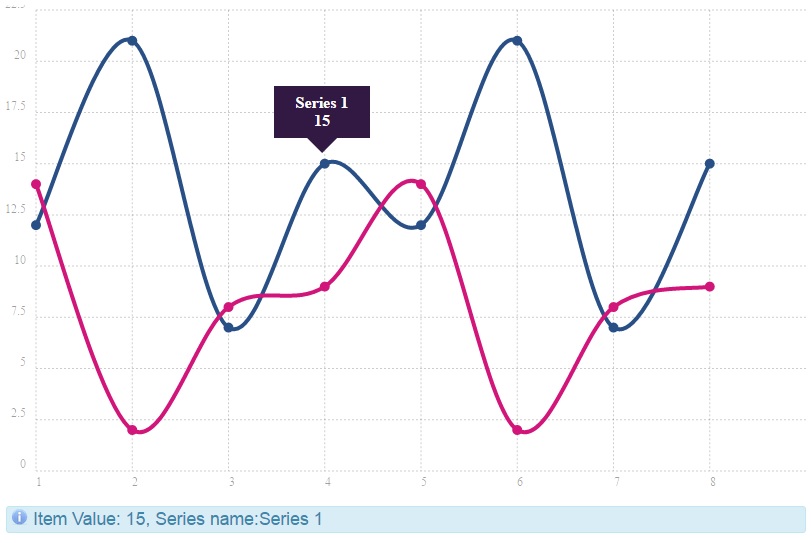
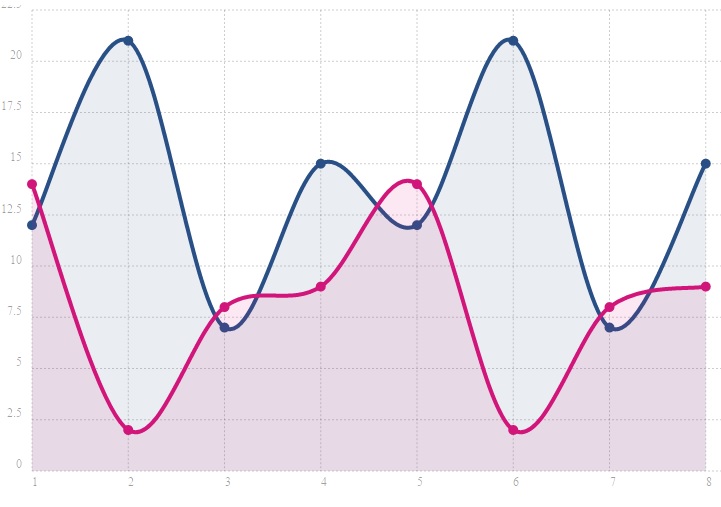
By setting the .setShowArea(Boolean boolean) to true on the chart model, the line chart transformed to an Area chart.
The same procedure can be done to construct the Bar and Pie charts.
Bar Chart:
BarChartDataBean.java
@ManagedBean
public class BarChartDataBean {

private BarChartModel barChartModel;

public BarChartDataBean() {
createBarModel();
}

public void createBarModel() {

barChartModel = new BarChartModel();
barChartModel.setAspectRatio(AspectRatio.GOLDEN_SECTION);

barChartModel.addLabel("Measure1");
barChartModel.addLabel("Measure2");
barChartModel.addLabel("Measure3");
barChartModel.addLabel("Measure4");
barChartModel.addLabel("Measure5");

BarChartSeries series1 = new BarChartSeries();
series1.setName("First Series");

series1.set(19);
series1.set(27);
series1.set(12);
series1.set(33);
series1.set(40);

BarChartSeries series2 = new BarChartSeries();
series2.setName("Second Series");

series2.set(13);
series2.set(61);
series2.set(16);
series2.set(28);
series2.set(11);

BarChartSeries series3 = new BarChartSeries();
series3.setName("Third Series");

series3.set(18);
series3.set(11);
series3.set(21);
series3.set(53);
series3.set(48);


Axis xAxis = barChartModel.getAxis(AxisType.X);
xAxis.setShowGrid(false);

barChartModel.addSeries(series1);
barChartModel.addSeries(series2);
barChartModel.addSeries(series3);

barChartModel.setShowTooltip(true);
barChartModel.setSeriesBarDistance(15);
barChartModel.setAnimateAdvanced(true);

}

public BarChartModel getBarChartModel() {
return barChartModel;
}

public void setBarChartModel(BarChartModel barChartModel) {
this.barChartModel = barChartModel;
}

public void barItemSelect(ItemSelectEvent event) {

FacesMessage msg = new FacesMessage(FacesMessage.SEVERITY_INFO, "Item selected", "Item Value: "
+ ((ChartSeries) barChartModel.getSeries().get(event.getSeriesIndex())).getData().get(
event.getItemIndex()) + ", Series name:"
+ ((ChartSeries) barChartModel.getSeries().get(event.getSeriesIndex())).getName());

FacesContext.getCurrentInstance().addMessage(event.getComponent().getClientId(), msg);
}
}
BarChart.xhtml
<div>
    <ct:chart id="barChart" type="bar" model="#{barChartDataBean.barChartModel}">
      <p:ajax event="itemSelect" listener="#{barChartDataBean.barItemSelect}" update="barChartMessage"  />
    </ct:chart>
      <p:message id="barChartMessage" for="barChart" showDetail="true" />
</div>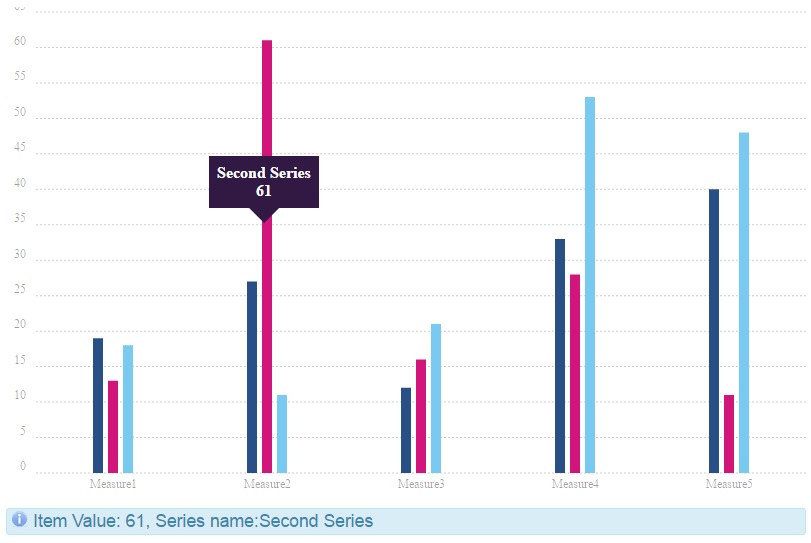
PieChartBean.java
@ManagedBean
public class PieChartBean {
private PieChartModel pieChartModel;
public PieChartBean() {
createPieChart();
}
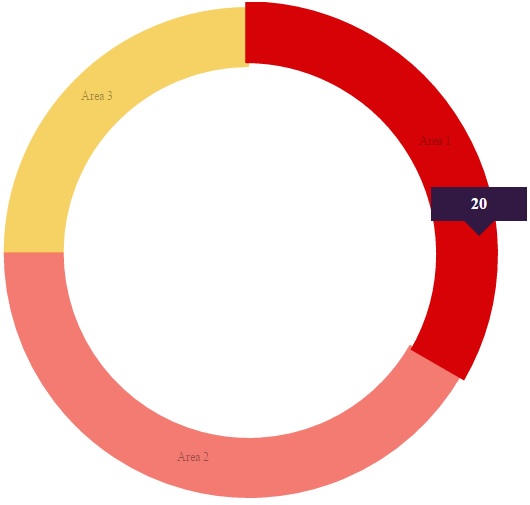
public void createPieChart() {
pieChartModel = new PieChartModel();
pieChartModel.addLabel("Area 1");
pieChartModel.addLabel("Area 2");
pieChartModel.addLabel("Area 3");
pieChartModel.set(20);
pieChartModel.set(25);
pieChartModel.set(15);
pieChartModel.setShowTooltip(true);
}
public void pieItemSelect(ItemSelectEvent event) {
FacesMessage msg = new FacesMessage(FacesMessage.SEVERITY_INFO, "Item selected", "Item Value: "
+ pieChartModel.getData().get(event.getItemIndex()));
FacesContext.getCurrentInstance().addMessage(event.getComponent().getClientId(), msg);
}
public PieChartModel getPieChartModel() {
return pieChartModel;
}
public void setPieChartModel(PieChartModel pieChartModel) {
this.pieChartModel = pieChartModel;
}
}PieChart.xhtml
<div style="width: 60%; height: 60%; margin-left: auto; margin-right: auto; margin-top: auto; margin-bottom: auto;">
   <ct:chart id="pieChart" type="pie" model="#{pieChartBean.pieChartModel}" >
      <p:ajax event="itemSelect" listener="#{pieChartBean.pieItemSelect}" update="pieChartMessage" />
   </ct:chart>
   <p:message id="pieChartMessage" for="pieChart" showDetail="true" />
 </div>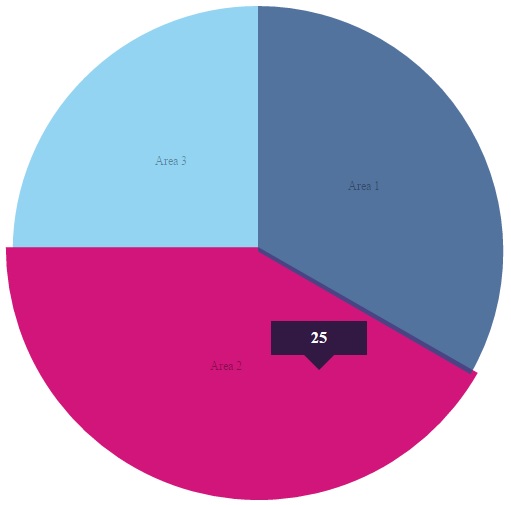
The pie chart can be transformed to a Doughnut Chart by setting pieChartModel.setDonut(true).
Conclusion
In this article, positive points about ChartistJSF library were introduced. The steps to integrate ChartistJSF charts to a JSF based application were introduced. Three types of charts have been demonstrated using simple examples.
The ChartistJSF library is an easy to use, good looking, and flexible chart solution for JSF based applications. Currently, ChartistJSF supports 3 type of charts. It would be nice if future releases of ChartistJSF supported a larger variety of charts such as Bubble, Gauge, etc. We'd love to hear more about ChartistJSF in the future.
Opinions expressed by DZone contributors are their own.
Comments