ClickHouse: Windows Functions From Scratch
Windows functions in ClickHouse simplify complex data analysis and aggregation,
Join the DZone community and get the full member experience.
Join For FreeClickHouse is a highly scalable, column-oriented, relational database management system optimized for analytical workloads. It is an open-source product developed by Yandex, a search engine company. One of the key features of ClickHouse is its support for advanced analytical functions, including windows functions.
Windows functions were first introduced in the late 1990s by SQL Server, and since then, have become a standard feature in many relational databases, including ClickHouse. Today, windows functions are an indispensable tool for data analysts and developers and are widely used in many industries.
Those functions, also known as analytic functions, are a class of functions that perform calculations based on a sliding window of rows. They are used to perform various types of analysis on data sets, such as calculating running totals, moving averages, and rankings. Windows functions are a powerful tool for data analysis and can significantly simplify writing complex queries.
ClickHouse supports a wide range of windows functions, including built-in functions for rank, percent_rank, cumulative distribution, row numbering, and running totals. In addition, it also supports user-defined windows functions, which allow users to create custom functions for specific use cases.
In this article, I will introduce the concept of windows functions and provide a comprehensive overview of the windows functions available in ClickHouse. I will also provide examples of how to use these functions in real-world scenarios. This article is intended for experienced developers who are already familiar with SQL and want to learn more about windows functions in ClickHouse.
Real-World Examples of Using Windows Functions
Windows functions are a powerful tool for data analysis and are widely used in various industries, such as finance, e-commerce, and healthcare.
Financial Analysis
One of the earliest applications of windows functions was in financial analysis. In stock market analysis, developers can use windows functions to calculate moving averages, running totals, and percent changes. For example, calculating a 50-day moving average of a stock’s closing price is a common use case for windows functions in finance. Another example is calculating the running total of a company’s earnings over a period of time.
E-commerce Analytics
In e-commerce, windows functions can analyze customer behavior and sales patterns. Developers can use windows functions to calculate the running total of sales for each product, the ranking of products based on their sales, and the percentage of sales growth over time. Additionally, windows functions can be used to analyze customer behavior by calculating the average purchase frequency and the average purchase value of a customer over a period of time.
Healthcare Analytics
Windows functions in healthcare can analyze patient data, such as vital signs, lab results, and medication use. For example, developers can use windows functions to calculate the moving average of a patient’s heart rate, the running total of a patient’s medication doses, and the ranking of patients based on their lab results.
These are just a few examples of the many real-world scenarios where developers can use windows functions. The key takeaway is that windows functions can be used to perform advanced analysis on a wide range of data sets and can greatly simplify the writing of complex queries.
Syntax of Windows Functions in ClickHouse
In ClickHouse, windows functions are used in the SELECT clause of a query to perform calculations on a set of rows. The basic syntax for using a windows function in ClickHouse is as follows:
SELECT
  [column_list],
  [windows_function_name]([argument_list])
    OVER ([PARTITION BY [partition_column_list]]
         [ORDER BY [order_column_list]]
         [ROWS [BETWEEN [start_offset] AND [end_offset]]])
  AS [alias_name]
FROM [table_name];
Let’s break down each part of the syntax:
[column_list]: This is the list of columns you want to return in the query.[windows_function_name]([argument_list]): This is the name of the windows function you want to use and the list of arguments for that function.AS [alias_name]: This clause is optional and is used to give an alias name to the output of the windows function.OVER ([PARTITION BY [partition_column_list]] [ORDER BY [order_column_list]] [ROWS [BETWEEN [start_offset] AND [end_offset]]]): This is the specification of the window frame for the windows function.
PARTITION BY [partition_column_list]: This clause is optional and divides the result set into partitions based on the values in the specified columns.ORDER BY [order_column_list]: This clause is required to specify the order in which the windows function processes the rows.ROWS [BETWEEN [start_offset] AND [end_offset]]: This clause is optional and is used to specify the range of rows for the windows function to operate on. Thestart_offsetandend_offsetcan be positive or negative integers or special values likeUNBOUNDED PRECEDINGorCURRENT ROW.
Here is an example of using a windows function in ClickHouse:
SELECT
  date,
  product_id,
  sales,
  SUM(sales) OVER (PARTITION BY product_id ORDER BY date) AS running_total
FROM sales_data;
I use the SUM windows function to calculate the running total of sales for each product, grouped by the product_id column. The window frame is specified with PARTITION BY product_id to divide the result set into partitions based on the product_id and ORDER BY date to specify the order in which the windows function processes the rows. The output of the windows function is given an alias name running_total.
It’s important to note that windows functions in ClickHouse can only be used in the SELECT clause of a query and cannot be used in the WHERE or HAVING clause. Additionally, windows functions can be combined with other functions, such as aggregate functions, to perform even more advanced data analysis.
Financial Analysis with Windows Functions
In the financial industry, tracking the performance of investments over time is critical for decision-making. Windows functions in ClickHouse can perform sophisticated analysis of financial data, such as calculating moving averages and running totals.
Let’s consider a scenario where we have a table of daily stock prices for a single stock. We aim to calculate the 50-day moving average of the closing price and the running total of the daily return on investment.
Data Generation:
CREATE TABLE stock_prices (
  date Date,
  symbol String,
  open Float32,
  close Float32,
  high Float32,
  low Float32,
  volume UInt64
) ENGINE = MergeTree(date, (symbol, date), 8192);

INSERT INTO stock_prices
SELECT
  toDate('yyyy-MM-dd', d),
  'AAAA',
  rand(),
  rand(),
  rand(),
  rand(),
  rand() * 100000
FROM generateDates('2022-01-01', '2023-02-10') d;
I create a table stock_prices to store daily stock prices for the symbol AAAA. I then insert randomly generated data into the table for the years 2022–2023.
SQL Request:
SELECT
  date,
  symbol,
  close,
  AVG(close) OVER (ORDER BY date ROWS BETWEEN 49 PRECEDING AND CURRENT ROW) AS moving_average,
  SUM((close - lag(close) OVER (ORDER BY date)) / lag(close) OVER (ORDER BY date)) * 100 AS running_return
FROM stock_prices
WHERE symbol = 'AAAA';
I use windows functions to perform financial analysis on the stock price data.
AVG(close) OVER (ORDER BY date ROWS BETWEEN 49 PRECEDING AND CURRENT ROW): This windows function calculates the 50-day moving average of the closing price by taking the average of the 50 rows preceding the current row and the current row itself (or less if the number of days is less than 50), ordered by the date. The window frame is specified withORDER BY dateto specify the order in which the windows function processes the rows andROWS BETWEEN 49 PRECEDING AND CURRENT ROWto specify the range of rows for the windows function to operate on.SUM((close - lag(close) OVER (ORDER BY date)) / lag(close) OVER (ORDER BY date)) * 100: This windows function calculates the running total of the daily return on investment by summing up the daily returns, which are calculated as the difference between the current close price and the previous close price divided by the previous close price. Thelagfunction is used to retrieve the value of a previous row in the same partition, and the window frame is specified withORDER BY dateto ensure that the returns are calculated in the correct order.
The output of the query returns the date, symbol, closing price, 50-day moving average, and running total of the daily return on investment for the symbol AAAA.
With windows functions in ClickHouse, financial analysts can perform sophisticated analyses of financial data in real-time and make informed decisions based on the results.
E-commerce Analytics With Windows Functions
Analyzing sales data in the e-commerce industry is crucial for understanding customer behavior and making sound business decisions. ClickHouse's Windows functions may do complex e-commerce data analysis, such as computing running totals and ranking products by sales.
Let’s imagine we have a table of daily sales information for just one e-commerce site. To rank the products based on total sales, we will compute the running total of sales.
Data Generation:
CREATE TABLE sales_data (
  date Date,
  product_name String,
  product_category String,
  sales UInt64
) ENGINE = MergeTree(date, (product_name, date), 8192);

INSERT INTO sales_data
SELECT
  toDate('yyyy-MM-dd', d),
  'Product ' || toString(intDiv(rand() * 100, 1)),
  'Category ' || toString(intDiv(rand() * 5, 1)),
  rand() * 1000
FROM generateDates('2022-01-01', '2023-02-10') d;
I create a table sales_data to store daily sales data for a single e-commerce store. I then insert randomly generated data into the table for the years 2022–2023.
SQL Request:
SELECT
  product_name,
  product_category,
  SUM(sales) OVER (PARTITION BY product_name ORDER BY date) AS running_total,
  ROW_NUMBER() OVER (PARTITION BY product_category ORDER BY SUM(sales) OVER (PARTITION BY product_name ORDER BY date) DESC) AS rank
FROM sales_data;
I use windows functions to perform e-commerce analytics on sales data.
SUM(sales) OVER (PARTITION BY product_name ORDER BY date): This windows function calculates the running total of sales for each product by summing up the sales for each row, partitioned by the product name, and ordered by the date. The window frame is specified withPARTITION BY product_nameto divide the data into partitions based on the product name, andORDER BY dateto specify the order in which the windows function processes the rows.ROW_NUMBER() OVER (PARTITION BY product_category ORDER BY SUM(sales) OVER (PARTITION BY product_name ORDER BY date) DESC): This windows function calculates each product's rank within its category based on its total sales. TheROW_NUMBERfunction generates a unique number for each row within a partition, and the window frame is specified withPARTITION BY product_categoryto divide the data into partitions based on the product category, andORDER BY SUM(sales) OVER (PARTITION BY product_name ORDER BY date) DESCto sort the data within each partition in descending order based on the running total of sales.
The query output returns the product name, product category, running total of sales, and rank of each product based on its total sales within its product category.
With windows functions in ClickHouse, e-commerce analysts can perform sophisticated sales data analysis in real-time and make informed decisions based on the results.
Healthcare Analytics With Windows Functions
For the healthcare sector to improve patient outcomes and make wise decisions on patient care, analysis of patient data is essential. ClickHouse's windows features offer advanced healthcare data analysis capabilities, including the ability to rate patients according to various criteria and compute running totals.
Consider the following scenario: we have a patient data table for a hospital that includes patient demographics, medical history, and current treatment. We intend to determine each patient’s running total of hospitalization days and rank them based on their overall hospitalization days.
Data Generation:
CREATE TABLE patient_data (
  admission_date Date,
  discharge_date Date,
  patient_id String,
  age UInt16,
  gender String,
  condition String
) ENGINE = MergeTree(admission_date, (patient_id, admission_date), 8192);

INSERT INTO patient_data
SELECT
  toDate('yyyy-MM-dd', d1),
  toDate('yyyy-MM-dd', d2),
  'Patient ' || toString(intDiv(rand() * 10000, 1)),
  rand() % 90 + 10,
  if(rand() % 2 = 0, 'Male', 'Female'),
  'Condition ' || toString(intDiv(rand() * 100, 1))
FROM generateDates('2022-01-01', '2023-02-10') d1
JOIN generateDates('2022-01-01', '2023-02-10') d2 ON d1 <= d2;
I create a table patient_data to store patient data for a hospital. I then inserted randomly generated data into the table for the years 2022–2023. Each row represents a patient's hospitalization, including the admission date, discharge date, patient ID, age, gender, and medical condition.
SQL Request #1:
SELECT
  patient_id,
  age,
  gender,
  condition,
  SUM(datediff(discharge_date, admission_date)) OVER (PARTITION BY patient_id ORDER BY admission_date) AS running_total_days
FROM patient_data;
For each patient, I calculated the running total of days spent in the hospital using a windows function.
SUM(datediff(discharge_date, admission_date)) OVER (PARTITION BY patient_id ORDER BY admission_date): This windows function calculates the running total of hospitalization days for each patient by summing up the number of days between the admission date and discharge date for each row, partitioned by the patient ID, and ordered by the admission date. The window frame is specified with PARTITION BY patient_id to divide the data into partitions based on the patient ID and ORDER BY admission_date to specify the order in which the windows function processes the rows.
The query results give each patient’s patient ID, age, gender, condition, and running total of days spent in the hospital.
In the second, more complex SQL request, I will use windows functions to rank the patients by their total hospitalization days.
SQL Request #2:
SELECT
  patient_id,
  age,
  gender,
  condition,
  running_total_days,
  ROW_NUMBER() OVER (ORDER BY running_total_days DESC) AS rank
FROM (
  SELECT
    patient_id,
    age,
    gender,
    condition,
    SUM(datediff(discharge_date, admission_date)) OVER (PARTITION BY patient_id ORDER BY admission_date) AS running_total_days
  FROM patient_data
)
ROW_NUMBER() OVER (ORDER BY running_total_days DESC) AS rank: This windows function assigns a unique rank to each patient based on their running total of hospitalization days. The function assigns a rank to each row based on the order specified withORDER BY running_total_days DESC, which means that the patients with the highest running total of hospitalization days will be assigned the lowest rank. TheROW_NUMBER()function is a built-in function in ClickHouse that assigns a unique number to each row within the specified window frame.(SELECT ...): The inner query calculates the running total of hospitalization days for each patient using theSUMwindows function. The result of the inner query is then used as the input for the outer query, where theROW_NUMBERwindows function is applied to rank the patients by their total hospitalization days.
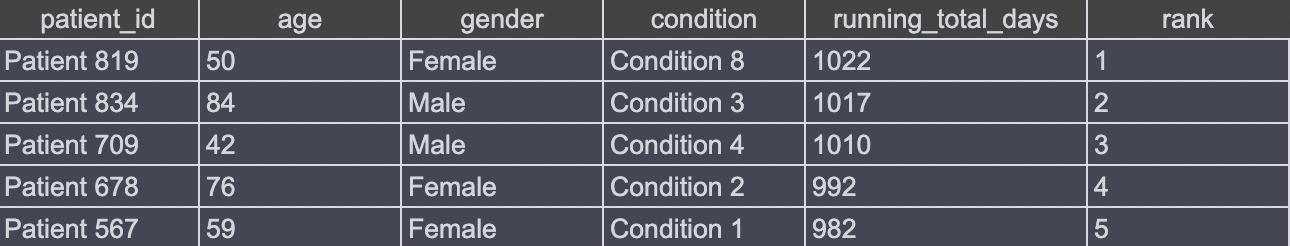
The query results give each patient’s rank, age, gender, condition, and running total of days spent in the hospital.
Here is a sample of the data that this query could generate:
To visualize the query results, you can use various data visualization tools such as Matplotlib, Seaborn, Plotly, etc. in Python. Here’s an example of how you can visualize the results of the query using Matplotlib:
import matplotlib.pyplot as plt
import pandas as pd
from sqlalchemy import create_engine

# Establish a connection to the ClickHouse database
engine = create_engine("clickhouse://<host>:<port>/<database>")

# Execute the SQL query and store the results in a Pandas DataFrame
df = pd.read_sql_query("<SQL query>", engine)

# Plot the results using a bar plot
plt.bar(df['patient_id'], df['running_total_days'], color=df['rank'])
plt.xlabel("Patient ID")
plt.ylabel("Running Total of Hospitalization Days")
plt.title("Healthcare Analytics with Windows Functions in ClickHouse")
plt.show()
In this code, I first use the create_engine function from the SQLAlchemy library to establish a connection to the ClickHouse database. The read_sql_query function is then used to execute the SQL query and store the results in a Pandas DataFrame. Finally, the bar plot is created using the bar function from the Matplotlib library, where the x-axis represents the patient ID, the y-axis represents the running total of hospitalization days, and the color of each bar represents the patient's rank.
I successfully used ClickHouse's windows functions in those examples to evaluate healthcare data and rank patients based on their total hospitalization days. This analysis can uncover patterns and trends in patient data, which can help to inform clinical decision-making and improve patient outcomes.
Conclusion
Finally, with ClickHouse, windows functions are a great tool for extensive data analysis and aggregation procedures. They let developers conduct complex computations within a query, such as running totals, ranking, and percentiles, which would normally necessitate numerous inquiries or even data pre-processing. Windows functions may considerably ease data analysis and aggregation by providing a concise and quick mechanism to do these calculations.
However, keep in mind that windows functions can be computationally expensive, especially with huge datasets. This can be minimized by utilizing proper indexes and constructing queries wisely. However, it is still critical to understand windows functions' performance consequences and use them sparingly.
Published at DZone with permission of Taras Baranyuk. See the original article here.
Opinions expressed by DZone contributors are their own.
Comments