CockroachDB Admission Control
See one way to solve a CPU imbalance using Admission Control.
Join the DZone community and get the full member experience.
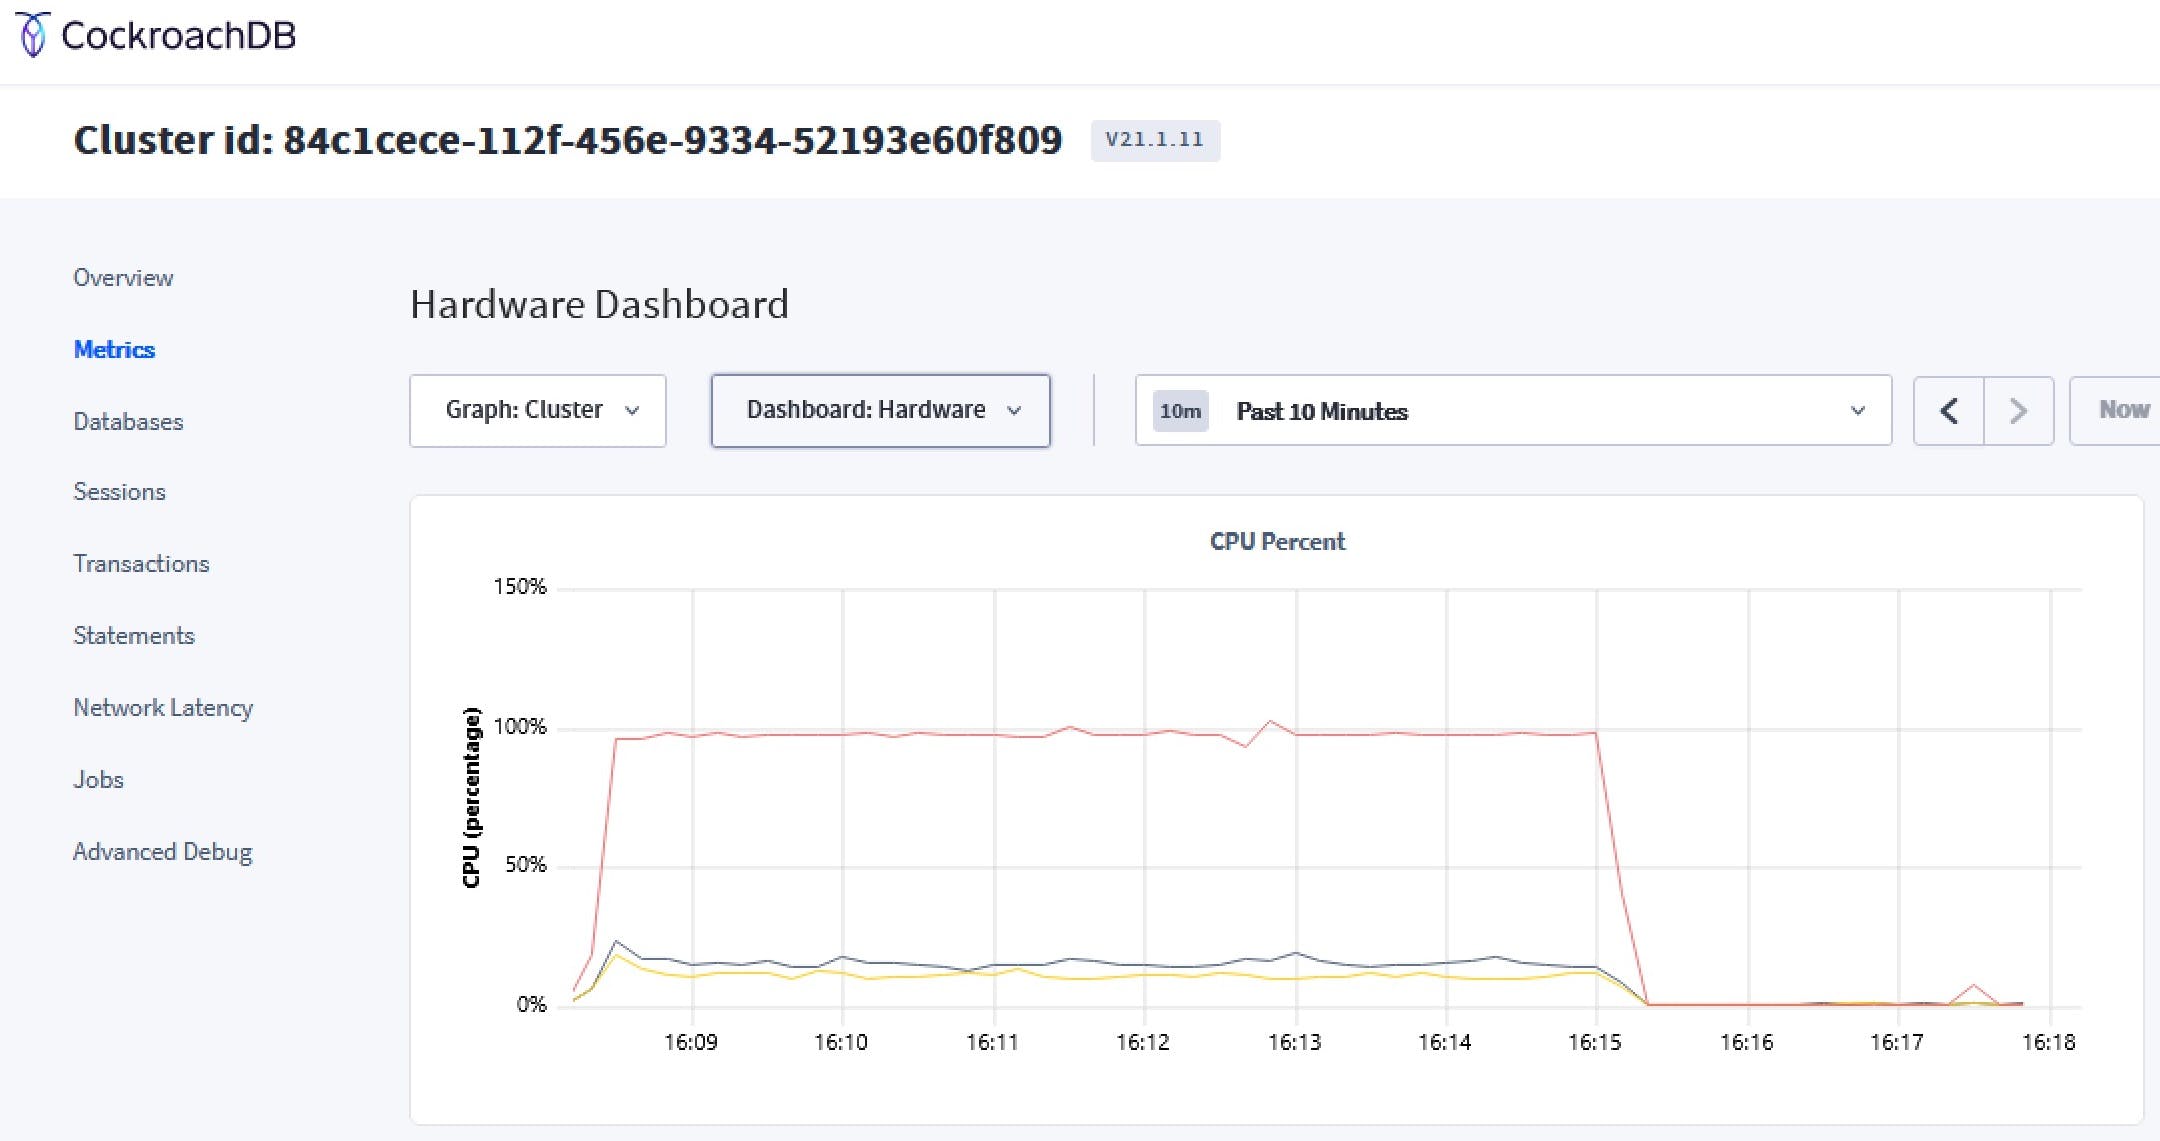
Join For FreeLast week, while running a workload consisting of 200 different queries, we noticed right away that a CPU imbalance was causing a performance issue. Looking at the first graph, below, you can see right away that one of the three CockroachDB nodes was operating at near 100% CPU. Not ideal.
At the time we installed that cluster, we utilized version 21.1.11 of CockroachDB, which was the most current. Now fast forward in time to November 16 — version 21.2.0 has just been released, with a new feature called Admission Control. From the docs for this new feature, one scenario where Admission Control can help is when
The node has high CPU usage, visible in the CPU percent graph...
Bingo! We decided to give it a go and see if Admission Control could solve our problem.
We performed a zero-downtime, rolling upgrade to v. 21.2.0 and then enabled Admission Control via three SQL commands, as shown here:
set cluster setting admission.kv.enabled = true;
set cluster setting admission.sql_kv_response.enabled = true;
set cluster setting admission.sql_sql_response.enabled = true;
The CPU percent graph in DB Console showed an immediate improvement. We let the workload run for several hours and took a screenshot of the current CPU utilization across the cluster.
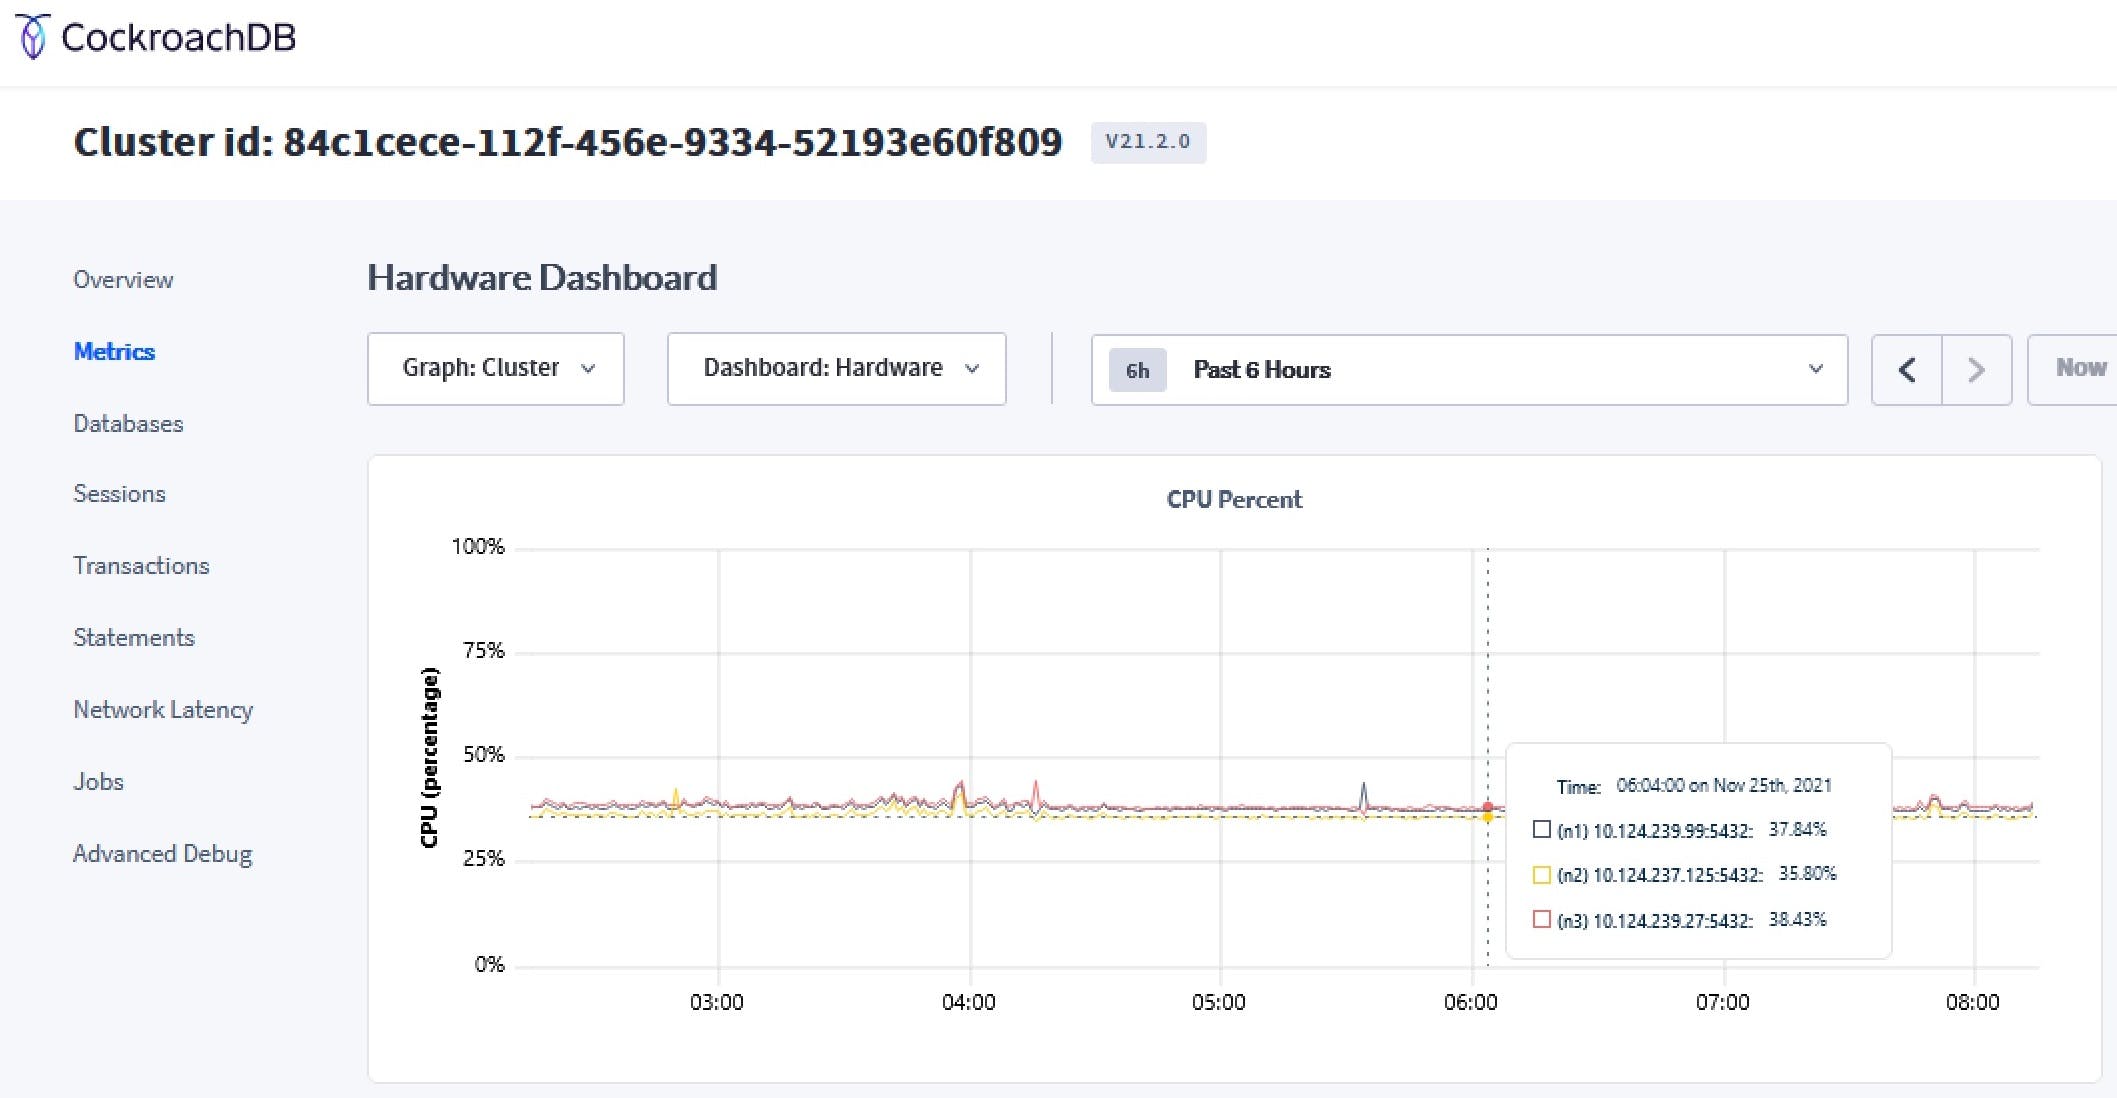
CPU utilization on the three nodes now tracks to within about 3%, which is about as close as one could hope for.
The new release is available here.
Published at DZone with permission of Michael Goddard. See the original article here.
Opinions expressed by DZone contributors are their own.
Comments