Connection Pool High Availability With CockroachDB and PgCat
This article covers pooler high availability working with PgCat to provide a highly available configuration where clients can see multiple connections.
Join the DZone community and get the full member experience.
Join For FreeToday, I'd like to cover pooler high availability as this is one aspect of connection pooling I've never focused on. Due in large part because my previous attempts were based on PgBouncer, and it standing up PgBouncer is not easy. Luckily, it's been an absolute pleasure working with PgCat as it has a lightweight installation process.
High-Level Steps
- Start CockroachDB, PgCat, and HAProxy in Docker
- Run a workload
- Demonstrate fault tolerance
- Conclusion
Step-By-Step Instructions
Start CockroachDB, PgCat, and HAProxy in Docker
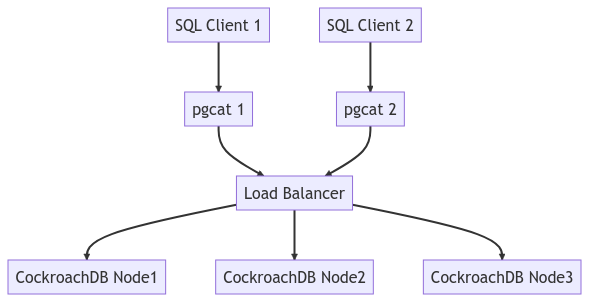
I have a Docker Compose environment with all of the necessary services here. Primarily, we have to set up two instances of PgCat.
pgcat1:
    container_name: pgcat1
    hostname: pgcat1
    build: ./pgcat
    command:
      - "pgcat"
      - "/etc/pgcat/pgcat.toml"
    depends_on:
      - lb
    restart: always

  pgcat2:
    container_name: pgcat2
    hostname: pgcat2
    build: ./pgcat
    command:
      - "pgcat"
      - "/etc/pgcat/pgcat.toml"
    depends_on:
      - lb
    restart: always
Both of my PgCat configuration files define the three shards for the TPCC database in the following way:
# Shard 0
[pools.tpcc.shards.0]
# [ host, port, role ]
servers = [
    [ "lb", 26000, "primary" ],
]

database = "tpcc"

[pools.tpcc.shards.1]
servers = [
    [ "lb", 26000, "primary" ],
]

database = "tpcc"

[pools.tpcc.shards.2]
servers = [
    [ "lb", 26000, "primary" ],
]

database = "tpcc"
Basically, there is no replica. Every shard points to a single instance of Load Balancer. I will write about HAProxy HA in a follow-up article.
The diagram below depicts the entire cluster architecture.
Run a Workload
At this point, we can connect to one of the clients and initialize the workload. I am using tpcc as it's a good workload to demonstrate write and read traffic.
cockroach workload fixtures import tpcc --warehouses=10 'postgresql://root@pgcat1:6432/tpcc?sslmode=disable'
I230421 18:55:57.849236 1 ccl/workloadccl/fixture.go:318  [-] 1  starting import of 9 tables
I230421 18:55:59.400269 23 ccl/workloadccl/fixture.go:481  [-] 2  imported 527 B in warehouse table (10 rows, 0 index entries, took 1.466243667s, 0.00 MiB/s)
I230421 18:55:59.863125 24 ccl/workloadccl/fixture.go:481  [-] 3  imported 9.9 KiB in district table (100 rows, 0 index entries, took 1.928840501s, 0.01 MiB/s)
I230421 18:56:01.952914 28 ccl/workloadccl/fixture.go:481  [-] 4  imported 1.2 MiB in new_order table (90000 rows, 0 index entries, took 4.018614502s, 0.30 MiB/s)
I230421 18:56:02.316935 29 ccl/workloadccl/fixture.go:481  [-] 5  imported 7.9 MiB in item table (100000 rows, 0 index entries, took 4.382741377s, 1.80 MiB/s)
I230421 18:56:03.383413 26 ccl/workloadccl/fixture.go:481  [-] 6  imported 22 MiB in history table (300000 rows, 0 index entries, took 5.449141753s, 3.95 MiB/s)
I230421 18:56:03.879595 27 ccl/workloadccl/fixture.go:481  [-] 7  imported 16 MiB in order table (300000 rows, 300000 index entries, took 5.945451003s, 2.62 MiB/s)
I230421 18:56:04.311869 31 ccl/workloadccl/fixture.go:481  [-] 8  imported 168 MiB in order_line table (3001641 rows, 0 index entries, took 6.377997253s, 26.31 MiB/s)
I230421 18:56:04.448297 25 ccl/workloadccl/fixture.go:481  [-] 9  imported 176 MiB in customer table (300000 rows, 300000 index entries, took 6.514132128s, 26.96 MiB/s)
I230421 18:56:04.709439 30 ccl/workloadccl/fixture.go:481  [-] 10  imported 307 MiB in stock table (1000000 rows, 0 index entries, took 6.775180503s, 45.29 MiB/s)
I230421 18:56:04.736248 1 ccl/workloadccl/fixture.go:326  [-] 11  imported 696 MiB bytes in 9 tables (took 6.886715045s, 101.13 MiB/s)
I230421 18:56:05.422126 1 ccl/workloadccl/cliccl/fixtures.go:343  [-] 12  fixture is restored; now running consistency checks (ctrl-c to abort)
I230421 18:56:05.433064 1 workload/tpcc/tpcc.go:520  [-] 13  check 3.3.2.1 took 10.84325ms
I230421 18:56:05.544964 1 workload/tpcc/tpcc.go:520  [-] 14  check 3.3.2.2 took 111.802667ms
I230421 18:56:05.567032 1 workload/tpcc/tpcc.go:520  [-] 15  check 3.3.2.3 took 22.033417ms
I230421 18:56:06.552726 1 workload/tpcc/tpcc.go:520  [-] 16  check 3.3.2.4 took 985.579792ms
I230421 18:56:06.760633 1 workload/tpcc/tpcc.go:520  [-] 17  check 3.3.2.5 took 207.855084ms
I230421 18:56:07.718031 1 workload/tpcc/tpcc.go:520  [-] 18  check 3.3.2.7 took 957.355125ms
I230421 18:56:07.888304 1 workload/tpcc/tpcc.go:520  [-] 19  check 3.3.2.8 took 170.228417ms
I230421 18:56:08.050079 1 workload/tpcc/tpcc.go:520  [-] 20  check 3.3.2.9 took 161.734084ms
Then we can start the workload from both client containers.
PgCat 1
cockroach workload run tpcc --duration=120m --concurrency=3 --max-rate=1000 --tolerate-errors --warehouses=10 --conns 30 --ramp=1m --workers=100 'postgresql://root@pgcat1:6432/tpcc?sslmode=disable'
PgCat 2
cockroach workload run tpcc --duration=120m --concurrency=3 --max-rate=1000 --tolerate-errors --warehouses=10 --conns 30 --ramp=1m --workers=100 'postgresql://root@pgcat2:6432/tpcc?sslmode=disable'
You will see output similar to this:
  488.0s        0            1.0            2.1     44.0     44.0     44.0     44.0 newOrder
  488.0s        0            0.0            0.2      0.0      0.0      0.0      0.0 orderStatus
  488.0s        0            2.0            2.1     11.0     16.8     16.8     16.8 payment
  488.0s        0            0.0            0.2      0.0      0.0      0.0      0.0 stockLevel
  489.0s        0            0.0            0.2      0.0      0.0      0.0      0.0 delivery
  489.0s        0            2.0            2.1     15.2     17.8     17.8     17.8 newOrder
  489.0s        0            1.0            0.2      5.8      5.8      5.8      5.8 orderStatus
The logs for each instance of PgCat will show something like this:
d: 0, database: "tpcc", role: Primary, replica_number: 0, address_index: 0, username: "root", pool_name: "tpcc", mirrors: [], stats: AddressStats { total_xact_count: 36637, total_query_count: 437787, total_received: 78458117, total_sent: 67132339, total_xact_time: 0, total_query_time: 596313, total_wait_time: 140298, total_errors: 0, avg_query_count: 27349, avg_query_time: 37249, avg_recv: 4901185, avg_sent: 4193997, avg_errors: 0, avg_xact_time: 0, avg_xact_count: 2288, avg_wait_time: 8768 } }
Demonstrate Fault Tolerance
We can now start terminating the PgCat instances to demonstrate failure tolerance. Let's kill PgCat 1.
docker kill pgcat1
pgcat1
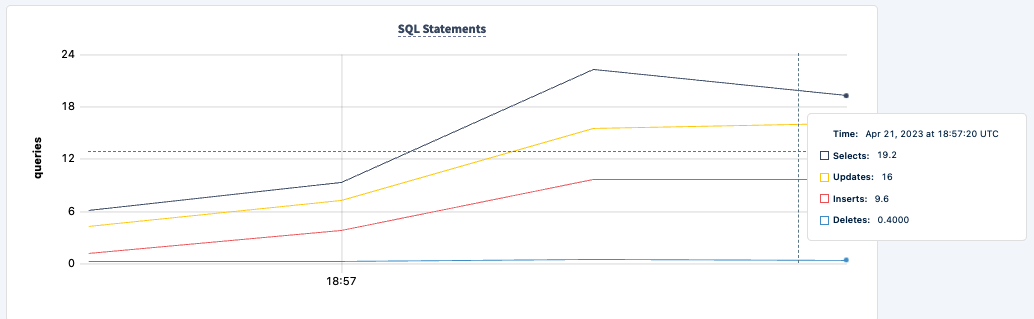
The workload will start producing error messages:
 1738.0s    11379            0.0            0.8      0.0      0.0      0.0      0.0 payment
 1738.0s    11379            0.0            0.1      0.0      0.0      0.0      0.0 stockLevel
I230421 18:51:49.452011 324 workload/pgx_helpers.go:79  [-] 12403  pgx logger [error]: connect failed logParams=map[err:lookup pgcat1 on 127.0.0.11:53: no such host]
I230421 18:51:49.464529 358 workload/pgx_helpers.go:79  [-] 12404  pgx logger [error]: connect failed logParams=map[err:lookup pgcat1 on 127.0.0.11:53: no such host]
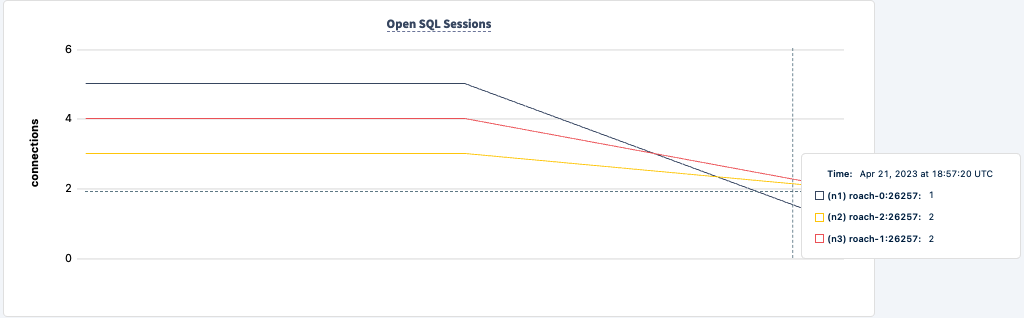
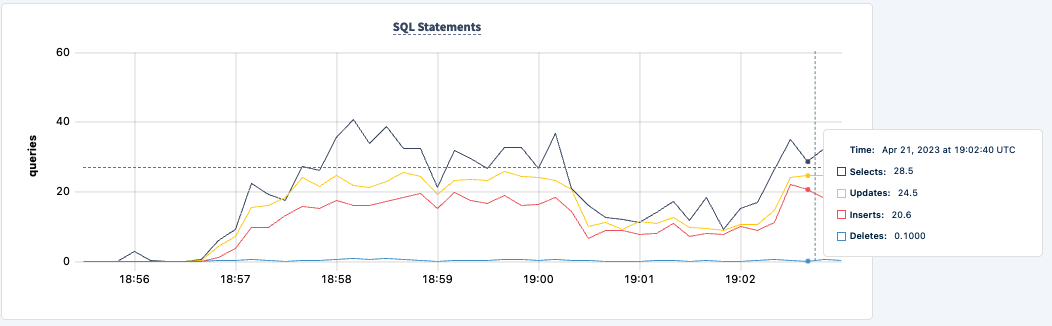
Our workload is still running using the PgCat2 connection:
Let's bring it back up:
docker start pgcat1
Notice the client reconnects and continues with the workload:
  292.0s     1163            0.0            1.3      0.0      0.0      0.0      0.0 payment
  292.0s     1163            0.0            0.1      0.0      0.0      0.0      0.0 stockLevel
_elapsed___errors__ops/sec(inst)___ops/sec(cum)__p50(ms)__p95(ms)__p99(ms)_pMax(ms)
  293.0s     1163            1.0            0.1     33.6     33.6     33.6     33.6 delivery
  293.0s     1163            4.0            1.3     14.7     27.3     27.3     27.3 newOrder
  293.0s     1163            0.0            0.1      0.0      0.0      0.0      0.0 orderStatus
  293.0s     1163            2.0            1.3     11.5     15.2     15.2     15.2 payment
  293.0s     1163            1.0            0.1      7.6      7.6      7.6      7.6 stockLevel
  294.0s     1163            0.0            0.1      0.0      0.0      0.0      0.0 delivery
  294.0s     1163            7.0            1.3     19.9     35.7     35.7     35.7 newOrder
  294.0s     1163            0.0            0.1      0.0      0.0      0.0      0.0 orderStatus
  294.0s     1163            0.0            1.3      0.0      0.0      0.0      0.0 payment
  294.0s     1163            1.0            0.1     11.0     11.0     11.0     11.0 stockLevel
The number of executed statements goes up upon the second client successfully connecting.
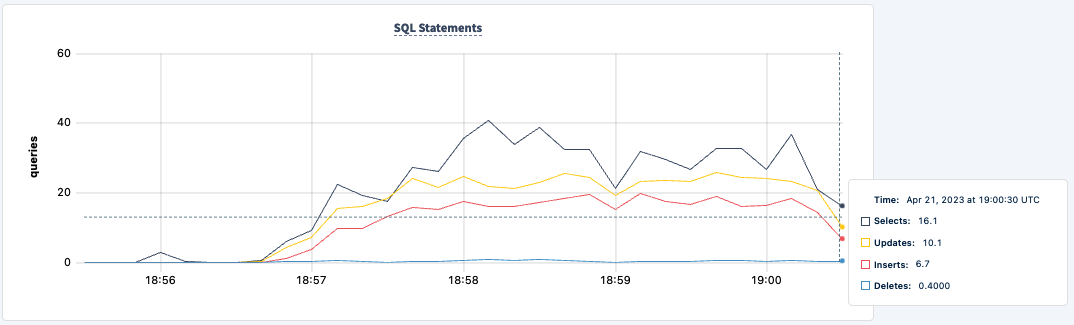
We can now do the same with the second PgCat instance. Similarly, the workload reports errors that it can't find the pgcat2 host.
0421 19:06:37.200303 370 workload/pgx_helpers.go:79  [-] 489  pgx logger [error]: connect failed logParams=map[err:lookup pgcat2 on 127.0.0.11:53: no such host]
E230421 19:06:37.200405 1 workload/cli/run.go:548  [-] 490  error in newOrder: lookup pgcat2 on 127.0.0.11:53: no such host
I230421 19:06:37.203492 369 workload/pgx_helpers.go:79  [-] 491  pgx logger [error]: connect failed logParams=map[err:lookup pgcat2 on 127.0.0.11:53: no such host]
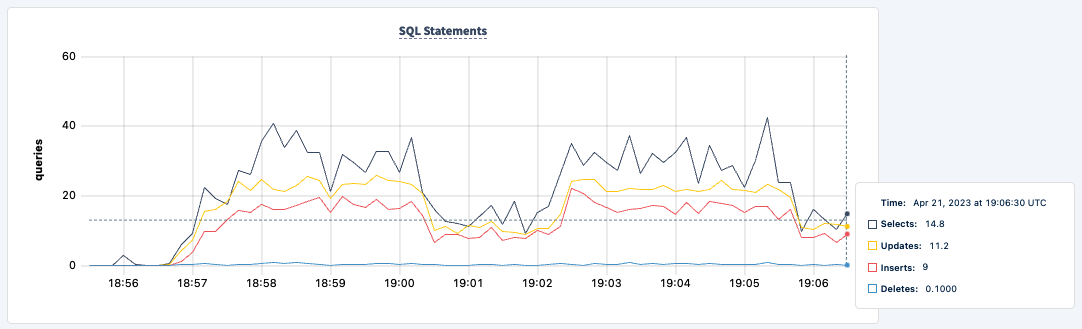
And we can observe the dip in the statement count:
We can bring it back up:
docker start pgcat2
One thing we can improve on is providing both pgurls for pgcat1 and pgcat2 to the workload. It will allow each client to fail back to the other instance of pgurl even when one of the instances is down. What we have to do is stop both clients and restart with both connection strings.
cockroach workload run tpcc --duration=120m --concurrency=3 --max-rate=1000 --tolerate-errors --warehouses=10 --conns 30 --ramp=1m --workers=100 'postgresql://root@pgcat1:6432/tpcc?sslmode=disable' 'postgresql://root@pgcat2:6432/tpcc?sslmode=disable'
I am going to do that one client at a time so that the workload does not exit entirely.

Not at any point in this experiment have we lost the ability to read/write to and from the cluster. Let's shut down one of the PgCat instances again and see the impact:
docker kill pgcat2
pgcat2
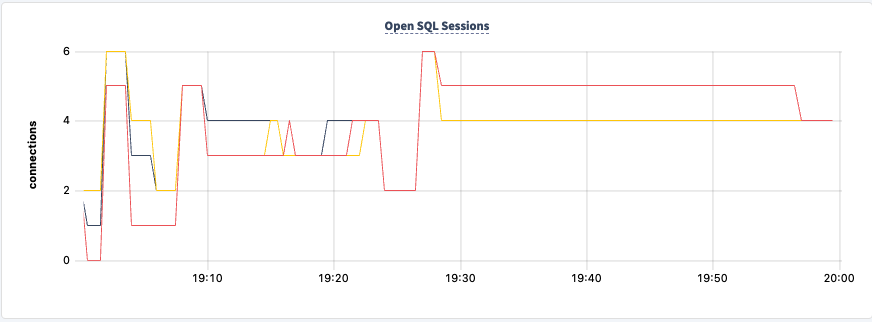
I'm now seeing errors across both clients, but both clients are still executing:
  503.0s      181            1.0            2.0     25.2     25.2     25.2     25.2 newOrder
  503.0s      181            0.0            0.2      0.0      0.0      0.0      0.0 orderStatus
  503.0s      181            3.0            2.0     14.7     21.0     21.0     21.0 payment
  503.0s      181            0.0            0.2      0.0      0.0      0.0      0.0 stockLevel
I230421 19:24:51.255235 402 workload/pgx_helpers.go:79  [-] 232  pgx logger [error]: connect failed logParams=map[err:lookup pgcat2 on 127.0.0.11:53: no such host]
I230421 19:24:51.545337 170 workload/pgx_helpers.go:79  [-] 233  pgx logger [error]: connect failed logParams=map[err:lookup pgcat2 on 127.0.0.11:53: no such host]
I230421 19:24:52.017264 410 workload/pgx_helpers.go:79  [-] 234  pgx logger [error]: connect failed logParams=map[err:lookup pgcat2 on 127.0.0.11:53: no such host]
E230421 19:24:52.017822 1 workload/cli/run.go:548  [-] 235  error in payment: lookup pgcat2 on 127.0.0.11:53: no such host
I230421 19:24:52.031925 412 workload/pgx_helpers.go:79  [-] 236  pgx logger [error]: connect failed logParams=map[err:lookup pgcat2 on 127.0.0.11:53: no such host]
  504.0s      185            1.0            0.2     31.5     31.5     31.5     31.5 delivery
  504.0s      185            2.0            2.0     15.2     41.9     41.9     41.9 newOrder
  504.0s      185            0.0            0.2      0.0      0.0      0.0      0.0 orderStatus
  504.0s      185            1.0            2.0     15.2     15.2     15.2     15.2 payment
  504.0s      185            0.0            0.2      0.0      0.0      0.0      0.0 stockLevel
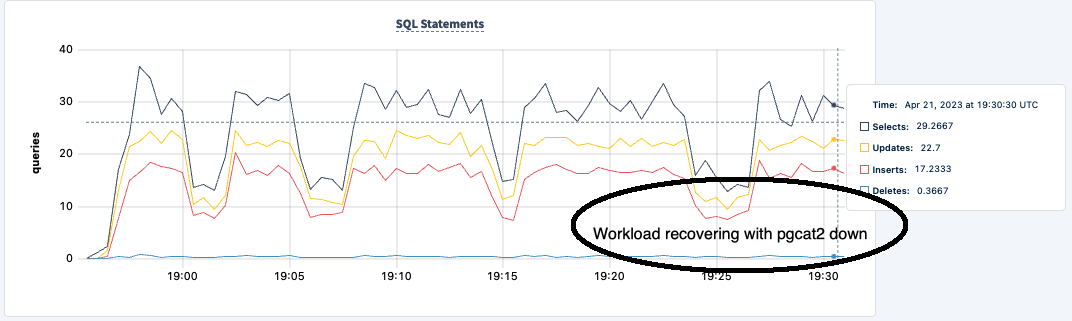
We can bring it back up and notice the workload recovering:
Conclusion
Throughout the experiment, we've not lost the ability to read and write to the database. There were dips in traffic, but that can also be remediated. The lesson here is to provide a highly available configuration where clients can see multiple connections. We can provide an HAProxy in front of the PgCat instances, and then fault tolerance can be handled by the load balancer.

It adds another hop to the entire client request journey and complicates the setup, but it may be worth it to a customer with a low tolerance for failure.
For more information, see this Intro to PgCat and CockroachDB.
Opinions expressed by DZone contributors are their own.
Comments