

Comparing TigerGraph and Dgraph Using the LDBC SNB Benchmark
See a performance comparison between TigerGraph and Dgraph
Join the DZone community and get the full member experience.
Join For Free1. Executive Summary
We compared the performance of TigerGraph and Dgraph using the Linked Data Benchmark Council (LDBC) Social Network Graph (SNB). The LDBC SNB is regarded by many as the reference standard for evaluating graph technology performance with intensive analytical and transactional workloads. Key findings included:
When loading data, TigerGraph was two to four times faster than Dgraph Bulk and nine to 30 times faster than Dgraph Live.
When running complex, read-only queries TigerGraph was two to 3,000 times faster than that of Dgraph.
When running most short, read-only queries TigerGraph was about two to 2,000 times faster than Dgraph.
When running short, read-only queries, the response time of TigerGraph did not fluctuate with the increase of data set size, while that of Dgraph did.
When running most business intelligence workloads, TigerGraph was about two to 1,600 times faster than Dgraph.
With the increase of dataset size and the complexity of the query, TigerGraph’s query response time increased by two to five times, while Dgraph’s query response time increased by more than 14 times.
Our study showed, therefore, that TigerGraph outperformed Dgraph in terms of data loading time and query running times.
2. Test Setup
The key parameters from this test were:
TigerGraph version: 2.6.3
Dgraph version: v20.07.0.
Machine: r4.8xLarge
Processor Arch: 64-bit
vCPUs: 32
Memory(GiB): 244GiB
Network Performance: 10 Gigabit
OS: Ubuntu 14.04.5
Java: build 1.8.0_144-b01
Python: 3.5
We used an AWS cloud computing server.
3. Test Description
The Linked Data Benchmark Council (LDBC) is a benchmark for graph and RDF data management. LDBC follows the open-source idea of GPLv3. The specification of the benchmark, software to be used for evaluation benchmark, tools and source code, communication of problems, and other technical documents are published in https://github.com/ldbc.
Social network benchmark (SNB) is one of the software benchmarks developed by the LDBC. It features three types of workloads.
Interactive Short (IS) Workload - these are relatively simple path traversals that access vertices at most two-hop from the origin.
Interactive Complex (IC) Workload - these queries go beyond two-hop paths and compute simple aggregates rather than returning only tuples.
Business Intelligence (BI) Workload - these queries access a much more extensive part of the graph, and traversals do not originate from a single source but multiple points in the graph.
The purpose of the LDBC SNB is to evaluate graph databases or graph data management technology through two typical scenarios:
The interactive scenario, transaction query workload, is similar to OLTP.
The business intelligence, analytical query workload, is similar to OLAP.
In our tests, queries over 2,000 seconds will be run once, queries over 500 seconds will be run 10 times and the average results are reported, queries less than 500 seconds will be run 50 times to get average results.
3.1 Data Schema
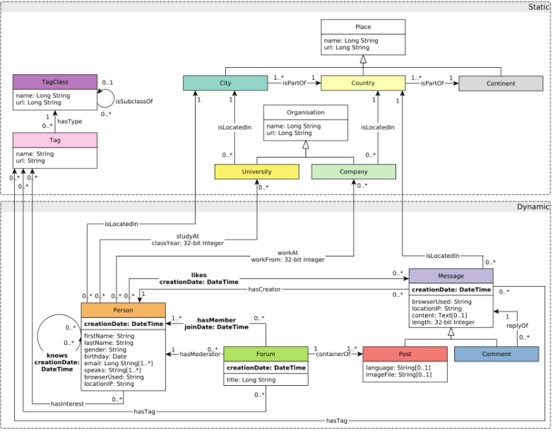
Figure 3.1: The LDBC SNB data schema
A schema defines the structure of the data used in the benchmark in terms of entities and their relations. Figure 3.1 shows the data schema used in our study. The data includes entities such as persons, organizations, and places. The schema also models the way persons interact, using the friendship relations established with other persons, and the sharing of content such as messages (both textual and images), reply to the messages, and likes to messages. People form groups to talk about specific topics, which are represented as tags.
3.2 Data Sizes
We used three datasets in our study, SF-1, SF-10, and SF-100. The sizes of each data set are shown in Table 3.1.
Data Set |
Vertex |
Edge |
Total |
SF-1 |
319.48M |
594.34M |
814M |
SF-10 |
3G |
5.24G |
8.3G |
SF-100 |
28.85G |
56.38G |
86G |
Table 3.1 Dataset sizes
3.3 Workloads
The LDBC SNB defines three types of query workload and we used all of them in our study:
Interactive Short (IS) - we ran seven short, read-only queries.
Interactive Complex (IC) - we ran 14 complexes, read-only queries.
Business intelligence (BI) - we ran 25 complex queries.
4. Load Data
4.1 Loading Functionality
It is worth comparing functionality before considering performance. This is necessary as a way to understand how to optimize the loading of each graph database.
TigerGraph provides a declarative loading language to enable users to specify a loading job, and it automatically creates a RESTful endpoint. Users can then run the job through the GSQL shell or by submitting an HTTP request to the restful server. All loading jobs occur online while other data access services are running. This test adopts the direct call of the RESTful interface.
In Dgraph, Live Loader and Bulk Loader can both be used for fast data loading. Bulk Loader is considerably faster than the Live Loader, but Bulk Loader can only be used to load data into a new cluster. Bulk Loader is, therefore, the recommended way to perform the initial import of large datasets into Dgraph. This means that if there is already data in the Dgraph, a user can only employ Live Loader to load the data. Both methods are tested in this benchmark.
4.2 Loading Times
Table 4.1: Loading times for SF-1, SF-0, SF-1010 using TigerGraph and Dgraph
SF-1 |
SF-10 |
SF-100 |
|
TigerGraph |
52s |
4m 16s |
1h 7m 40s |
Dgraph Bulk |
2m 3s |
17m 8s |
03h 19m 23s |
Dgraph Live |
9m 35s |
2h 6m 36s |
Did not complete within 24 hours |
Figure 4.1 is normalized based on TigerGraph loading performance.
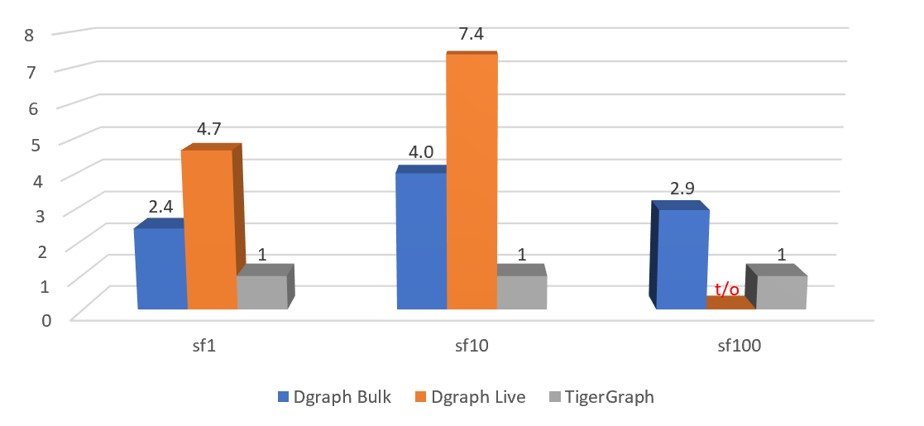
Figure 4.1: Normalized performance chart of loading job. t/o stands for a timeout—execution did not finish in 86,400 seconds. (Each loading time is normalized against TigerGraph loading time)
When loading the SF-100 dataset, Dgraph Live Loader failed to complete the loading within 24 hours. When loading data, as the size of the dataset increases, TigerGraph is two to four times faster than Dgraph Bulk and nine to 30 times faster than Dgraph Live.
5. Query Performance
5.0 Unreachable Query
In LDBC-SNB, there are 14, 7, and 25 queries for IS, IC, and BI series respectively, and there are 1, 2, and 13 queries that cannot be expressed by Dgraph’s query language GraphQL+-. The reasons Dgraph’s query language cannot complete the query are as follows:
Reason |
Query ID |
No DateTime function |
IC10, BI1, BI2, BI13, BI23, BI24 |
All the shortest paths are only shown in JSON and cannot be used as variables for subsequent calculation |
IC14, BI25 |
Cannot perform calculation operations involving intermediate nodes on multiple target points |
IS2, BI11, BI14, BI16, BI17, BI19, BI22 |
Groupby cannot by a value variable |
BI18 |
All queries TigerGraph can be completed, so in the following analysis, we will only compare the queries that Dgraph can complete.
5.1 IC Workload
There are 14 queries in the Interactive Complex (IC) series. Table 5.1 shows the query response time of Dgraph and TigerGraph with SF-1, SF-10, and SF-100.
Table 5.1: IC queries workload (in seconds)
Query Id |
Tiger Graph_sf1 |
Tiger Graph_sf10 |
Tiger Graph_sf100 |
Dgraph _sf1 |
Dgraph _sf10 |
Dgraph _sf100 |
IC1 |
0.017 |
0.018 |
0.060 |
0.017 |
0.290 |
2.916 |
IC2 |
0.016 |
0.032 |
5.293 |
0.290 |
0.953 |
10.160 |
IC3 |
0.060 |
0.051 |
0.970 |
0.810 |
6.697 |
80.467 |
IC4 |
0.004 |
0.005 |
0.037 |
0.186 |
0.832 |
8.478 |
IC5 |
0.321 |
0.187 |
23.887 |
0.091 |
0.412 |
3.649 |
IC6 |
0.146 |
0.405 |
1.020 |
0.372 |
9.899 |
223 |
IC7 |
0.011 |
0.004 |
0.004 |
0.275 |
0.854 |
8.831 |
IC8 |
0.002 |
0.003 |
0.007 |
0.563 |
2.421 |
22.235 |
IC9 |
0.247 |
0.908 |
9.869 |
0.752 |
17.663 |
46.381 |
IC11 |
0.004 |
0.021 |
0.028 |
0.015 |
0.052 |
0.410 |
IC12 |
0.012 |
0.019 |
2.879 |
0.439 |
2.525 |
22.884 |
IC13 |
0.003 |
0.005 |
0.012 |
0.005 |
3.205 |
1.938 |
SF-1(IC)
SF-10(IC)
SF-100(IC)
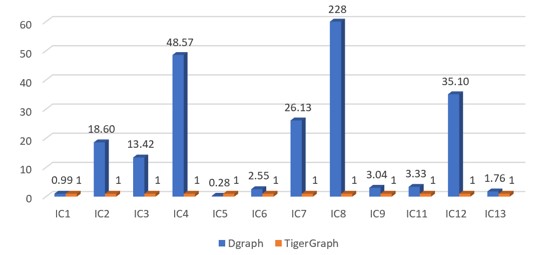
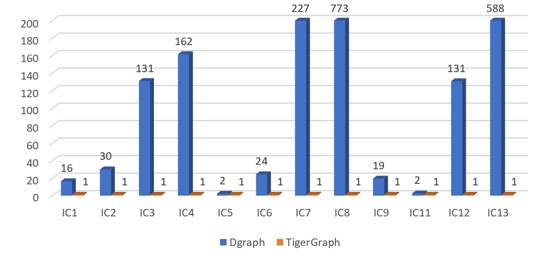
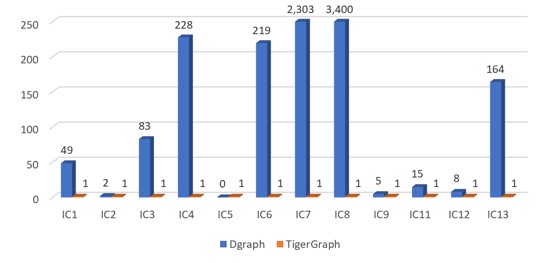
Figure 5.1 Normalized performance chart of IC queries(Each query's running time is normalized against TigerGraph running time of this query)
In IC, Dgraph did not complete queries IC10 and IC14.
The key things in Figure 5.1 above are:
When the size of the dataset increased, the response time of some queries running on Dgraph increased exponentially, but the response time with TigerGraph increased only slightly. Obviously, the query efficiency of TigerGraph is much better than that of the Dgraph with large amounts of data.
In most cases, the query response speed of TigerGraph is two to 3,000 times faster than that of the Dgraph.
5.2 IS Workload
There are seven queries in the IS series. Table 5.2 shows the query response times of TigerGraph and Dgraph using the SF-1, SF-10, and SF-100 datasets.
Table 5.2: IS queries workload (in seconds)
Query Id |
Tiger Graph_sf1 |
Tiger Graph_sf10 |
Tiger Graph_sf100 |
Dgraph _sf1 |
Dgraph _sf10 |
Dgraph _sf100 |
IS1 |
0.002 |
0.003 |
0.004 |
0.007 |
0.004 |
0.085 |
IS3 |
0.009 |
0.002 |
0.004 |
0.008 |
0.009 |
0.173 |
IS4 |
0.002 |
0.003 |
0.004 |
0.291 |
0.813 |
8.255 |
IS5 |
0.002 |
0.003 |
0.004 |
0.301 |
0.802 |
8.131 |
IS6 |
0.003 |
0.004 |
0.004 |
0.301 |
0.832 |
8.557 |
IS7 |
0.003 |
0.005 |
0.007 |
0.411 |
1.837 |
19.610 |
SF-1(IS)
SF-10(IS)
SF-100(IS)
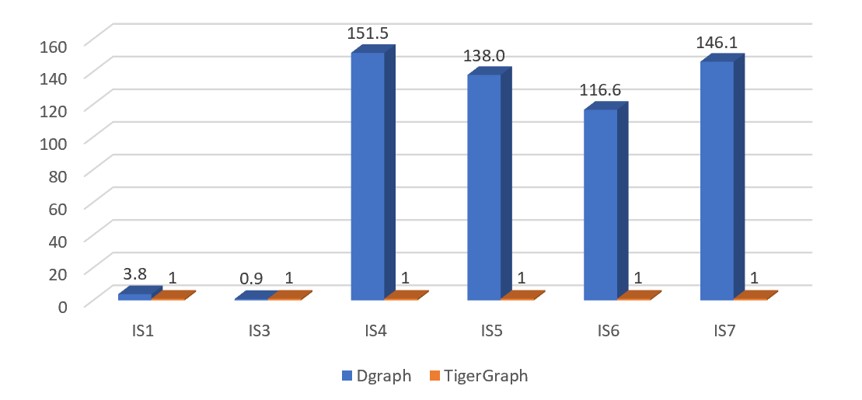
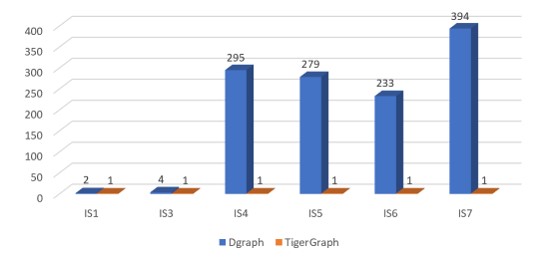
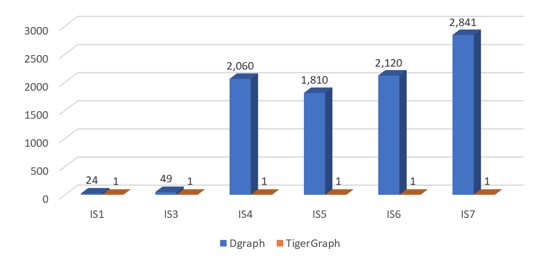
Figure 5.2 Normalized performance chart of IS queries(Each query's running time is normalized against TigerGraph running time of this query)
Under the IS workload, Dgraph did not complete query IS2.
Figure 5.2 shows that the response time of query IS4, IS5, IS6, IS7 of Dgraph increased several times when the amount of data increased 10 times and 100 times. In fact, IS4, IS5, IS6, IS7 are very simple data retrieval queries. This may, however, be due to the type of vertex to be searched as Message type, the amount of data of these types of vertices accounts for 80% of all the vertices. This may indicate that Dgraph is not suitable for large datasets.
Things to note in Figures 5.3 are:
The query response time of the TigerGraph did not fluctuate with the increase of dataset size.
Dgraph is not suitable for large datasets.
TigerGraph's query response time is two to around 2000 times faster than Dgraph in most cases.
5.3 BI Workloads
There are 25 queries in the BI series. The following table shows the query response times of TigerGraph and DGraph on SF-1, SF-10, and SF-100.
Table 5.3: BI queries workload (in seconds)
Query Id |
Tiger Graph_sf1 |
Tiger Graph_sf10 |
Tiger Graph_sf100 |
Dgraph _sf1 |
Dgraph _sf10 |
Dgraph _sf100 |
BI3 |
0.127 |
0.944 |
37.075 |
7.315 |
72 |
577.701 |
BI4 |
0.028 |
0.150 |
1.176 |
0.157 |
1.262 |
13.846 |
BI5 |
0.078 |
0.269 |
0.251 |
1.252 |
14.714 |
402.202 |
BI6 |
0.017 |
0.286 |
3.996 |
0.995 |
16.147 |
814.294 |
BI7 |
0.345 |
4.937 |
20.396 |
10.087 |
146.795 |
2356 |
BI8 |
0.037 |
0.114 |
3.468 |
0.440 |
3.370 |
31.833 |
BI9 |
0.050 |
0.314 |
13.636 |
0.075 |
0.687 |
6.180 |
BI10 |
0.038 |
7.226 |
43.815 |
2.299 |
68.875 |
990 |
BI12 |
0.161 |
2.132 |
32.119 |
5.900 |
58.250 |
850 |
BI15 |
0.003 |
0.011 |
0.221 |
0.010 |
0.023 |
0.098 |
BI20 |
0.994 |
6.894 |
28.338 |
1.122 |
15.820 |
156.488 |
BI21 |
0.010 |
0.047 |
2.845 |
0.323 |
2.205 |
25.889 |
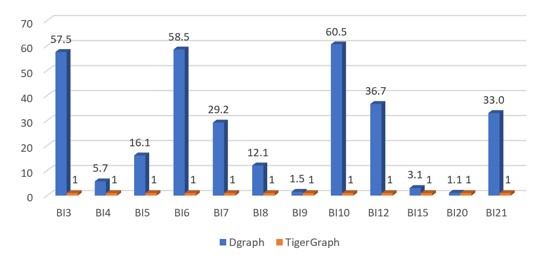
SF-1(BI)
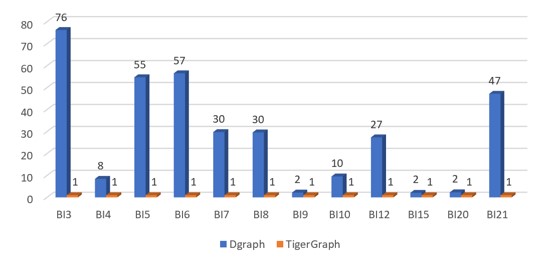
SF-10(BI)
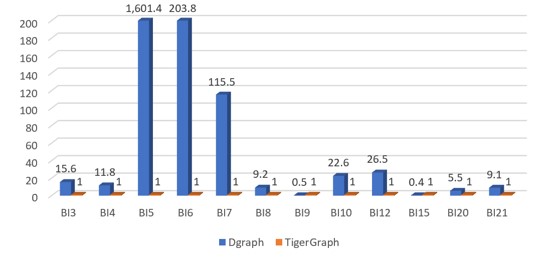
SF-100(BI)
Figure 5.3 Normalized performance chart of BI queries(Each query's running time is normalized against TigerGraph running time of this query)
Dgraph was unable to complete 13 queries.
Although the query of BI series is much more complex than that of the IS series, we can still draw the same conclusion from Figure 5.2: Dgraph is not suitable for data sets with a super large size.
The key thing to note in Figure 5.3 is:
TigerGraph's query response time was about two to 1,600 times faster than Dgraph in most cases.
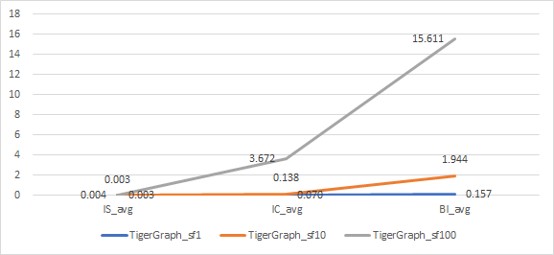
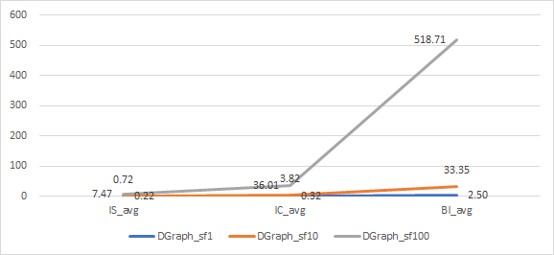
The BI query series has more statistical calculation than IS and IC. To know if TigerGraph and Dgraph increased the query response time due to statistical calculation, we took the average response time of three series of queries with different data sizes and created Figure 5.4.
(a)
(b)
Figure 5.4: Average query response time against dataset size
As Figure 5.4 shows that, with the increase of the size of the dataset and the complexity of the query, the query response times of TigerGraph increased by two to five times, but the maximum average query response time was only 15.6s. The maximum average query response time of the Dgraph was 518.7s.
With the increase of dataset size and the complexity of the query, the query response time of Dgraph increased by more than 14 times, and that of TigerGraph increased by two to five times.
6. Conclusion
In a recent study using the Linked Data Benchmark Council Social Network Benchmark, we observed the following:
When loading data, TigerGraph was two to four times faster than Dgraph Bulk and nine to 30 times faster than Dgraph Live.
When running complex, read-only queries TigerGraph was two to 3,000 times faster than that of Dgraph.
When running most short, read-only queries TigerGraph was about two to 2,000 times faster than Dgraph.
When running short, read-only queries, the response time of TigerGraph did not fluctuate with the increase of data set size, while that of Dgraph did.
When running most business intelligence workloads, TigerGraph was about two to 1,600 times faster than Dgraph.
With the increase of dataset size and the complexity of the query, TigerGraph’s query response time increased by two to five times, while Dgraph’s query response time increased by more than 14 times.
Our study showed, therefore, that TigerGraph outperformed Dgraph in terms of data loading time and query running times.
Opinions expressed by DZone contributors are their own.
Comments