Control Your Services With OTEL, Jaeger, and Prometheus
In this article, we will combine OTEL, Jaeger, and Prometheus for faster, centralized observability and quick troubleshooting in distributed systems.
Join the DZone community and get the full member experience.
Join For FreeLet's discuss an important question: how do we monitor our services if something goes wrong?
On the one hand, we have Prometheus with alerts and Kibana for dashboards and other helpful features. We also know how to gather logs — the ELK stack is our go-to solution. However, simple logging isn’t always enough: it doesn’t provide a holistic view of a request’s journey across the entire ecosystem of components.
You can find more info about ELK here.
But what if we want to visualize requests? What if we need to correlate requests traveling between systems? This applies to both microservices and monoliths — it doesn’t matter how many services we have; what matters is how we manage their latency.
Indeed, each user request might pass through a whole chain of independent services, databases, message queues, and external APIs.
In such a complex environment, it becomes extremely difficult to pinpoint exactly where delays occur, identify which part of the chain acts as a performance bottleneck, and quickly find the root cause of failures when they happen.
To address these challenges effectively, we need a centralized, consistent system to collect telemetry data — traces, metrics, and logs. This is where OpenTelemetry and Jaeger come to the rescue.
Let's Look at the Basics
There are two main terms we have to understand:
Trace ID
A Trace ID is a 16-byte identifier, often represented as a 32-character hexadecimal string. It’s automatically generated at the start of a trace and stays the same across all spans created by a particular request. This makes it easy to see how a request travels through different services or components in a system.
Span ID
Every individual operation within a trace gets its own Span ID, which is typically a randomly generated 64-bit value. Spans share the same Trace ID, but each one has a unique Span ID, so you can pinpoint exactly which part of the workflow each span represents (like a database query or a call to another microservice).
How Are They Related?
Trace ID and Span ID complement each other.
When a request is initiated, a Trace ID is generated and passed to all involved services. Each service, in turn, creates a span with a unique Span ID linked to the Trace ID, enabling you to visualize the full lifecycle of the request from start to finish.
Okay, so why not just use Jaeger? Why do we need OpenTelemetry (OTEL) and all its specifications? That’s a great question! Let’s break it down step by step.
Find more about Jaeger here.
TL;DR
- Jaeger is a system for storing and visualizing distributed traces. It collects, stores, searches, and displays data showing how requests “travel” through your services.
- OpenTelemetry (OTEL) is a standard (and a set of libraries) for collecting telemetry data (traces, metrics, logs) from your applications and infrastructure. It isn’t tied to any single visualization tool or backend.
Put simply:
- OTEL is like a “universal language” and set of libraries for telemetry collection.
- Jaeger is a backend and UI for viewing and analyzing distributed traces.
Why Do We Need OTEL if We Already Have Jaeger?
1. A Single Standard for Collection
In the past, there were projects like OpenTracing and OpenCensus. OpenTelemetry unifies these approaches to collecting metrics and traces into one universal standard.
2. Easy Integration
You write your code in Go (or another language), add OTEL libraries for auto-injecting interceptors and spans, and that’s it. Afterward, it doesn’t matter where you want to send that data—Jaeger, Tempo, Zipkin, Datadog, a custom backend—OpenTelemetry takes care of the plumbing. You just swap out the exporter.
3. Not Just Traces
OpenTelemetry covers traces, but it also handles metrics and logs. You end up with a single toolset for all your telemetry needs, not just tracing.
4. Jaeger as a Backend
Jaeger is an excellent choice if you’re primarily interested in distributed tracing visualization. But it doesn’t provide the cross-language instrumentation by default. OpenTelemetry, on the other hand, gives you a standardized way to collect data, and then you decide where to send it (including Jaeger).
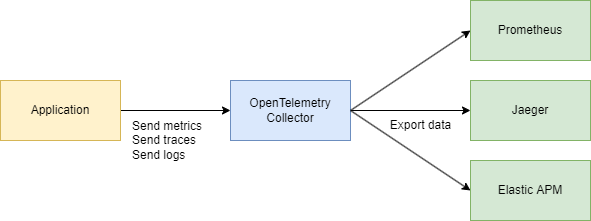
In practice, they often work together:
Your application uses OpenTelemetry → communicates via OTLP protocol → goes to the OpenTelemetry Collector (HTTP or grpc) → exports to Jaeger for visualization.
Tech Part
System Design (A Little Bit)
Let's quickly sketch out a couple of services that will do the following:
- Purchase Service – processes a payment and records it in MongoDB
- CDC with Debezium – listens for changes in the MongoDB table and sends them to Kafka
- Purchase Processor – consumes the message from Kafka and calls the Auth Service to look up the
user_idfor validation - Auth Service – a simple user service
In summary:
- 3 Go services
- Kafka
- CDC (Debezium)
- MongoDB
Code Part
Let’s start with the infrastructure. To tie everything together into one system, we’ll create a large Docker Compose file. We’ll begin by setting up telemetry.
Note: All the code is available via a link at the end of the article, including the infrastructure.
services:

  jaeger:
    image: jaegertracing/all-in-one:1.52
    ports:
      - "6831:6831/udp" # UDP port for the Jaeger agent
      - "16686:16686"   # Web UI
      - "14268:14268"   # HTTP port for spans
    networks:
      - internal

  prometheus:
    image: prom/prometheus:latest
    volumes:
      - ./prometheus.yml:/etc/prometheus/prometheus.yml:ro
    ports:
      - "9090:9090"
    depends_on:
      - kafka
      - jaeger
      - otel-collector
    command:
      --config.file=/etc/prometheus/prometheus.yml
    networks:
      - internal

  otel-collector:
    image: otel/opentelemetry-collector-contrib:0.91.0
    command: ['--config=/etc/otel-collector.yaml']
    ports:
      - "4317:4317" # OTLP gRPC receiver
    volumes:
      - ./otel-collector.yaml:/etc/otel-collector.yaml
    depends_on:
      - jaeger
    networks:
      - internal
We’ll also configure the collector — the component that gathers telemetry.
Here, we choose gRPC for data transfer, which means communication will happen over HTTP/2:
receivers:
  # Add the OTLP receiver listening on port 4317.
  otlp:
    protocols:
      grpc:
        endpoint: "0.0.0.0:4317"

processors:
  batch:
  # https://github.com/open-telemetry/opentelemetry-collector/tree/main/processor/memorylimiterprocessor
  memory_limiter:
    check_interval: 1s
    limit_percentage: 80
    spike_limit_percentage: 15

extensions:
  health_check: {}

exporters:
  otlp:
    endpoint: "jaeger:4317"
    tls:
      insecure: true
  prometheus:
    endpoint: 0.0.0.0:9090
  debug:
    verbosity: detailed

service:
  extensions: [health_check]
  pipelines:
    traces:
      receivers: [otlp]
      processors: [memory_limiter, batch]
      exporters: [otlp]

    metrics:
      receivers: [otlp]
      processors: [memory_limiter, batch]
      exporters: [prometheus]
Make sure to adjust any addresses as needed, and you’re done with the base configuration.
We already know OpenTelemetry (OTEL) uses two key concepts — Trace ID and Span ID — that help track and monitor requests in distributed systems.
Implementing the Code
Now, let’s look at how to get this working in your Go code. We need the following imports:
"go.opentelemetry.io/otel"
"go.opentelemetry.io/otel/exporters/otlp/otlptrace"
"go.opentelemetry.io/otel/exporters/otlp/otlptrace/otlptracegrpc"
"go.opentelemetry.io/otel/sdk/resource"
"go.opentelemetry.io/otel/sdk/trace"
semconv "go.opentelemetry.io/otel/semconv/v1.17.0"
Then, we add a function to initialize our tracer in main() when the application starts:
func InitTracer(ctx context.Context) func() {
    exp, err := otlptrace.New(
        ctx,
        otlptracegrpc.NewClient(
            otlptracegrpc.WithEndpoint(endpoint),
            otlptracegrpc.WithInsecure(),
        ),
    )
    if err != nil {
        log.Fatalf("failed to create OTLP trace exporter: %v", err)
    }

    res, err := resource.New(ctx,
        resource.WithAttributes(
            semconv.ServiceNameKey.String("auth-service"),
            semconv.ServiceVersionKey.String("1.0.0"),
            semconv.DeploymentEnvironmentKey.String("stg"),
        ),
    )
    if err != nil {
        log.Fatalf("failed to create resource: %v", err)
    }

    tp := trace.NewTracerProvider(
        trace.WithBatcher(exp),
        trace.WithResource(res),
    )

    otel.SetTracerProvider(tp)

    return func() {
        err := tp.Shutdown(ctx)
        if err != nil {
            log.Printf("error shutting down tracer provider: %v", err)
        }
    }
}
With tracing set up, we just need to place spans in the code to track calls. For example, if we want to measure database calls (since that’s usually the first place we look for performance issues), we can write something like this:
tracer := otel.Tracer("auth-service")
ctx, span := tracer.Start(ctx, "GetUserInfo")
defer span.End()

tracedLogger := logging.AddTraceContextToLogger(ctx)

tracedLogger.Info("find user info",
    zap.String("operation", "find user"),
    zap.String("username", username),
)

user, err := s.userRepo.GetUserInfo(ctx, username)
if err != nil {
    s.logger.Error(errNotFound)
    span.RecordError(err)
    span.SetStatus(otelCodes.Error, "Failed to fetch user info")

    return nil, status.Errorf(grpcCodes.NotFound, errNotFound, err)
}

span.SetStatus(otelCodes.Ok, "User info retrieved successfully")
We have tracing at the service layer — great! But we can go even deeper, instrumenting the database layer:
func (r *UserRepository) GetUserInfo(ctx context.Context, username string) (*models.User, error) {
    tracer := otel.Tracer("auth-service")
    ctx, span := tracer.Start(ctx, "UserRepository.GetUserInfo",
        trace.WithAttributes(
            attribute.String("db.statement", query),
            attribute.String("db.user", username),
        ),
    )
    defer span.End()

    var user models.User

    // Some code that queries the DB...
    // err := doDatabaseCall()

    if err != nil {
        span.RecordError(err)
        span.SetStatus(codes.Error, "Failed to execute query")
        return nil, fmt.Errorf("failed to fetch user info: %w", err)
    }

    span.SetStatus(codes.Ok, "Query executed successfully")
    return &user, nil
}
Now, we have a complete view of the request journey. Head to the Jaeger UI, query for the last 20 traces under auth-service, and you’ll see all the spans and how they connect in one place.
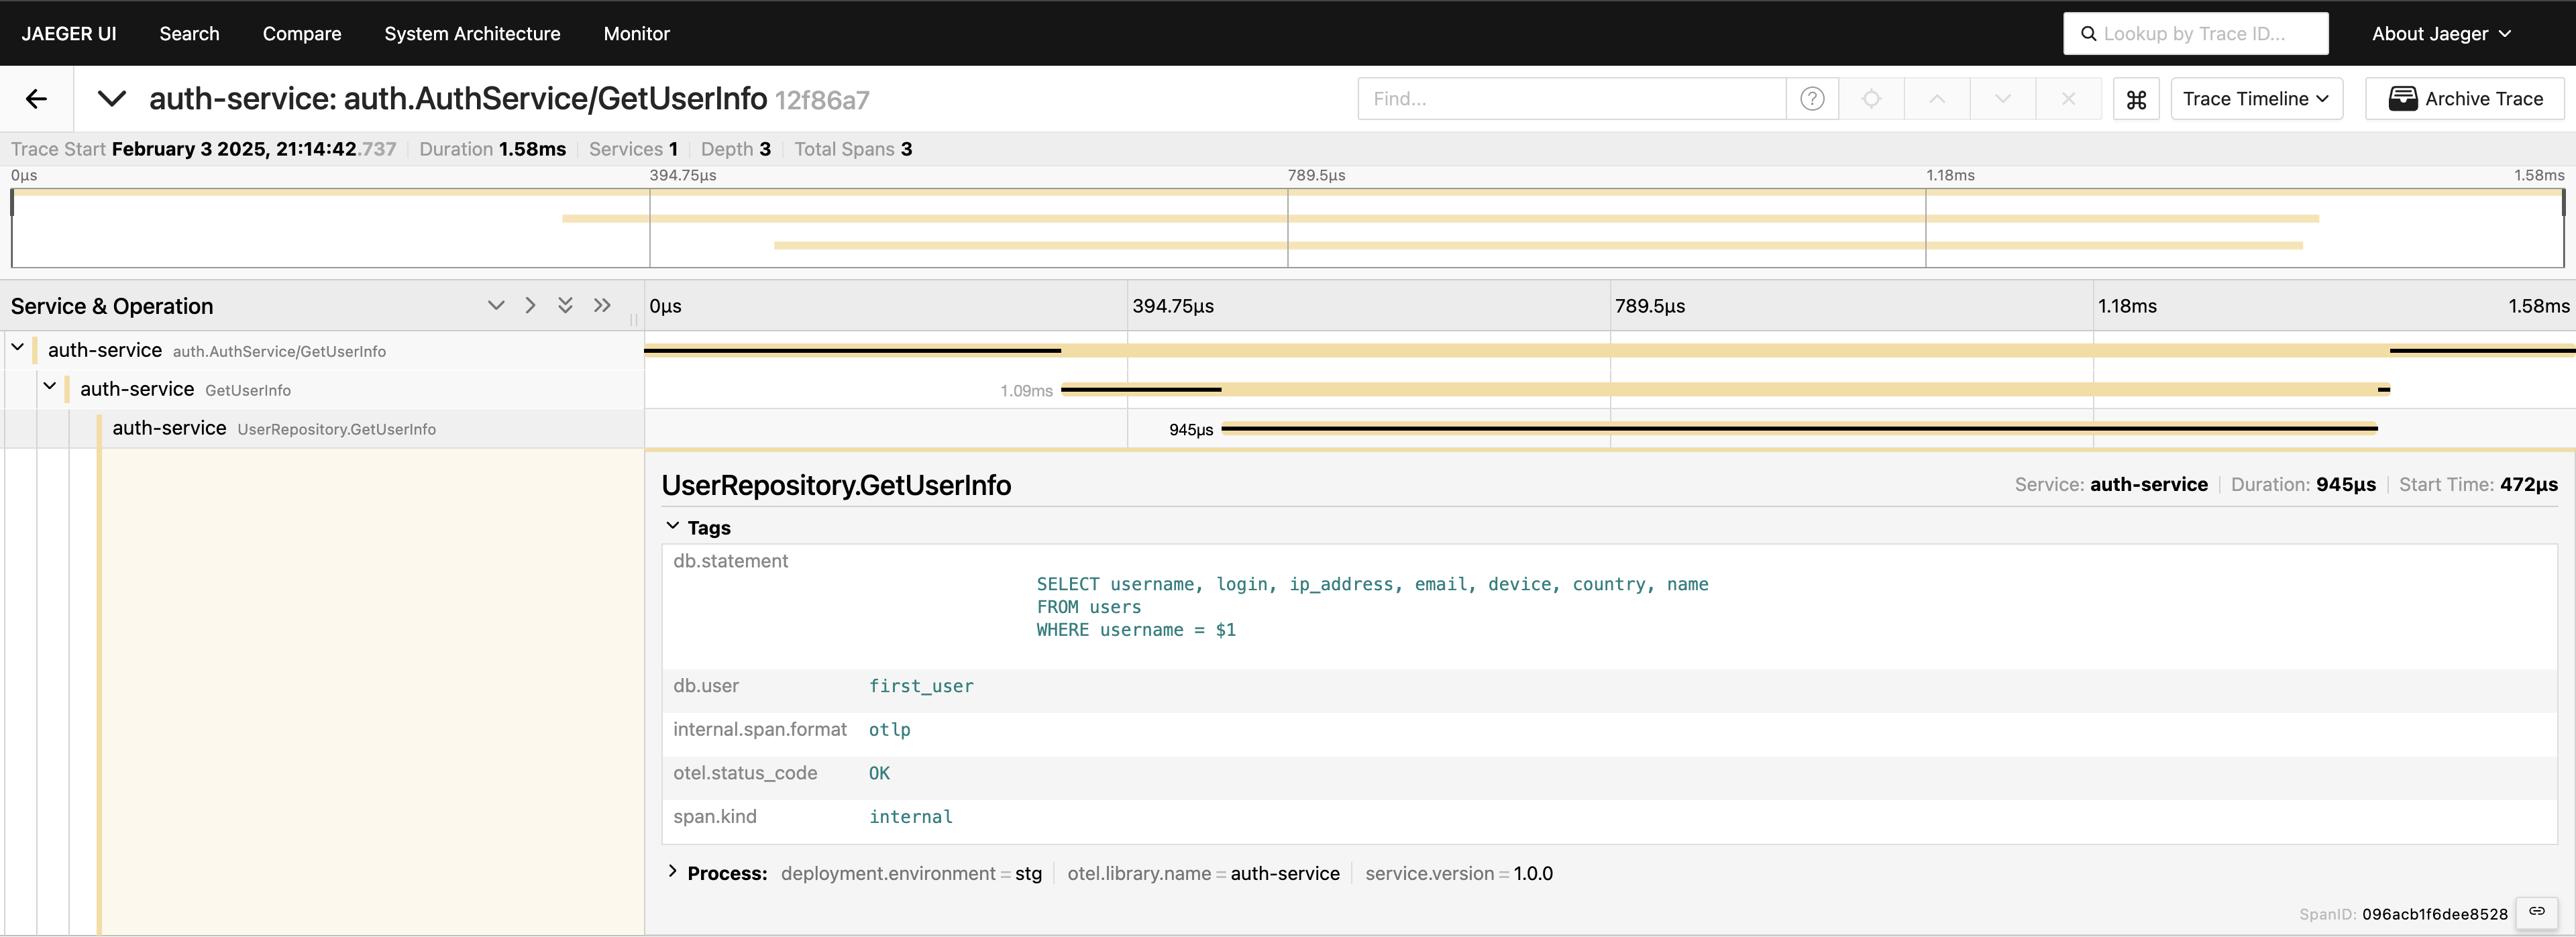
Now, everything is visible. If you need it, you can include the entire query in the tags. However, keep in mind that you shouldn’t overload your telemetry — add data deliberately. I’m simply demonstrating what’s possible, but including the full query, this way isn’t something I’d generally recommend.
gRPC client-server
If you want to see a trace that spans two gRPC services, it’s quite straightforward. All you need is to add the out-of-the-box interceptors from the library. For example, on the server side:
server := grpc.NewServer(
    grpc.StatsHandler(otelgrpc.NewServerHandler()),
)

pb.RegisterAuthServiceServer(server, authService)
On the client side, the code is just as short:
shutdown := tracing.InitTracer(ctx)
defer shutdown()

conn, err := grpc.Dial(
    "auth-service:50051",
    grpc.WithInsecure(),
    grpc.WithStatsHandler(otelgrpc.NewClientHandler()),
)
if err != nil {
    logger.Fatal("error", zap.Error(err))
}
That’s it! Ensure your exporters are configured correctly, and you’ll see a single Trace ID logged across these services when the client calls the server.
Handling CDC Events and Tracing
Want to handle events from the CDC as well? One simple approach is to embed the Trace ID in the object that MongoDB stores. That way, when Debezium captures the change and sends it to Kafka, the Trace ID is already part of the record.
For instance, if you’re using MongoDB, you can do something like this:
func (r *mongoPurchaseRepo) SavePurchase(ctx context.Context, purchase entity.Purchase) error {
    span := r.handleTracing(ctx, purchase)
    defer span.End()

    // Insert the record into MongoDB, including the current span's Trace ID
    _, err := r.collection.InsertOne(ctx, bson.M{
        "_id":             purchase.ID,
        "user_id":         purchase.UserID,
        "username":        purchase.Username,
        "amount":          purchase.Amount,
        "currency":        purchase.Currency,
        "payment_method":  purchase.PaymentMethod,
        // ...
        "trace_id":        span.SpanContext().TraceID().String(),
    })

    return err
}
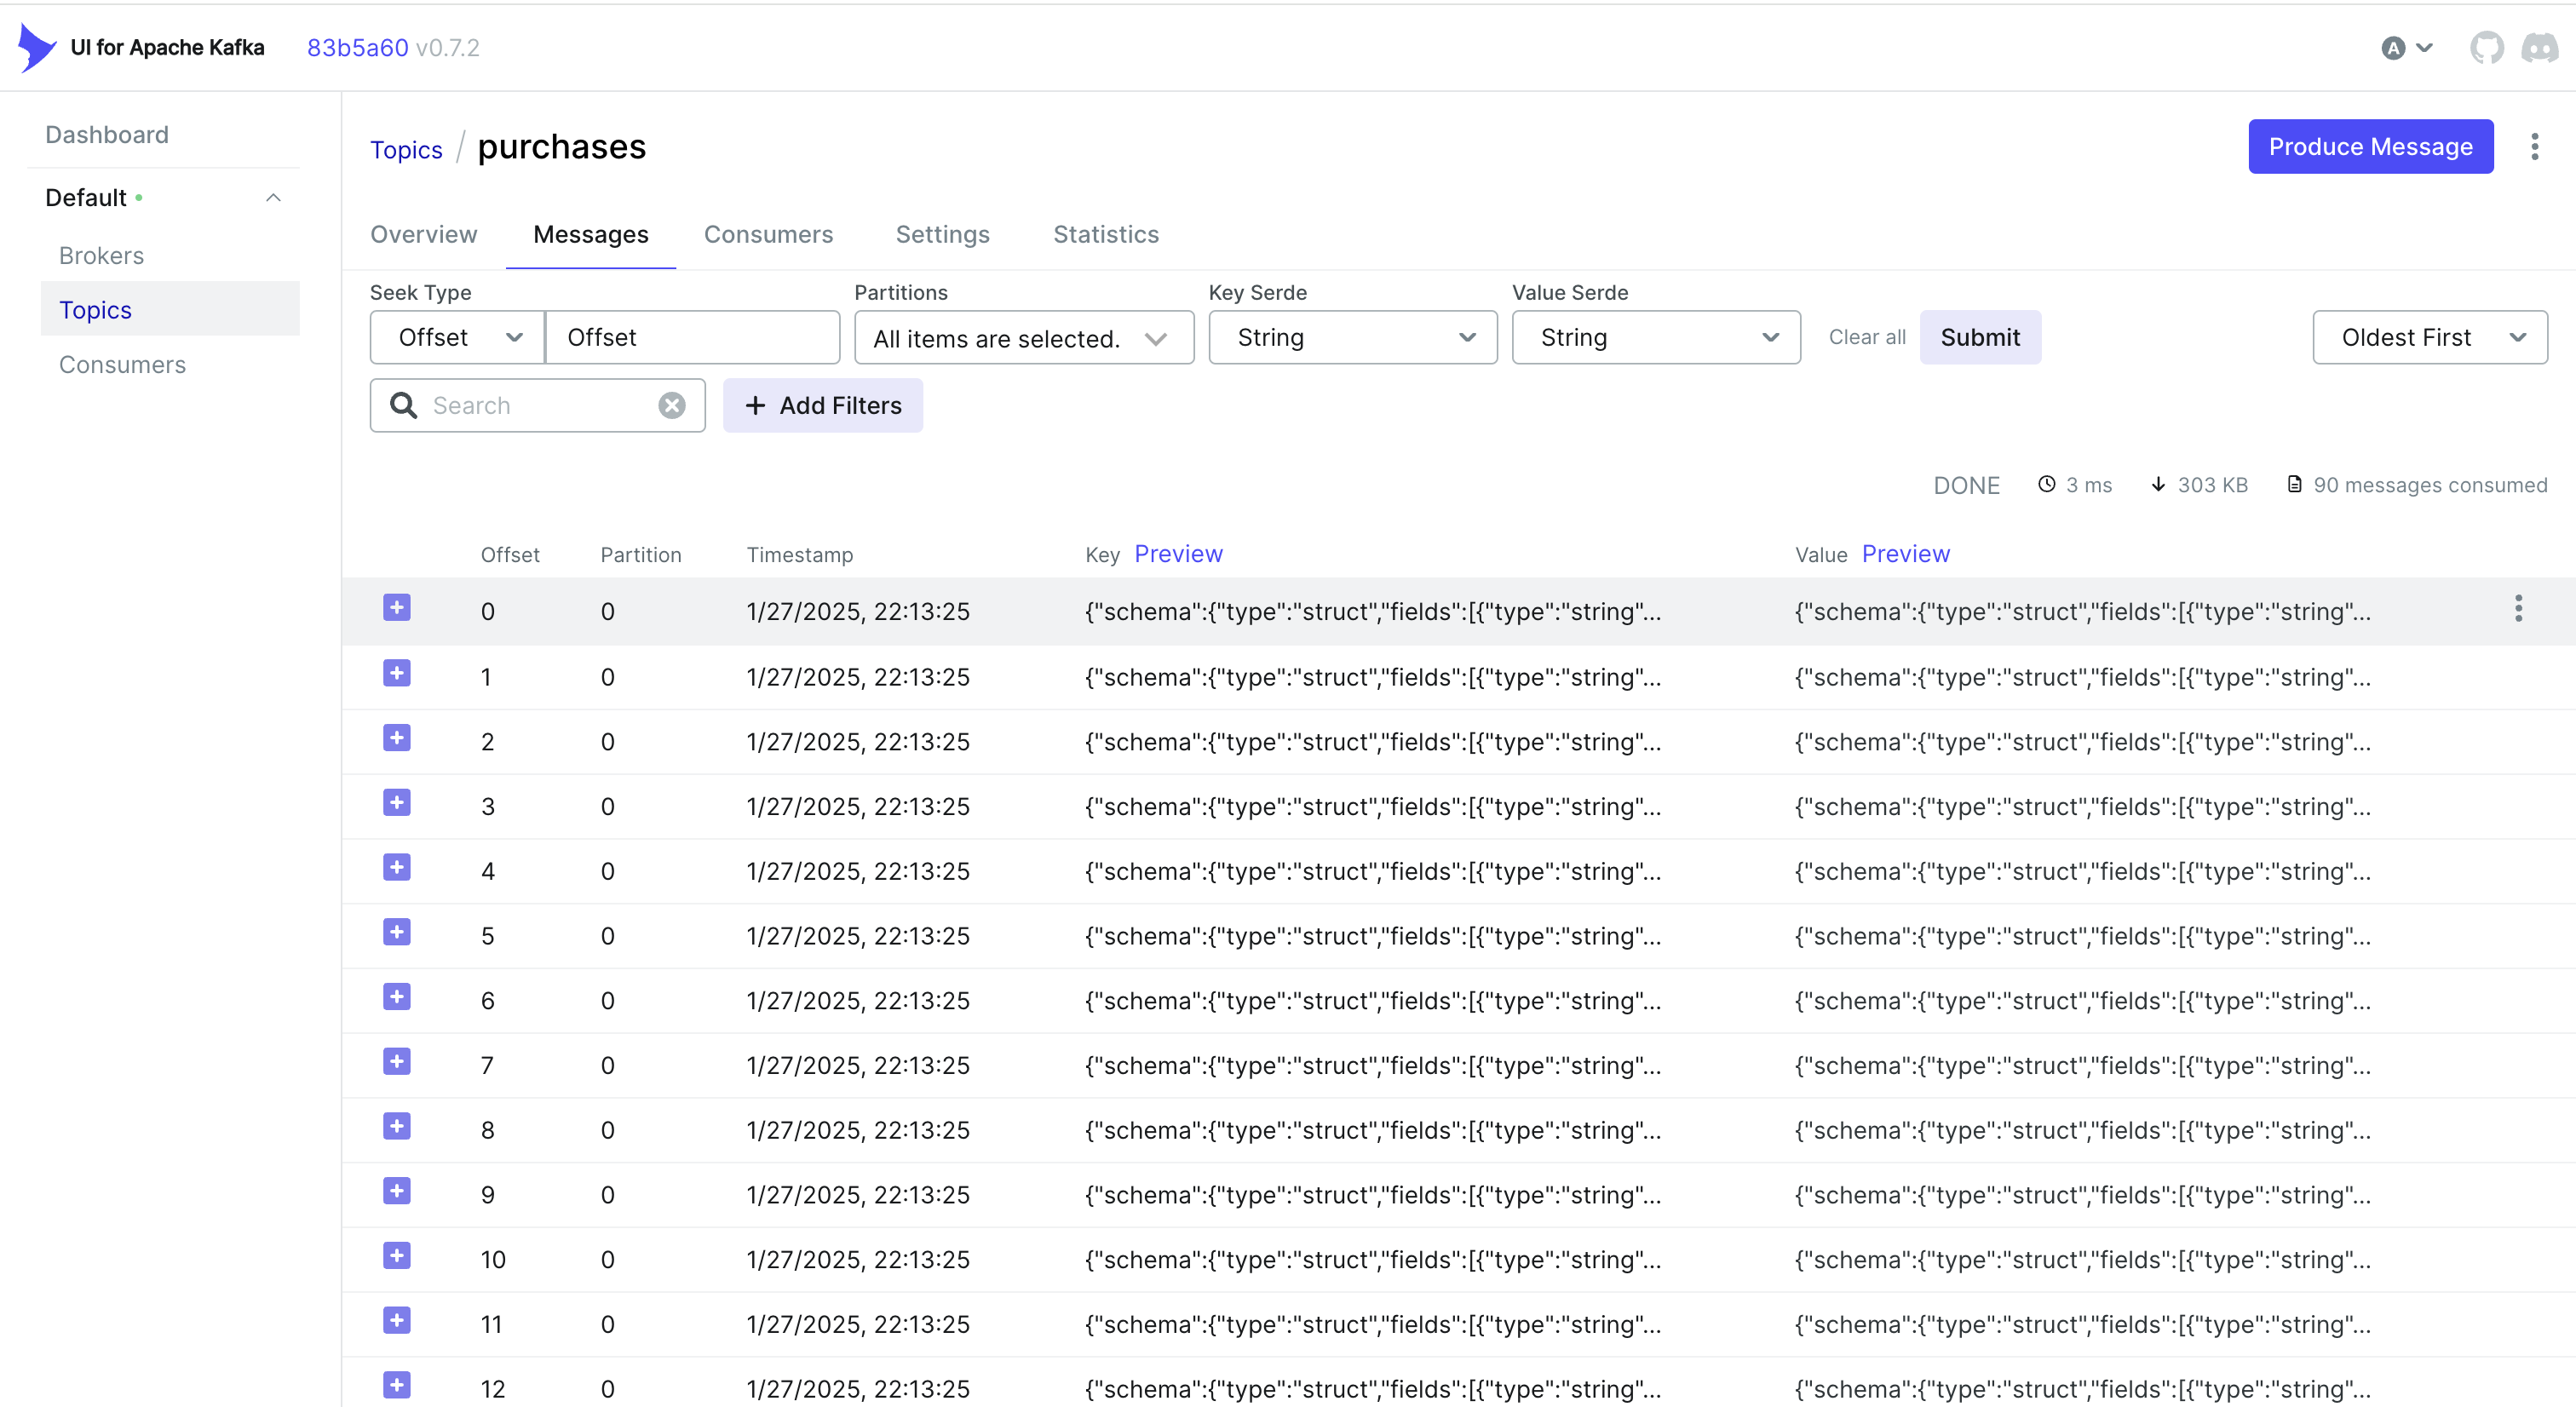
Debezium then picks up this object (including trace_id) and sends it to Kafka. On the consumer side, you simply parse the incoming message, extract the trace_id, and merge it into your tracing context:
// If we find a Trace ID in the payload, attach it to the context
newCtx := ctx
if traceID != "" {
    log.Printf("Found Trace ID: %s", traceID)
    newCtx = context.WithValue(ctx, "trace-id", traceID)
}

// Create a new span
tracer := otel.Tracer("purchase-processor")
newCtx, span := tracer.Start(newCtx, "handler.processPayload")
defer span.End()

if traceID != "" {
    span.SetAttributes(
        attribute.String("trace.id", traceID),
    )
}

// Parse the "after" field into a Purchase struct...
var purchase model.Purchase
if err := mapstructure.Decode(afterDoc, &purchase); err != nil {
    log.Printf("Failed to map 'after' payload to Purchase struct: %v", err)
    return err
}
Alternative: Using Kafka Headers
Sometimes, it’s easier to store the Trace ID in Kafka headers rather than in the payload itself. For CDC workflows, this might not be available out of the box — Debezium can limit what’s added to headers. But if you control the producer side (or if you’re using a standard Kafka producer), you can do something like this with Sarama:
Injecting a Trace ID into Headers
// saramaHeadersCarrier is a helper to set/get headers in a Sarama message.
type saramaHeadersCarrier *[]sarama.RecordHeader

func (c saramaHeadersCarrier) Get(key string) string {
    for _, h := range *c {
        if string(h.Key) == key {
            return string(h.Value)
        }
    }
    return ""
}

func (c saramaHeadersCarrier) Set(key string, value string) {
    *c = append(*c, sarama.RecordHeader{
        Key:   []byte(key),
        Value: []byte(value),
    })
}

// Before sending a message to Kafka:
func produceMessageWithTraceID(ctx context.Context, producer sarama.SyncProducer, topic string, value []byte) error {
    span := trace.SpanFromContext(ctx)
    traceID := span.SpanContext().TraceID().String()

    headers := make([]sarama.RecordHeader, 0)
    carrier := saramaHeadersCarrier(&headers)
    carrier.Set("trace-id", traceID)

    msg := &sarama.ProducerMessage{
        Topic:   topic,
        Value:   sarama.ByteEncoder(value),
        Headers: headers,
    }

    _, _, err := producer.SendMessage(msg)
    return err
}
Extracting a Trace ID on the Consumer Side
for message := range claim.Messages() {
    // Extract the trace ID from headers
    var traceID string
    for _, hdr := range message.Headers {
        if string(hdr.Key) == "trace-id" {
            traceID = string(hdr.Value)
        }
    }

    // Now continue your normal tracing workflow
    if traceID != "" {
        log.Printf("Found Trace ID in headers: %s", traceID)
        // Attach it to the context or create a new span with this info
    }
}
Depending on your use case and how your CDC pipeline is set up, you can choose the approach that works best:
- Embed the Trace ID in the database record so it flows naturally via CDC.
- Use Kafka headers if you have more control over the producer side or you want to avoid inflating the message payload.
Either way, you can keep your traces consistent across multiple services—even when events are asynchronously processed via Kafka and Debezium.
Conclusion
Using OpenTelemetry and Jaeger provides detailed request traces, helping you pinpoint where and why delays occur in distributed systems.
Adding Prometheus completes the picture with metrics — key indicators of performance and stability. Together, these tools form a comprehensive observability stack, enabling faster issue detection and resolution, performance optimization, and overall system reliability.
I can say that this approach significantly speeds up troubleshooting in a microservices environment and is one of the first things we implement in our projects.

Links
Opinions expressed by DZone contributors are their own.
Comments