Customer Churn Analysis: Using Logistic Regression to Predict At-Risk Customers
For predicting a discrete variable, logistic regression is your friend. Let's learn why linear regression won't work as we build a simple customer churn model.
Join the DZone community and get the full member experience.
Join For FreeWe all know that linear regression routines are pretty straightforward and easy to understand. Where it clearly states that the value of an independent variable increases by 1 point, the dependent variable increases by b units.
However, when it comes to predicting a discrete variable — for example, whether a customer will stay with a service provider or not, or whether it will rain or not — logistic regression will come into play. There are not many distinct values, and the outcome can only be a 1 or a 0.
In this article, we will learn how to build a simple customer churn model within Excel, and we will use Solver to optimize this model by reducing the cross entropy error.
Before we get into the details of logistic regression, let's understand why linear regression will not work when we have to predict a discrete outcome based on the following limitations of linear regression:
- Linear regression assumes a linear relationship between each variable. However, if the customer is paying less for a particular service compared to a competitor, the chances of the customer leaving the service provider will vary exponentially.
- Linear regression assumes that the probability increases proportionately as the independent variable increases.
Solution: Sigmoid Curve to the Rescue

As stated above, the major problem with linear regression is its assumption of a linear relationship among variables, which is very rare in practice.
In order to solve this (and a few other) limitation problems, we will explore the sigmoid curve. In layman's language, we can say that the sigmoid function (curve) helps to return the probability value, which can then be mapped to two or more discrete classes. Whereas, in general, linear regression does not tell us the probability of an event happening after certain range.
Based on the above explanation, we can say that the sigmoid curve can better explain discrete phenomena than linear regression.
Just to keep things simple, I will move on to the core topic of this article, i.e., how to use logistic regression to retain customers. For this, we will work to understand logistic regression and see how it can be implemented.
As we know, linear regression assumes a linear relation between dependent and independent variables. It is expressed as Y = x+b*X. Logistic regression moves away from the notion of linear relation by applying the sigmoid curve.

The above notation clearly show how logistic regression uses independent variables, which is the same as linear regression. At the same time, however, it also passes those variables through a sigmoid activation to bound the outputs in between 0 or a 1.
Now, to see how the output changes in a logistic regression, let's look under the hood of a logistic regression equation with the help of an example:
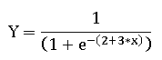
- If X = 0, the value of Y = 1/(1 + exp(-(2))) = 0.88
- If X is increased by 2 units (that is, X = 2), the value of Y is Y = 1/(1 + exp(-(2+3*2))) = 1/(1+exp(-(5))) = 0.993
It is quite clear when the value of Y changed from 0.88 to 0.99, as X changed from 0 to 2. Similarly, if X were -2, Y would have been at 0.017. Therefore, the impact on Y of a unit change in X depends on the equation. The value 0.88 when X = 0 can be interpreted as the probability. For example, on average in 88% cases, the value of Y is 1 when X = 0.
Logistic Regression in Action
To see the above equation and routine in action, we will go through the exercise of building a logistic regression equation in Excel. The challenge is to be able to predict whether a customer will stay with a service provider or not, based on a few variables listed in the below table.

Steps to Follow
- Initialize the weights of independent variables to random values (let's assume 1 each).
- Once the weights and the bias are initialized, we'll estimate the output value (the probability of a customer leaving = 1 or staying =- 0) by applying sigmoid activation on the multivariate linear regression of independent variables.
The table below contains information about the (a+b*X) part of the sigmoid curve and the final sigmoid activation value:
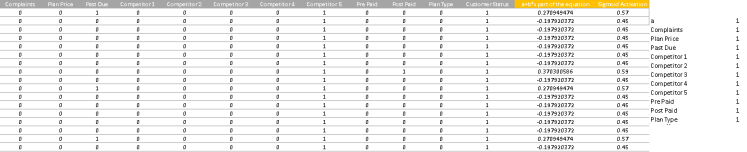
The formula for obtaining the values in the table above is given in the table below:

The if condition in the preceding sigmoid activation col. is used only because Excel has limitations in calculating any value >exp 500 — hence the clipping.
Error Estimation
In linear regression, we consider least squares (the squared difference) between the actual and the predicted value to estimate the overall error. In logistic regression, we will use a different error metric called cross entropy.
Cross entropy is a measure of difference between two different distributions — actual and predicted distribution.
Let's look at the two cost functions (least squares method and entropy cost) in cases where the dependent variable (Customer Churn) is 1:
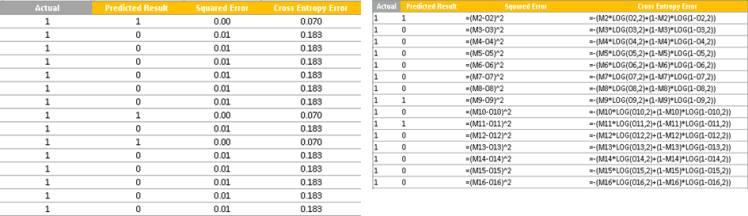
The above table clearly shows that the cross entropy method penalizes heavily for high prediction error compared to the squared error: lower error values have similar loss in both the squared error and the cross entropy error, but where there is a high difference, cross entropy penalizes heavily. So it is a good idea to stick with the cross entropy error as the error metric when predicting discrete variables.
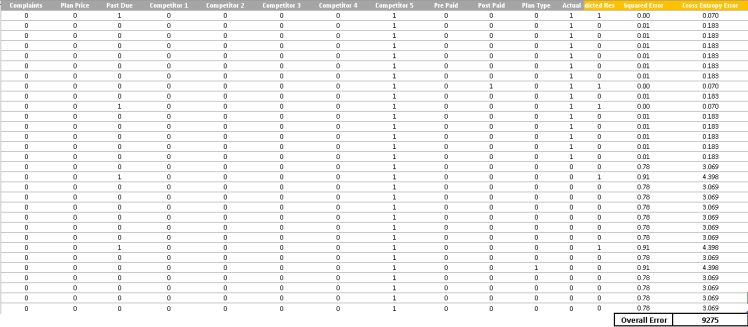
Now that we have set up our problem, let us vary the parameters in such a way that the overall error is reduced. This step can be performed by gradient descent, which can be done by using the Solver functionality in excel.
How do you perform logistic regression using Solver?Note: To improve the model performance and reduce the error, it will be a good idea to bring in only those variables which are statistically significant. For this activity, one can follow different approaches that are out of the scope of this article.
For training and consulting, visit my website.Published at DZone with permission of Sunil Kappal, DZone MVB. See the original article here.
Opinions expressed by DZone contributors are their own.
Comments