Create a D3 Dashboard With Cube.js
Join the DZone community and get the full member experience.
Join For Free
In this tutorial, I’ll cover building a basic dashboard application with Cube.js and the most popular library for visualizing data — D3.js. Although Cube.js doesn’t provide a visualization layer itself, it is very easy to integrate with any existing charting library. Additionally, you can use Cube.js Templates to scaffold a frontend application with your favorite charting library, frontend framework, and UI kit. The scaffolding engine will wire it all together and configure it to work with the Cube.js backend.
You can check the online demo of this dashboard here and the complete source code of the example app is available on Github.
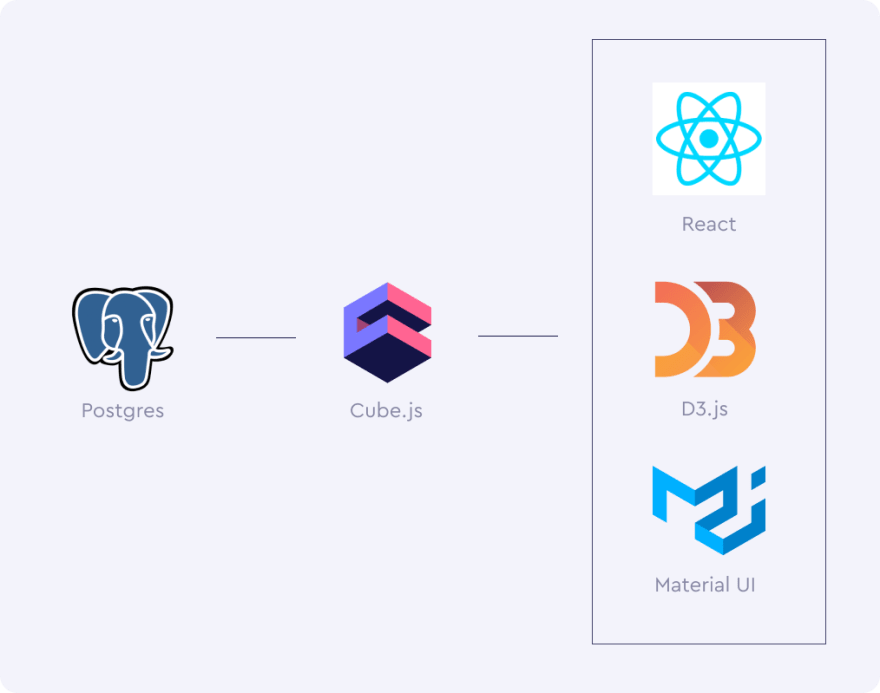
We are going to use Postgres to store our data. Cube.js will connect to it and act as a middleware between the database and the client, providing our API, abstraction, caching, and a lot more. On the frontend, we’ll have React with Material UI and D3 for chart rendering. Below, you can find a schema of the whole architecture of the example app.
If you have any questions while going through this guide, please feel free to join this Slack community and post your question there.
Happy Hacking!
You may also like: Cube.js: Ultimate Guide to the Open-Source Dashboard Framework
Setting Up a Database and Cube.js
The first thing we need to have in place is a database. We’ll use Postgres for this tutorial. However, you can use your favorite SQL (or Mongo) database. Please refer to the Cube.js documentation on how to connect to different databases.
If you don’t have any data for the dashboard, you can load our sample e-commerce Postgres dataset.
$ curl http://cube.dev/downloads/ecom-dump-d3-example.sql > ecom-dump.sql
$ createdb ecom
$ psql --dbname ecom -f ecom-dump.sql
Now, as we have data in the database, we’re ready to create the Cube.js Backend service. Run the following commands in your terminal:
xxxxxxxxxx
$ npm install -g cubejs-cli
$ cubejs create d3-dashboard -d postgres
The commands above install Cube.js CLI and create a new service configured to work with a Postgres database.
Cube.js uses environment variables for configuration. It uses environment variables starting with CUBEJS_. To configure the connection to our database, we need to specify the DB type and name. In the Cube.js project folder, replace the contents of the .env file with the following:
xxxxxxxxxx
CUBEJS_API_SECRET=SECRET
CUBEJS_DB_TYPE=postgres
CUBEJS_DB_NAME=ecom
CUBEJS_WEB_SOCKETS=true
Now let’s start the server and open the developer playground at http://localhost:4000.
xxxxxxxxxx
$ npm run dev
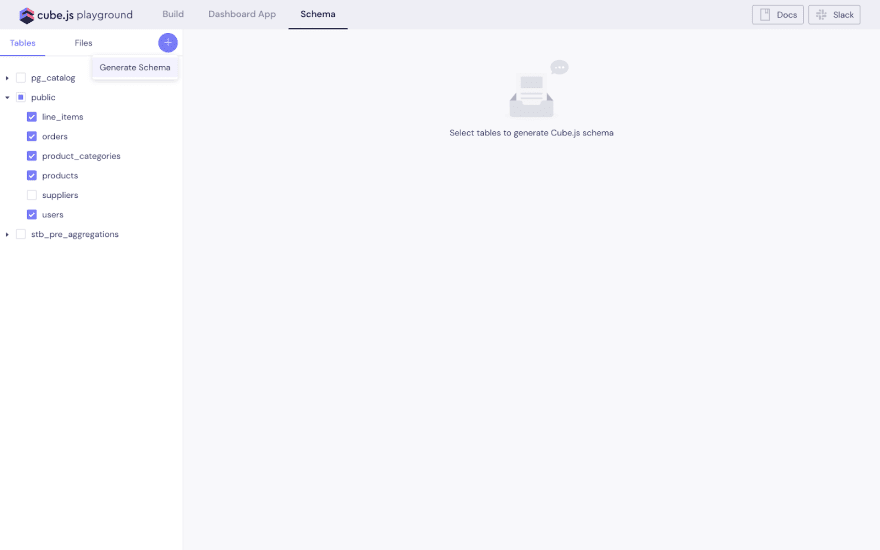
The next step is to create a Cube.js data schema. Cube.js uses the data schema to generate SQL, which will be executed in your database. Cube.js Playground can generate simple schemas based on the database’s tables. Let’s navigate to the Schema page and generate the schemas we need for our dashboard. Select the line_items, orders, products, product_categories, and users tables and click Generate Schema.
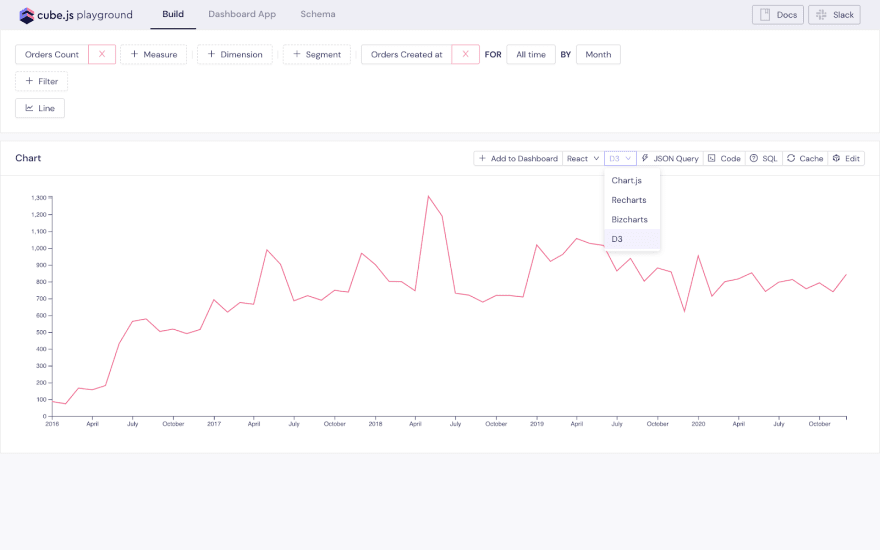
Let’s test our newly generated schema. Go to the Build page and select a measure in the dropdown. You should be able to see a simple line chart. You can choose D3 from the charting library dropdown to see an example of a D3 visualization. Note that it is just an example and you can always customize and expand it. 
Now, let’s make some updates to our schema. The schema generation makes it easy to get started and test the dataset, but for real-world use cases, we almost always need to make manual changes.
In the schema, we define measures and dimensions and how they map into SQL queries. You can find extensive documentation about data schema here. We’re going to add a priceRange dimension to the Orders cube. It will indicate whether the total price of the order falls into one of the buckets: “$0 - $100”, “$100 - $200”, “$200+”.
To do this, we first need to define a price dimension for the order. In our database, orders don’t have a price column, but we can calculate it based on the total price of the line_items inside the order. Our schema has already automatically indicated and defined a relationship between the Orders and LineTimes cubes. You can read more about joins here.
xxxxxxxxxx
// You can check the belongsTo join
// to the Orders cube inside the LineItems cube
joins: {
Orders: {
sql: `${CUBE}.order_id = ${Orders}.id`,
relationship: `belongsTo`
}
}
The LineItems cube has price measure with a sum type. We can reference this measure from the Orders cube as a dimension, and it will give us the sum of all the line items that belong to that order. It’s called a subQuery dimension; you can learn more about it here.
xxxxxxxxxx
// Add the following dimension to the Orders cube
price: {
sql: `${LineItems.price}`,
subQuery: true,
type: `number`,
format: `currency`
}
Now, based on this dimension, we can create a priceRange dimension. We’ll use a case statement to define a conditional logic for our price buckets.
// Add the following dimension to the Orders cube
priceRange: {
type: `string`,
case: {
when: [
{ sql: `${price} < 101`, label: `$0 - $100` },
{ sql: `${price} < 201`, label: `$100 - $200` }
],
else: {
label: `$200+`
}
}
}
Let’s try our newly created dimension! Go to the Build page in the playground, select the Orders count measure with the Orders price range dimension. You can always check the generated SQL by clicking the SQL button on the control bar.
That’s it for the backend! In the next part, we’ll look closer at how to render the results of our queries with D3.
Rendering Chart With D3.js
Now, as we can build our first chart, let’s inspect the example code playground uses to render it with the D3. Before that, we need to understand how Cube.js accepts and processes a query and returns the result back.
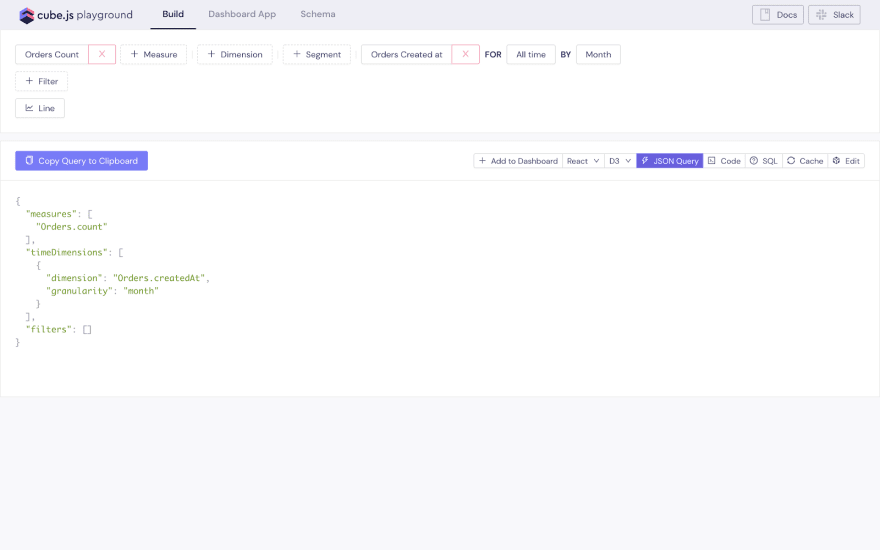
A Cube.js query is a simple JSON object containing several properties. The main properties of the query are measures, dimensions, timeDimensions, and filters. You can learn more about the Cube.js JSON query format and its properties here. You can always inspect the JSON query in the playground by clicking the JSON Query button next to the chart selector.
The Cube.js backend accepts this query and then uses it and the schema we created earlier to generate an SQL query. This SQL query will be executed in our database and the result will be sent back to the client.
Although Cube.js can be queried via a plain HTTP REST API, we’re going to use the Cube.js JavaScript client library. Among other things, it provides useful tools to process the data after it has been returned from the backend.
Once the data is loaded, the Cube.js client creates a ResultSet object, which provides a set of methods to access and manipulate the data. We’re going to use two of them now: ResultSet.series and ResultSet.chartPivot. You can learn about all the features of the Cube.js client library in the docs.
The ResultSet.series method returns an array of data series with key, title, and series data. The method accepts one argument, pivotConfig. It is an object, containing rules about how the data should be pivoted; we’ll talk about it a bit. In a line chart, each series is usually represented by a separate line. This method is useful for preparing data in the format expected by D3.
xxxxxxxxxx
// For query
{
measures: ['Stories.count'],
timeDimensions: [{
dimension: 'Stories.time',
dateRange: ['2015-01-01', '2015-12-31'],
granularity: 'month'
}]
}
// ResultSet.series() will return
[
{
"key":"Stories.count",
"title": "Stories Count",
"series": [
{ "x":"2015-01-01T00:00:00", "value": 27120 },
{ "x":"2015-02-01T00:00:00", "value": 25861 },
{ "x": "2015-03-01T00:00:00", "value": 29661 },
//...
]
}
]
The next method we need is ResultSet.chartPivot. It accepts the same pivotConfig argument and returns an array of data with values for the X-axis and for every series we have.
xxxxxxxxxx
// For query
{
measures: ['Stories.count'],
timeDimensions: [{
dimension: 'Stories.time',
dateRange: ['2015-01-01', '2015-12-31'],
granularity: 'month'
}]
}
// ResultSet.chartPivot() will return
[
{ "x":"2015-01-01T00:00:00", "Stories.count": 27120 },
{ "x":"2015-02-01T00:00:00", "Stories.count": 25861 },
{ "x": "2015-03-01T00:00:00", "Stories.count": 29661 },
//...
]
As mentioned above, the pivotConfig argument is an object used to control how to transform, or pivot, data. The object has two properties: x and y, both are arrays. By adding measures or dimensions to one of them, you can control what goes to the X-axis and what goes to the Y-axis. For a query with one measure and one timeDimension, pivotConfig has the following default value:
xxxxxxxxxx
{
x: `CubeName.myTimeDimension.granularity`,
y: `measures`
}
Here, "measures" is a special value, meaning that all the measures should go to the Y-axis. In most cases, the default value of the pivotConfig should work fine. In the next part, I’ll show you when and how we need to change it.
Now, let’s look at the frontend code playground generates when we select a D3 chart. Select a measure in the playground and change the visualization type to the D3. Next, click the Code button to inspect the frontend code to render the chart.
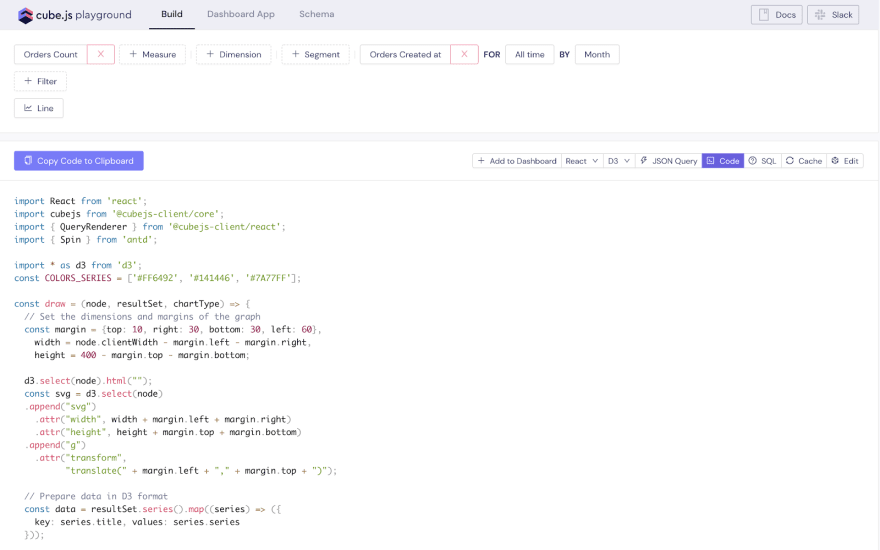
Here is the full source code from that page:
xxxxxxxxxx
import React from 'react';
import cubejs from '@cubejs-client/core';
import { QueryRenderer } from '@cubejs-client/react';
import { Spin } from 'antd';
import * as d3 from 'd3';
const COLORS_SERIES = ['#FF6492', '#141446', '#7A77FF'];
const draw = (node, resultSet, chartType) => {
// Set the dimensions and margins of the graph
const margin = {top: 10, right: 30, bottom: 30, left: 60},
width = node.clientWidth - margin.left - margin.right,
height = 400 - margin.top - margin.bottom;
d3.select(node).html("");
const svg = d3.select(node)
.append("svg")
.attr("width", width + margin.left + margin.right)
.attr("height", height + margin.top + margin.bottom)
.append("g")
.attr("transform",
"translate(" + margin.left + "," + margin.top + ")");
// Prepare data in D3 format
const data = resultSet.series().map((series) => ({
key: series.title, values: series.series
}));
// color palette
const color = d3.scaleOrdinal()
.domain(data.map(d => d.key ))
.range(COLORS_SERIES)
// Add X axis
const x = d3.scaleTime()
.domain(d3.extent(resultSet.chartPivot(), c => d3.isoParse(c.x)))
.range([ 0, width ]);
svg.append("g")
.attr("transform", "translate(0," + height + ")")
.call(d3.axisBottom(x));
// Add Y axis
const y = d3.scaleLinear()
.domain([0, d3.max(data.map((s) => d3.max(s.values, (i) => i.value)))])
.range([ height, 0 ]);
svg.append("g")
.call(d3.axisLeft(y));
// Draw the lines
svg.selectAll(".line")
.data(data)
.enter()
.append("path")
.attr("fill", "none")
.attr("stroke", d => color(d.key))
.attr("stroke-width", 1.5)
.attr("d", (d) => {
return d3.line()
.x(d => x(d3.isoParse(d.x)))
.y(d => y(+d.value))
(d.values)
})
}
const lineRender = ({ resultSet }) => (
<div ref={el => el && draw(el, resultSet, 'line')} />
)
const API_URL = "http://localhost:4000"; // change to your actual endpoint
const cubejsApi = cubejs(
"eyJhbGciOiJIUzI1NiIsInR5cCI6IkpXVCJ9.eyJpYXQiOjE1NzkwMjU0ODcsImV4cCI6MTU3OTExMTg4N30.nUyJ4AEsNk9ks9C8OwGPCHrcTXyJtqJxm02df7RGnQU",
{ apiUrl: API_URL + "/cubejs-api/v1" }
);
const renderChart = (Component) => ({ resultSet, error }) => (
(resultSet && <Component resultSet={resultSet} />) ||
(error && error.toString()) ||
(<Spin />)
)
const ChartRenderer = () => <QueryRenderer
query={{
"measures": [
"Orders.count"
],
"timeDimensions": [
{
"dimension": "Orders.createdAt",
"granularity": "month"
}
],
"filters": []
}}
cubejsApi={cubejsApi}
render={renderChart(lineRender)}
/>;
export default ChartRenderer;
The React component that renders the chart is just a single line wrapping a draw function, which does the entire job.
xxxxxxxxxx
const lineRender = ({ resultSet }) => (
<div ref={el => el && draw(el, resultSet, 'line')} />
)
There is a lot going on in this draw function. Although it renders a chart already, think about it as an example and a good starting point for customization. As we’ll work on our own dashboard in the next part, I’ll show you how to do it.
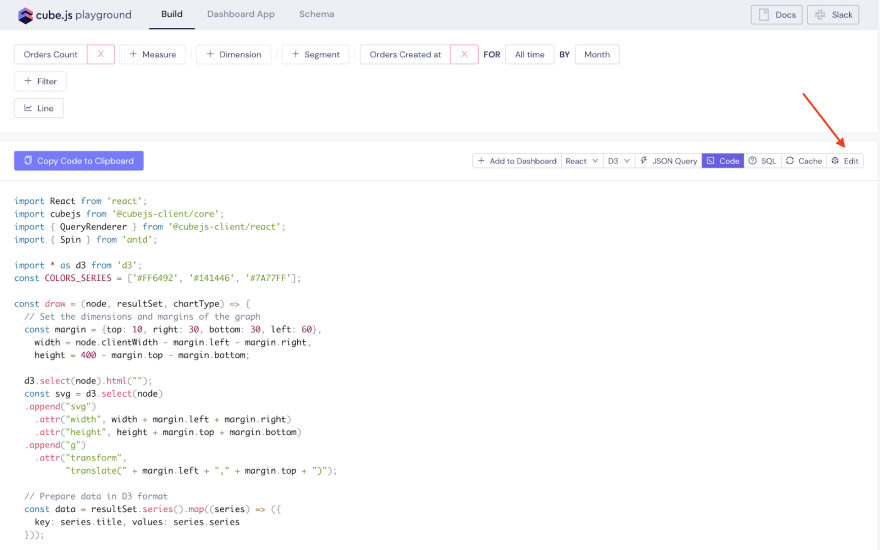
Feel free to click the Edit button and play around with the code in Code Sandbox.
Building a Frontend Dashboard
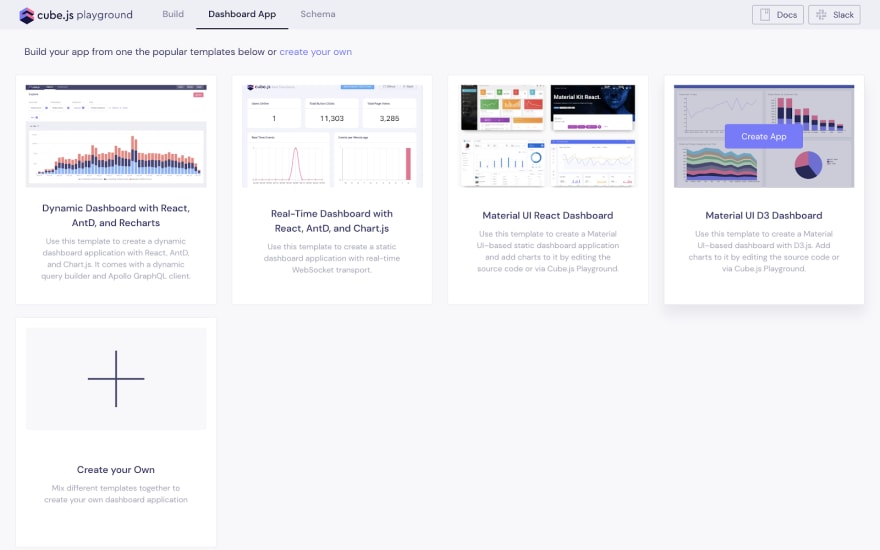
Now, we are ready to build our frontend application. We’re going to use Cube.js Templates, which is a scaffolding engine for quickly creating frontend applications configured to work with the Cube.js backend. It provides a selection of different frontend frameworks, UI kits, and charting libraries to mix together. We’ll pick React, Material UI, and D3.js. Let’s navigate to the Dashboard App tab and create a new dashboard application.
It could take several minutes to generate an app and install all the dependencies. Once it is done, you will have a dashboard-app folder inside your Cube.js project folder. To start a frontend application, either go to the “Dashboard App” tab in the playground and hit the “Start” button, or run the following command inside the dashboard-app folder:
xxxxxxxxxx
$ npm start
Make sure the Cube.js backend process is up and running since our frontend application uses its API. The frontend application is running on http://localhost:3000. If you open it in your browser, you should be able to see an empty dashboard.
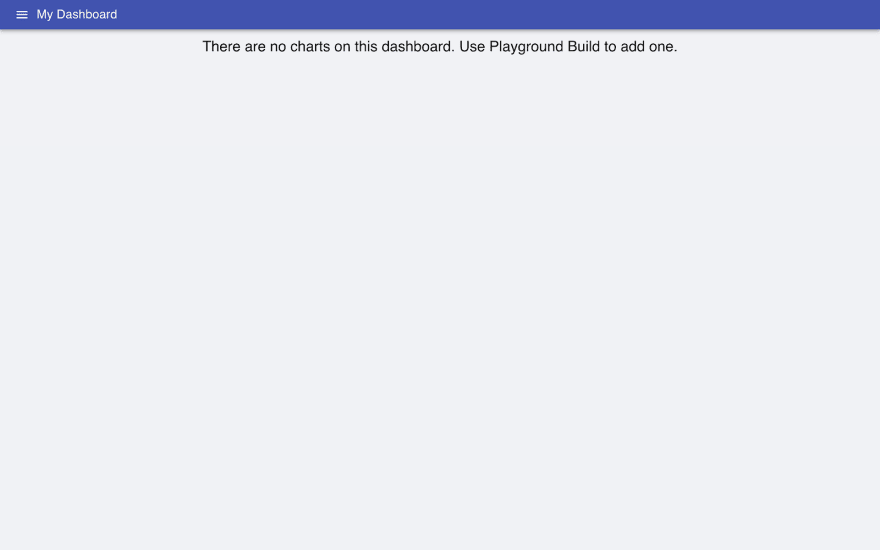
To add a chart to the dashboard, we can either build it in the playground and click the add to dashboard button or edit the src/pages/DashboardPage.js file in the dashboard-app folder. Let’s go with the latter option. Among other things, this file declares the DashboardItems variable, which is an array of queries for charts.
Edit dashboard-app/src/pages/DashboardPage.js to add charts to the dashboard.
xxxxxxxxxx
-const DashboardItems = [];
+const DashboardItems = [
+ {
+ id: 0,
+ name: "Orders last 14 days",
+ vizState: {
+ query: {
+ measures: ["Orders.count"],
+ timeDimensions: [
+ {
+ dimension: "Orders.createdAt",
+ granularity: "day",
+ dateRange: "last 14 days"
+ }
+ ],
+ filters: []
+ },
+ chartType: "line"
+ }
+ },
+ {
+ id: 1,
+ name: "Orders Status by Customers City",
+ vizState: {
+ query: {
+ measures: ["Orders.count"],
+ dimensions: ["Users.city", "Orders.status"],
+ timeDimensions: [
+ {
+ dimension: "Orders.createdAt",
+ dateRange: "last year"
+ }
+ ]
+ },
+ chartType: "bar",
+ pivotConfig: {
+ x: ["Users.city"],
+ y: ["Orders.status", "measures"]
+ }
+ }
+ },
+ {
+ id: 3,
+ name: "Orders by Product Categories Over Time",
+ vizState: {
+ query: {
+ measures: ["Orders.count"],
+ timeDimensions: [
+ {
+ dimension: "Orders.createdAt",
+ granularity: "month",
+ dateRange: "last year"
+ }
+ ],
+ dimensions: ["ProductCategories.name"]
+ },
+ chartType: "area"
+ }
+ },
+ {
+ id: 3,
+ name: "Orders by Price Range",
+ vizState: {
+ query: {
+ measures: ["Orders.count"],
+ filters: [
+ {
+ "dimension": "Orders.price",
+ "operator": "set"
+ }
+ ],
+ dimensions: ["Orders.priceRange"]
+ },
+ chartType: "pie"
+ }
+ }
+];
As you can see above, we’ve just added an array of Cube.js query objects.
If you refresh the dashboard, you should be able to see your charts!

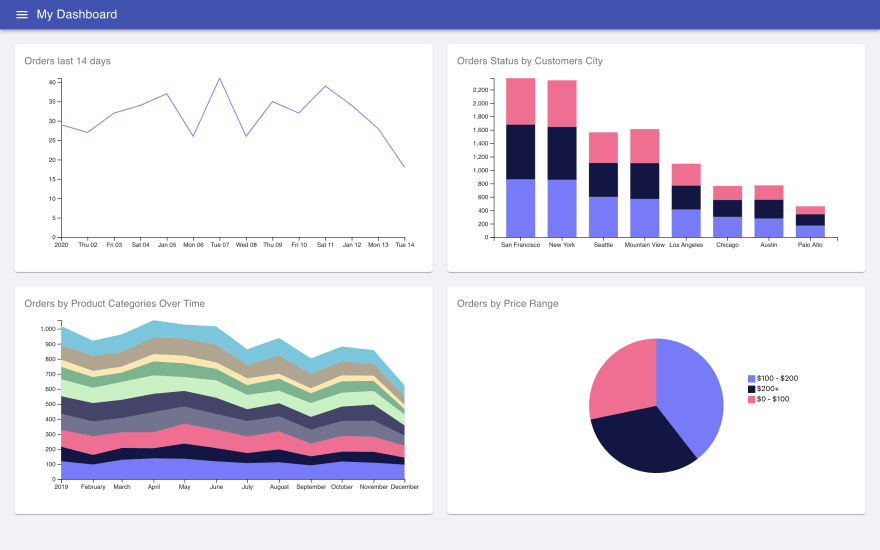
You can notice that one of our queries has the pivotConfig defined as the following:
xxxxxxxxxx
pivotConfig: {
x: ["Users.city"],
y: ["Orders.status", "measures"]
}
As I mentioned in the previous section, the default value for the pivotConfig usually works fine, but in some cases, like this one, we need to adjust it to get the desired result. We want to plot a bar chart here with the cities on the X-Axis and the number of orders on the Y-Axis grouped by the orders' statuses. That is exactly what we are passing here in the pivotConfig: Users.city to the X-Axis and measures with Orders.status to the Y-axis to get the grouped result.
To customize the rendering of the charts, you can edit the dashboard-app/src/pages/ChartRenderer.js file. It should look familiar to what we saw in the previous part.
You can check the online demo of this dashboard here and the complete source code of the example app is available on Github.
Congratulations on completing this guide!
I’d love to hear from you about your experience following this tutorial. Please send any comments or feedback you might have here in the comments or in this Slack Community. Thank you and I hope you found this guide helpful!
Further Reading
Published at DZone with permission of Artyom Keydunov. See the original article here.
Opinions expressed by DZone contributors are their own.
Comments