Optimizing Databricks Spark Pipelines Using Declarative Patterns
This article explains why hand-tuning Spark is becoming the slow path — and what the declarative alternatives actually look like in production.
Join the DZone community and get the full member experience.
Join For FreeIf you've ever inherited a Spark job that runs in 35 minutes and someone asks you to make it faster, you know the routine. You start by checking partition counts, then file sizes, then shuffle stages, then broadcast hints. You find a handwritten OPTIMIZE schedule from 2022, a Z-ORDER on the wrong column, and a cluster sized for last year's data volume.
By the time you've made the job fast, you've absorbed three new things to maintain. The next person to inherit it will absorb four. This pattern — call it the hand-tuning treadmill — is what the declarative optimization story on Databricks is trying to break. It's not a single feature; it's a cluster of capabilities that collectively let teams describe what a table should look like and let the engine handle the physical optimizations.
What follows is the practical view of those patterns: where they fit, what they replace, and how to migrate without a rewrite weekend.
1. The Hand-Tuning Treadmill: Why Imperative Optimization Doesn't Scale
Before getting into the declarative side, it's worth being concrete about what "imperative Spark optimization" actually means in production. The shape is consistent across teams I've audited:
- Layout decisions frozen on day one. Somebody picks a partition column when the table is created. The data shape changes a year later. Nobody re-partitions because the migration is scary. Query plans drift toward full scans.
- Maintenance jobs that nobody owns. An OPTIMIZE / Z-ORDER / VACUUM script lives in a notebook scheduled at 3 AM. It runs on a cluster that's slightly mis-sized. When data volume grows, the job runs into the morning workload, and people complain about latency.
- Cluster sizing as a guess. Worker count is a heuristic from a senior engineer's memory of last year's spike. Half the time it's too big, half the time it's too small, and the cost discussion gets emotional.
- Hint-driven plans. Broadcast hints, repartition hints, coalesce (N) — sprinkled through pipelines to fix yesterday's problem, kept indefinitely because removing them feels risky.
None of these are bugs. They're symptoms of the imperative model: the team owns the layout, the maintenance, the sizing, and the plan tuning. In small pipelines, ownership is fine. At scale, it becomes the bottleneck that the team can't outsource.
2. What "Declarative" Means in the Spark Optimization Context
Declarative is a word that gets used in two different ways here, and it's worth pulling them apart. Within Lakeflow pipelines (formerly DLT), it means "describe the tables, not the steps" — the engine builds the DAG and runs it. But in the broader optimization story, declarative also means "describe the desired property of the table or workload, not the operations to maintain it":
- Layout: I want this table clustered by these columns; figure out when and how to re-cluster.
- Maintenance: I want this table optimized and vacuumed; figure out the schedule.
- Ingestion: I want all new files in this path picked up exactly once; figure out checkpointing and listing.
- Quality: These rows must satisfy these expectations; enforce them and report what gets dropped.
- Compute: I want this query fast and not wasteful; size and scale appropriately.
Each one of those bullets corresponds to a piece of the declarative stack. Used together, they replace a remarkable amount of the boilerplate that has historically lived in Spark pipelines.
The mental shift: You stop writing operations against the table and start writing properties of the table. The engine becomes the actor; you become the editor.
3. The Declarative Optimization Stack on Databricks
The chart below maps each thing the team declares to the engine capability that handles it, ending at the physical Delta table. It's the picture I draw on whiteboards when teams ask, "What's the order to adopt these in?"
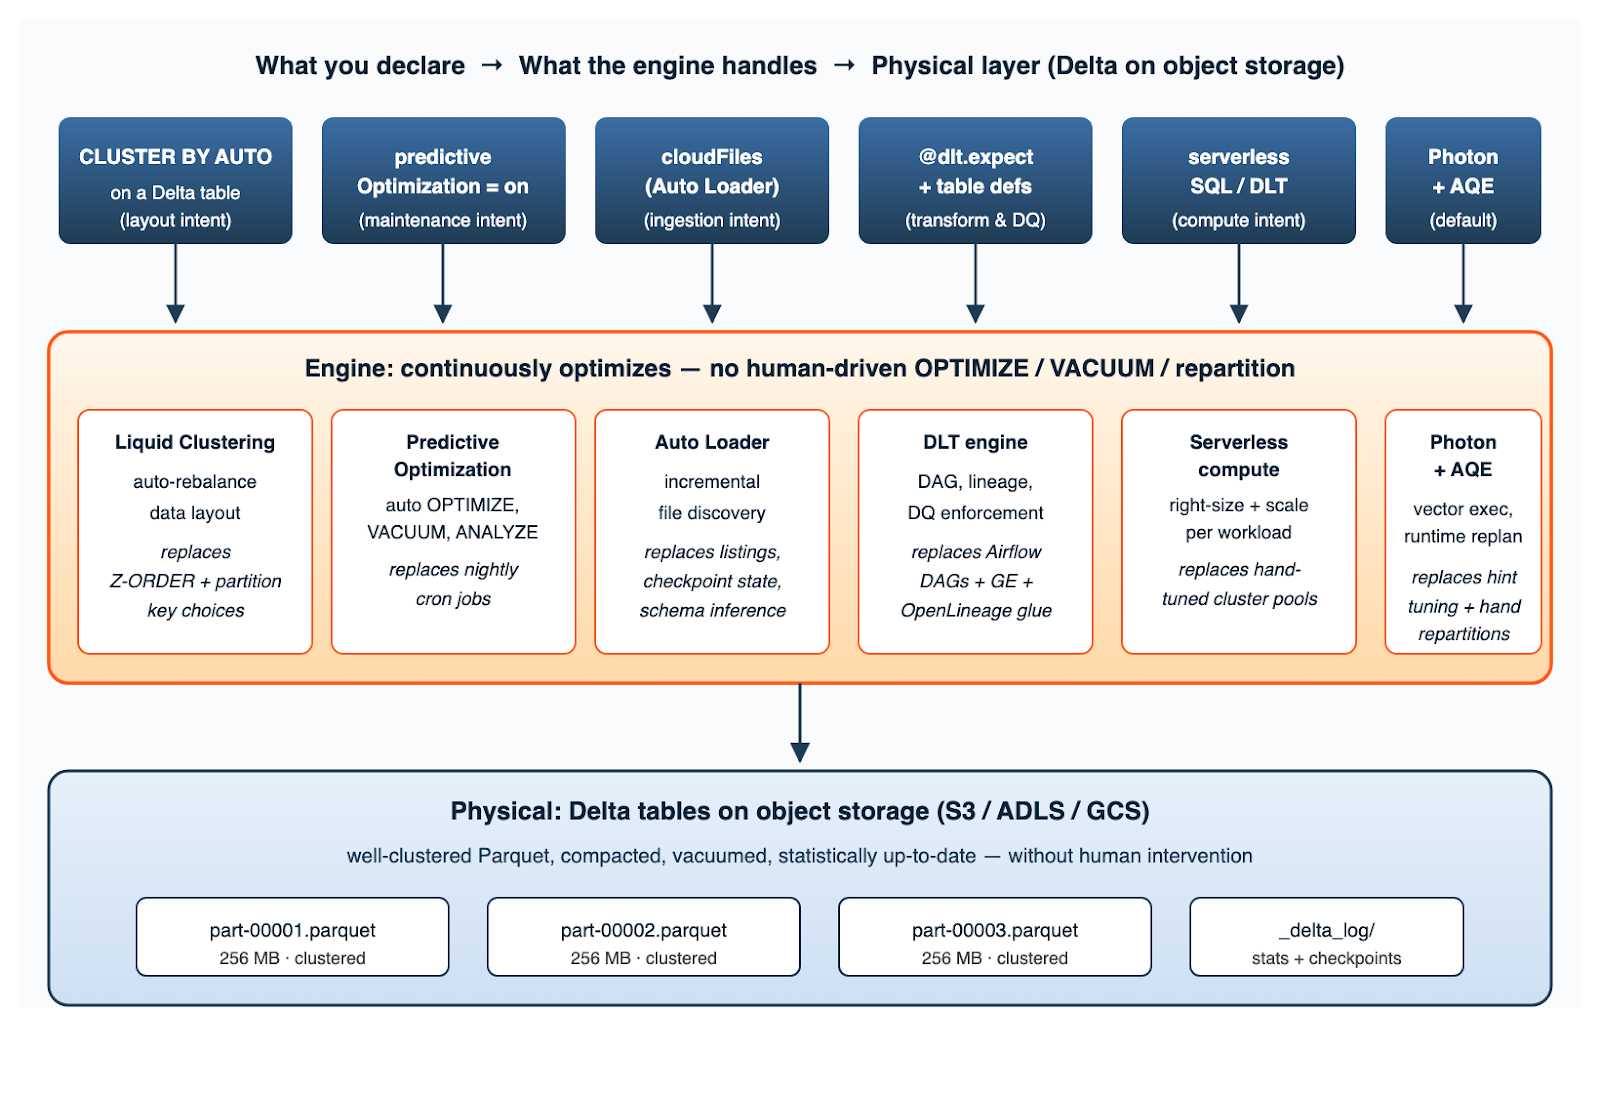
Figure 1. The declarative optimization stack: each user-facing intent at the top maps to a continuous engine behavior, which keeps the underlying Delta tables well-clustered, compacted, and statistically up-to-date — without human intervention.
Two things are worth highlighting in this picture. First, every box in the engine row is something that runs continuously, not on a cron — there is no daily "optimization window" anymore. Second, the bottom layer is identical to what you'd get from any well-tuned imperative pipeline: 256 MB Parquet files with current statistics. The declarative path doesn't change what good looks like; it changes who does the work to keep things looking good.
4. Layout: Liquid Clustering Replaces Hand-Maintained Z-ORDER
Liquid Clustering is the change with the largest practical impact, because partition-key choices are where most lakehouse pipelines accumulate the most technical debt. The declarative version: you specify the columns the data is most often filtered or joined by, and the engine maintains a layout that supports those access patterns — incrementally, as new data arrives, without a full rewrite.
When access patterns change, you change the cluster columns, and the engine re-clusters in the background.
Defining Liquid-Clustered Tables
-- New table, clustered by the columns most commonly filtered on.
-- No more PARTITIONED BY, no more guessing at partition cardinality.
CREATE TABLE prod.gold.daily_totals (
    account_id     STRING,
    region         STRING,
    ingest_date    DATE,
    daily_total    DECIMAL(18,2),
    txn_count      BIGINT
)
USING DELTA
CLUSTER BY (region, ingest_date, account_id);

-- Even better: let the engine pick the clustering columns by
-- observing real query patterns over time.
CREATE TABLE prod.gold.events_clustered
USING DELTA
CLUSTER BY AUTO
AS SELECT * FROM prod.silver.events;
Migrating an Existing Partitioned/Z-ORDER Table
-- Convert a legacy partitioned table to liquid clustering.
-- Existing data files are not rewritten immediately; the engine
-- rebalances incrementally on subsequent writes + maintenance.
ALTER TABLE prod.silver.transactions
CLUSTER BY (account_id, ingest_date);

-- Force the first clustering pass for a freshly converted table
OPTIMIZE prod.silver.transactions FULL;
Why this matters: the recurring 2 AM Slack thread of "can we re-partition this table?" goes away. Layout becomes a property you change with one DDL statement, not a multi-week rewrite project.
5. Maintenance: Predictive Optimization Replaces Cron-Driven OPTIMIZE/VACUUM
Predictive optimization is the part that retired the most legacy code in the pipelines I've migrated. Once enabled at the catalog or schema level, the engine monitors each table's read and write patterns and decides on its own when to compact files, re-cluster, vacuum, and refresh statistics.
The big win isn't the operations themselves — the imperative pipeline could already run those — it's that the timing is observed-driven, not schedule-driven. Tables that get heavy ingestion get more frequent maintenance. Cold tables get left alone.
-- Turn it on at the catalog level once; new tables inherit.
ALTER CATALOG prod
  SET PREDICTIVE OPTIMIZATION = ENABLED;

-- Or at the schema level for a phased rollout
ALTER SCHEMA prod.gold
  SET PREDICTIVE OPTIMIZATION = ENABLED;

-- Inspect what the engine has been doing on a given table
SELECT  operation,
        operation_metrics.numFilesAdded     AS files_added,
        operation_metrics.numFilesRemoved   AS files_removed,
        operation_metrics.numOutputBytes    AS output_bytes,
        timestamp
FROM    (DESCRIBE HISTORY prod.gold.daily_totals)
WHERE   userMetadata IS NULL          -- engine-driven, not user
  AND   operation IN ('OPTIMIZE', 'VACUUM')
  AND   timestamp >= current_timestamp() - INTERVAL 7 DAYS
ORDER BY timestamp DESC;
What you should delete after enabling this: the nightly notebook that runs OPTIMIZE on every table in a schema, the VACUUM cron job, the ANALYZE TABLE wrapper, and the alerting that wakes someone up when those jobs run long. None of them are needed anymore, and leaving them on creates duplicate work that the engine and the cron will fight over.
6. Ingestion: Auto Loader Replaces Listing-Based File Detection
Auto Loader is the declarative answer to the perennial "which files have we processed already?" problem. Instead of listing a directory, comparing it to a state file, and figuring out the new bits, you describe the source location and the format and let the engine maintain its own incremental state. It uses cloud-native event notifications (S3 events, ADLS notifications, or efficient directory listing as a fallback), and the checkpoint is just another piece of state the engine owns.
from pyspark.sql.functions import current_timestamp

# Streaming ingest from S3 with schema inference + evolution.
# Replaces hand-maintained checkpointing, listing logic, and
# whatever file-tracking table the team built two years ago.
(spark.readStream
      .format("cloudFiles")
      .option("cloudFiles.format", "json")
      .option("cloudFiles.inferColumnTypes", "true")
      .option("cloudFiles.schemaLocation",
              "s3://acme-checkpoints/txns_schema")
      .option("cloudFiles.schemaEvolutionMode", "addNewColumns")
      .load("s3://landing/txns/")
      .withColumn("_ingest_ts", current_timestamp())
 .writeStream
      .format("delta")
      .option("checkpointLocation",
              "s3://acme-checkpoints/txns_writer")
      .trigger(availableNow=True)   # batch-style; runs to completion
.toTable("prod.bronze.txns"))
Two notes from production. First, schemaEvolutionMode is the option that prevents the silent-data-loss class of bugs when partner schemas change; pick the policy explicitly rather than letting it default. Second, trigger(availableNow=True) gives you batch ergonomics on a streaming source — the job runs until it has consumed everything and exits, which is what most teams actually want for daily ingestion.
7. Transforms and Quality: Declarative Pipelines Replace Bare Spark + External DQ
The final piece is the transformation layer. Lakeflow pipelines (the rebrand of Delta Live Tables) let you declare each table as a Python or SQL definition, and add expectations as a first-class concept. The engine derives the DAG from the dependencies and enforces the expectations on every write — the data quality framework, the lineage layer, and the orchestration glue collapse into a single artifact.
import dlt
from pyspark.sql.functions import sum as _sum, col

@dlt.table(
name="silver_txns",
table_properties={
"delta.enableChangeDataFeed": "true",
"delta.tuneFileSizesForRewrites": "true",
},
cluster_by=["account_id", "ingest_date"],
)
@dlt.expect_or_drop("non_null_amount", "amount IS NOT NULL")
@dlt.expect_or_fail("valid_currency", "currency IN ('USD','EUR','GBP')")
@dlt.expect("unique_txn", "txn_id IS NOT NULL")
def silver_txns():
return (dlt.read_stream("bronze_txns")
.dropDuplicates(["txn_id"]))

@dlt.table(name="gold_daily_totals")
def gold_daily_totals():
return (dlt.read("silver_txns")
.groupBy("ingest_date", "account_id", "region")
.agg(_sum("amount").alias("daily_total")))
The decorators do four things at once: define the table, declare its layout (cluster_by), declare its quality rules, and let the engine infer that gold_daily_totals depends on silver_txns from the dlt.read call. There is no DAG file. There is no separate Great Expectations suite. Lineage is generated for free in Unity Catalog, including column-level edges. If you want to query how the expectations have been performing — useful for SLO dashboards or alerting — the event log surfaces it directly:
-- Pass / fail / drop counts per expectation, last 24 hours
SELECT flow_name,
details:flow_progress.data_quality.expectations[0].name AS exp_name,
details:flow_progress.data_quality.expectations[0].passed_records AS passed,
details:flow_progress.data_quality.expectations[0].failed_records AS failed,
details:flow_progress.data_quality.expectations[0].dropped_records AS dropped,
timestamp
FROM event_log("<pipeline-id>")
WHERE event_type = 'flow_progress'
AND timestamp >= current_timestamp() - INTERVAL 1 DAY
ORDER BY timestamp DESC;
8. Putting It Together: Where to Start, What to Measure
Adopting all of this at once is a recipe for pain. The order I've seen work, and a small set of metrics to verify the change is paying off:
|
Step |
Adopt |
Retire |
Verify with |
|---|---|---|---|
|
1 |
Predictive optimization at schema level |
Nightly OPTIMIZE / VACUUM jobs |
Reduction in maintenance-cluster cost |
|
2 |
Liquid clustering on top 5 tables |
Static partitioning + Z-ORDER |
p95 query latency on the same workloads |
|
3 |
Auto loader for 1-2 ingestion pipelines |
Custom file-tracking + listing logic |
End-to-end data freshness |
|
4 |
Lakeflow pipelines for new pipelines only |
External DQ + DAG glue (for new work) |
Lines of pipeline code per table |
|
5 |
Serverless compute for SQL warehouses + DLT |
Hand-sized job clusters |
Cost-per-query, scale-up time |
What you do not need to migrate: imperative pipelines that already work and aren't growing. Declarative patterns are about new work and high-pain hot spots, not a heroic rewrite of every notebook ever shipped.
9. Honest Limitations and Where Imperative Still Wins
Three places where the declarative model still bites — worth knowing before you commit:
- Procedural logic still belongs in Jobs. If your pipeline is really a sequence of API calls with branching error handling, that's a Lakeflow Job (or external code), not a declarative table. Don't try to bend dlt around it.
- Predictive optimization needs observation time. On a table that's a week old, the engine hasn't seen enough patterns to make great decisions. For tables under heavy initial load, an explicit OPTIMIZE FULL after the first big ingest still helps.
- Cluster-by-column choice still matters. CLUSTER BY AUTO is great for stable workloads with predictable filters. For tables whose access pattern is genuinely heterogeneous across teams, an explicit cluster-by based on the dominant query is usually faster.
- Hint-driven escapes are still allowed. If a particular query benefits from a /*+ BROADCAST(t) */ hint and AQE isn't catching it, the hint is fine. Just keep them rare and document why.
Conclusion
The declarative optimization story isn't a single feature you toggle — it's a quiet shift in who owns the boring parts of a Spark pipeline. Layout, maintenance, ingestion bookkeeping, plan tuning, cluster sizing, data quality enforcement: every one of those was traditionally a thing the team owned and paid for in toil.
The current Databricks stack lets you express each as an intent and let the engine handle the operations underneath. Adopt them in order, retire what they replace, and the optimization treadmill slows from a daily concern to a quarterly review. That's the actual win, and it's the reason the declarative paradigm has gone from a Lakeflow detail to the default mental model for new pipelines on Databricks.
Opinions expressed by DZone contributors are their own.
Comments