Different CPU Times: Unix/Linux ‘top’
Join the DZone community and get the full member experience.
Join For FreeCPU consumption in Unix/Linux operating systems is studied using eight different metrics: User CPU time, System CPU time, nice CPU time, Idle CPU time, Waiting CPU time, Hardware Interrupt CPU time, Software Interrupt CPU time, Stolen CPU time. Let’s review each of the CPU time in this article.
User CPU Time and System CPU Time
In order to understand ‘user’ CPU Time, one should understand ‘system’ CPU time as well, since they go hand in hand. User CPU time is the amount of time the processor spends in running your application code. System CPU Time is the amount of time the processor spends in running the operating system(i.e., kernel) functions connected to your application. Let’s say your application is manipulating the elements in an array; then, it will be accounted as ‘user’ CPU time. Let’s say your application is making network calls to external applications. To make network calls, it has to read/write data into socket buffers which is part of the operating system code. This will be accounted as ‘system’ CPU time. To learn how to resolve high ‘user’ CPU time, refer to this article. To learn how to resolve high ‘system’ CPU time, refer to this article.
Nice CPU Time
To understand ‘nice’ CPU time, one must first understand ‘nice’. When there is a CPU contention (i.e., multiple processes contend for CPU cycles), the process with high priority are given more chances to run. In Unix/Linux operating systems, processes are launched with a priority 0 (default). However, using the ‘nice’ command, super users (like ‘root’) can set the priority for the processes as shown below:
xxxxxxxxxx
nice -n nice_val [command]
Example:
nice -n 15 java -jar buggApp.jar
Priority can range from -20 to 19. -20 is the highest priority with which a process can be launched. 19 is the lowest priority. For more options on how to launch a process with nice priority or change the priority level using the renice command refer to this article.
‘nice CPU time’ is the amount of time the CPU spends running the low priority processes (whose nice values are greater than 0). To learn how to resolve high ‘nice’ CPU time, refer to this article.
Idle CPU Time
Idle CPU time is the amount of time the CPU was not busy. Idle time is typically used to measure the unused CPU capacity.
Many operating systems run a special task by name: ‘idle task’ on the CPU when there is nothing for the CPU to do. This idle task is implemented with the lowest possible priority. An advantage of this approach is that monitoring applications can keep track of this idle task along with other tasks. To learn more details about ‘idle’ CPU time refer to this article.
Waiting CPU Time
Waiting CPU time indicates the amount of time CPU is waiting for the disk I/O or network I/O operations to complete. High waiting time indicates that the CPU is *stranded* because of the I/O operations on that device. For optimal performance, one should aim to keep the I/O waiting CPU time as low as possible. If the waiting time is > 10% then it is worth investigating it.
You can visualize I/O waiting time through this analogy: Say there are hundreds of cars/bikes are waiting on a busy road for the traffic light to switch from ‘red’ to ‘green’. But due to some technical glitch, it takes a long time for the traffic light to switch from ‘red’ to ‘green’ — then those hundreds of cars/bikes would get stranded unnecessarily. It will result in several undesirable side effects: passengers will reach their destination late, drivers can get frustrated and start to horn (noise pollution) since engines are on fuel will be wasted (air pollution)… To learn how to resolve high ‘waiting’ CPU time, refer to this article.
Software Interrupt CPU Time
To understand the ‘software interrupt time’, one must understand ‘software interrupts’ first. Software interrupts can be triggered because of the following events:
a. When software programs run into an exceptional condition such as a divide by zero, accessing unavailable memory
b. When special Instruction in the application code causes an interrupt when the processor executes it
c. Some hardware interrupts might take a long time to complete. In such scenarios, hardware interrupts can be deferred to execute at a later point of time through software interrupts. Software interrupts can be scheduled to run independently or on any CPU in the device or even run concurrently. On the other hand, these flexibilities don’t exist in hardware interrupts.
The amount of time the CPU spends in processing, these software interrupt signals are called ‘Software interrupt time’. To learn how to resolve high ‘Software Interrupt’ CPU time, refer to this article.
Hardware Interrupt CPU Time
To understand ‘hardware interrupt time’, one must understand ‘hardware interrupts’ first. A hardware interrupt is an electronic alerting signal sent to the processor from an external device (like disk controller, network cards, keyboard controller, external timer, hardware sensors, ….) For example, when we press a key on the keyboard or move the mouse, they trigger ‘hardware interrupts which cause the processor to read the keystroke or mouse position.
The amount of time the CPU spends in processing these hardware interrupt signals is called ‘hardware interrupt time’. To learn how to resolve high ‘hardware interrupt’ CPU time, refer to this article.
Stolen CPU Time
‘Steal’ time (also known as ‘Stolen’ time) is relevant only in cloud environments (like AWS) or VMWare environments, where multiple virtual machines will be run on one underlying physical host. In such circumstances, CPU resources will be shared amongst the multiple virtual machines. The hypervisor is a technology that will distribute the underlying physical host’s CPU resources and other resources amongst the virtual machines.
Steal time (or stolen time) is the percentage of time a virtual machine CPU waits for a real CPU while the hypervisor is servicing other virtual machines. If Steal time is high on a particular virtual machine, it indicates that the virtual machine runs on an overloaded physical host. Companies like Netflix monitor the stolen CPU time closely. If it goes beyond a threshold, then the virtual machine will be shut down from that physical host and relaunched in another physical host. To learn how to resolve high stolen CPU time, refer to this article.
How to find all these CPU Times?
All these CPU time can be found from the following sources:
a. You can use web-based root cause analysis tools to report all these CPU times. It is capable of generating alerts if a CPU time goes beyond the threshold.
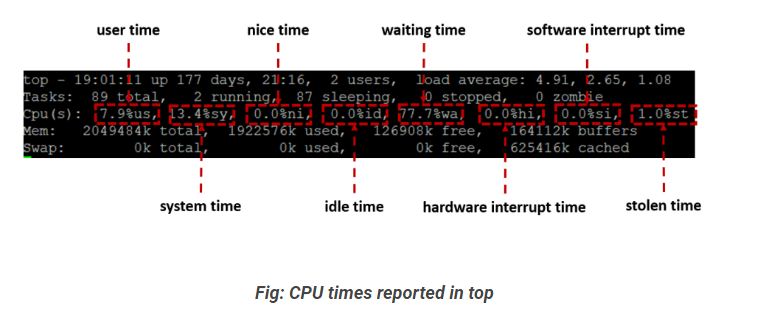
b. All these CPU times are also reported in the Unix/Linux command line tool ‘top’ as highlighted in the below image.
Opinions expressed by DZone contributors are their own.
Comments