Differentiating Response Times in JMeter With Embedded Resources
Learn how to differentiate response times in JMeter when embedded resources are retrieved. Note that doing this implies JMeter will use more resources for the simulation.
Join the DZone community and get the full member experience.
Join For FreeWhen load testing, we need our scripts to simulate real user behavior as accurately as possible. This includes getting HTML resources from the server. When you request a URL for a web page, the HTML resources can have different embedded elements — like images used in the page, JavaScripts that must execute certain code on the client side, and CSS files for adding style to our HTML elements. After receiving the request, the browser gets the HTML, parses it and retrieves all the embedded resources automatically with new HTTP requests.
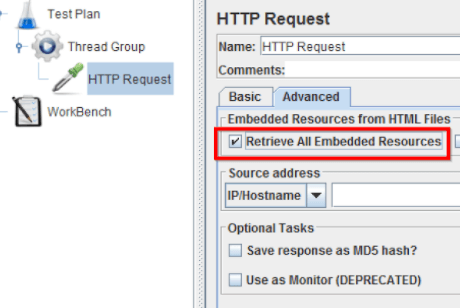
To make JMeter behave more like a browser that gets HTML, enable the Retrieve All Embedded Resources option.
In your Thread Group, right click > Sampler > HTTP Request > Advanced > Retrieve All Embedded Resources.

However, this might be a problem when measuring response time. It’s important to understand that the response time that JMeter shows for each HTTP request with the embedded resources enabled will include all requests — both the primary and the secondary ones that are triggered (embedded).
You don’t necessarily want to measure the embedded resources response times — for example, if you are using a CDN or third parties or you are interested in a certain endpoint.
So, how do we distinguish the response times corresponding to the main request and the embedded requests?
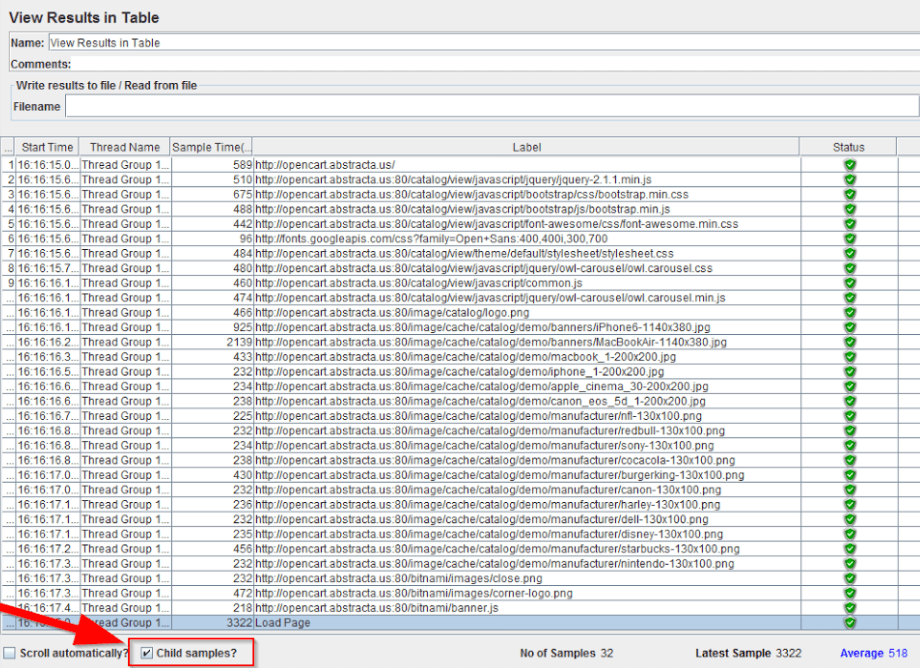
The solution is very simple. We just have to use the View Results in Table component. This listener shows individual response times of the requests, provided that we enable the option Child samples (see the image below).
This table in the screenshot below shows the response times not only for the main request to opencart.abstracta.us but also for all its embedded resources. We can see the response times in the column Sample Time in milliseconds. The first row corresponds to the main request and the last one corresponds to a Transaction Controller containing the HTTP Request sampler.

Through this listener, we can see the response time for the main request separately from the response time for each embedded resource.
But a new problem arises here. Have you noticed that the sum of the response times is larger than the response time registered by the Transaction Controller? Shouldn’t they be the same? What is the reason for the difference?
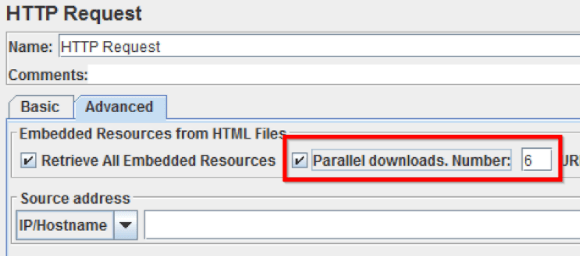
The answer is that the secondary requests are made in parallel threads. When we select the option Retrieve All Embedded Resources, there is another option next to that checkbox that allows us to set the number of parallel downloads, meaning the number of threads requesting the embedded resources.

As they are not sequential, the total response time is not equal to the sum of all the individual requests. This is an advantage for the user experience since the loading time for the web page is going to be shorter, as explained here. This is the main reason for simulating this aspect properly, but on the other hand, we shouldn’t forget that using this implies that JMeter is going to use more resources for the simulation (because it needs more threads, sockets, memory, and so on).
That’s it! You now know how to differentiate response times in JMeter when embedded resources are retrieved.
Published at DZone with permission of Federico Toledo, DZone MVB. See the original article here.
Opinions expressed by DZone contributors are their own.

Comments