Digital Experience Monitoring and Endpoint Posture Checks Usage in SASE
Learn how digital experience monitoring and endpoint posture checks integrate with SASE to enforce zero trust and ensure secure, reliable performance.
Join the DZone community and get the full member experience.
Join For FreeIn this article, I will go through the concepts of digital experience monitoring (DEM) and Endpoint Posture Checks and discuss how these essential capabilities are integrated into the SASE framework to enforce the zero trust principle. Together, these capabilities empower enterprises’ security and IT teams to maintain optimal performance, a strong security posture, and trust, regardless of where users connect.
Digital Experience Monitoring
Digital experience monitoring (DEM) helps to monitor and provide observability across the entire path. It delivers granular, real-time telemetry across endpoints, network paths, and application services, regardless of user location. In the past, enterprises that adopted cloud resources had to deploy various tools to monitor problems within cloud applications, network infrastructure, or on-premises devices, to provide a consistent user experience for hybrid and remote workforces.
As part of the zero tust model, SASE addresses this challenge by integrating DEM directly into its framework. With DEM IT and NOC teams to accurately identify performance degradation, whether at the device, WAN edge, or application layer, and quickly triage issues. This level of operational visibility significantly improves mean time to resolution (MTTR) and ensures a consistent digital user experience.
How Does DEM Work?
To provide comprehensive end-to-end performance visibility, digital experience monitoring (DEM) operates through a combination of endpoint monitoring, synthetic testing, and inline traffic inspection within the SASE fabric. Here's how DEM works across various layers of the user-to-application path.
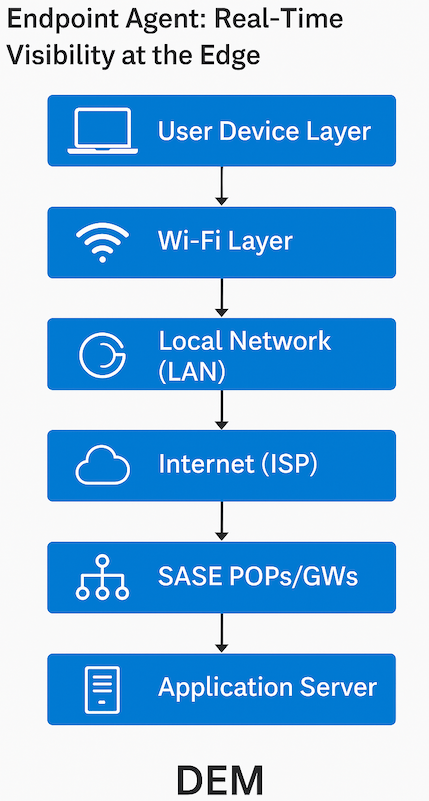
Endpoint Agent: Real-Time Visibility at the Edge
Digital experience monitoring (DEM) is enabled through an agent installed on the user’s device, typically a laptop or mobile device, to continuously monitor the user’s experience when accessing applications. The agent collects device-level performance data and sends synthetic probes (such as pings, traceroutes, HTTP GET requests, and TWAMP) to simulate user activity and measure network and application responsiveness. All collected metrics are forwarded to an analytics engine to pinpoint the source of performance degradation.
- User device layer
- The agent collects system-level metrics, including CPU usage, memory utilization, disk queue length, and battery health.
- The agent also performs real-user monitoring (RUM) in the background, capturing data from user interactions, including latency and website loading times.
- These metrics help determine whether performance issues are device-related or network-induced.
- WIFI layer
- The agent evaluates the Wi-Fi signal strength and link quality of the Wi-Fi connection. The logs collected at the analytics indicate if the signal strength is weak, and that users may need to move closer to the access point.
- The agent also gathers, transmits, and receives bandwidth information using telemetry from the driver’s Wi-Fi driver.
- Local Network (LAN)
- The connectivity issues between the user device and the local gateway are analyzed. Local network issues, such as packet loss, jitter, and latency, can occur from the client to the ISP.
- A ping/traceroute is sent to the next-hop gateway to identify the problems on the local network.
- Internet (ISP/Middle mile)
- The issues from the internet to the SASE gateway are identified by collecting performance metrics, including congestion, packet loss, jitter, and latency.
- The above metrics are derived from the results of pings, traceroutes, and TWAMP tests.
- SASE POPs/Gateways (last mile)
- The different issues related to SASE Fabric are identified at this layer. The following problems are identified at the SASE fabric layer.
- The network underlay issues include packet loss, jitter, latency, and congestion.
- System resources, such as CPU utilization, memory utilization, and disk corruption.
- Anomalies related to security policies that block data traffic.
- The different issues related to SASE Fabric are identified at this layer. The following problems are identified at the SASE fabric layer.
- Application Server
- A network issue from the POP/gateway to the application server is detected using ping, traceroute, or an HTTP GET request.
- High response times
- DNS lookup time – The duration taken by DNS to resolve the domain name to the app server IP address.
- TCP connect time – The duration required to complete the TCP handshake with the app’s web server.
- TLS/SSL handshake time – The duration required to complete the TLS/SSL handshake for HTTPS connectivity.
- Data transfer time – The duration required for data transfer.
- Time to first byte and last byte – Refers to the duration taken to receive the first or last byte of information after a request is made.
- The Application experience is scored based on the above-derived metrics.
Inspect and Monitor Across SASE Fabric In-Line Traffic
DEM can also be integrated into SASE traffic flows to provide real-time session-level insights across the entire network. DEM monitors all network or session traffic passing through the SASE Fabric, including TCP and UDP, to deliver real-time insights into user experience and how applications behave under various conditions. DEM inspects in-line traffic across the SASE fabric to extract the following metadata:
- SIP, DIP, SPort, and DPort
- Round-trip times
- Packet drops
- Application layer latency
Endpoint Agent: Real-Time Visibility Workflow
![Endpoint agent: real-time visibility workflow]()
What To Do With a Lot of DEM Data
DEM Insights
All the statistics, metrics, and logs from various stages are sent to Analytics. Analytics correlates this data and identifies the problem using these insights (DEM insights). For example, for a problem, Analytics would correlate,
- How many users are experiencing this problem?
- Suppose only a couple of users are experiencing a poor connection. In that case, the analytics will indicate that the problem is either with their local LAN or Wi-Fi layer or the device itself.
- If many users are experiencing the performance problem, are they all connecting to the same ISP?
- Are these users connecting to the same SASE PoP? The logs indicate that the analytics will show the problem is related to the underlay network, SASE PoP resource utilization, or that the path is optimal from the user to the SASE PoP.
- Are these users accessing the same application? The analytics will indicate whether users are accessing closer to their geolocation, or if the problem is congestion or application server resource utilization, which leads to high response times.
Benefits of DEM
Integrating DEM seamlessly into the SASE architecture provided significant benefits to enterprises.
- The IT and NOC teams can rely on DEM to provide insights into the root cause of the problem and its nature.
- Transitioning from reactive to proactive monitoring by consistently monitoring and alerting the appropriate teams.
- Offering clear insights shortens diagnostic time, resulting in quicker resolution of customer tickets.
- Deliver a consistent user experience and application performance for hybrid and remote workforces to enhance business outcomes.
AI-Powered DEM for Deeper Insights
AI-powered DEM can further optimize the digital experience for users, network infrastructure, and applications. DEM now shifts to a predictive and autonomous remediation action system paired with proactive monitoring. Leveraging historical data and continuous real-time monitoring of each point from the user to the application, an AI/ML-powered DEM system
- Baseline the expected behavior of each component. AI flags any potential performance degradation if any deviation from the baseline behavior is observed.
- Forecasts trends in performance degradation well in advance. Examples include packet loss, jitter, and latency along the paths of SASE PoPs, as well as Wi-Fi signal deterioration issues in certain areas, among others.
- The system triggers remediation steps if any problem is observed at any layer from the user to the application. For instance,
- If congestion is observed on the route to the SASE PoP from the user, the system can initiate a re-route to a better-performing path within the same PoP or transition the connection to a different SASE PoP.
- Provide the user with self-guided troubleshooting steps to resolve issues with their device, such as high CPU or memory utilization, or low battery health.
Endpoint Posture Check
As part of ZTNA enforcement, the endpoint posture checks are configured on the SASE gateways to protect corporate data and applications. Using endpoint posture checks, enterprises maintain security standards based on the postures of their entities. Enterprises assess endpoint security and health information against their standard guidelines to determine whether to allow or deny endpoint connections to the SASE network and access to corporate resources. Enterprises also know where users are connecting from and which devices they are using. When a user device attempts to connect to the SASE gateway to access enterprise resources, the Endpoint Posture Check collects metadata and contextual attributes regarding the device. The Client gathers the device's metadata during the registration process. The metadata includes
- Operating system and version: macOS Sequoia, Windows 11, Ubuntu 23.10, and more
- Device type: Laptop, mobile, or tablet.
- Device posture:
- Firewall
- Anti-malware
- Anti-virus software
- Disk encryption software
- Data Loss Prevention software
- Latest Patch updates
- Specific Approved Browsers
- User identity: User logged in through Active Directory (AD), LDAP, or Single Sign-On (SSO).
- Geo-aware: Time and location of the user login.
What Does the Enterprise Do With the Metadata and Attributes?
Enterprise administrators use the collected endpoint metadata and attributes to configure security policies and traffic steering profiles. Based on the information collected, user endpoints are either granted or denied access to the network. Further, a security policy is applied to access the enterprise applications or resources. Additionally, the SASE gateway continuously assesses the endpoint to stay informed of any changes in device posture after it connects. Examples,
- A user with Windows 11, Symantec anti-virus, and CrowdStrike software is allowed to connect to the SASE gateway. Additionally, users are permitted to access the corporate database and/or the SharePoint application.
- A user with Windows 11, Windows Defender, and CrowdStrike software is allowed to connect to the SASE gateway. After connecting, if Windows Defender is disabled, access to any enterprise resource is denied.
- A user with Windows 10 and Windows Defender is not allowed to connect to the SASE gateway because Windows 10 is not recognized as a standard enterprise operating system.
Conclusion
DEM and endpoint posture checks are essential features of an intelligent SASE architecture. These capabilities enable enterprises to shift from reactive to proactive monitoring and assurance.
- With DEM providing continuous, real-time visibility into user and device experiences. Additionally, they enable IT teams to detect and resolve issues before they affect the network.
- With endpoint posture checks, only trusted and compliant devices are granted access to the corporate network and applications. This way, enterprise networks are kept secure from compromised and non-compliant endpoints.
Opinions expressed by DZone contributors are their own.
Comments