DZone
Thanks for visiting DZone today,
Edit Profile
  • Manage Email Subscriptions
  • How to Post to DZone
  • Article Submission Guidelines
Sign Out View Profile
  • Post an Article
  • Manage My Drafts
Over 2 million developers have joined DZone.
Log In / Join
Refcards Trend Reports
Events Video Library
Refcards
Trend Reports

Events

View Events Video Library

Related

  • LLM: Trust, but Verify
  • Building a Unified API Using GraphQL Joins
  • What Is API-First?
  • Commonly Occurring Errors in Microsoft Graph Integrations and How To Troubleshoot Them (Part 4)

Trending

  • Detecting Bugs and Vulnerabilities in Java With SonarQube
  • 11 Agentic Testing Tools to Know in 2026
  • AI Agents in Java: Architecting Intelligent Health Data Systems
  • Bringing Intelligence Closer to the Source: Why Real-Time Processing is the Heart of Edge AI
  1. DZone
  2. Data Engineering
  3. Databases
  4. Discovering API Logs in Kibana

Discovering API Logs in Kibana

In this tutorial, see how to discover API logs in Kibana.

By 
Bhaskar Gara user avatar
Bhaskar Gara
·
Mar. 27, 20 · Tutorial
Likes (8)
Comment
Save
Tweet
Share
27.0K Views

Join the DZone community and get the full member experience.

Join For Free

In the IT world, one of the most challenging items is Monitoring. A 5-minute read out article shows you how to monitor or trace the API call in Kibana (https://www.elastic.co/kibana).

Once you log in to Kibana, there are 5 important sections:
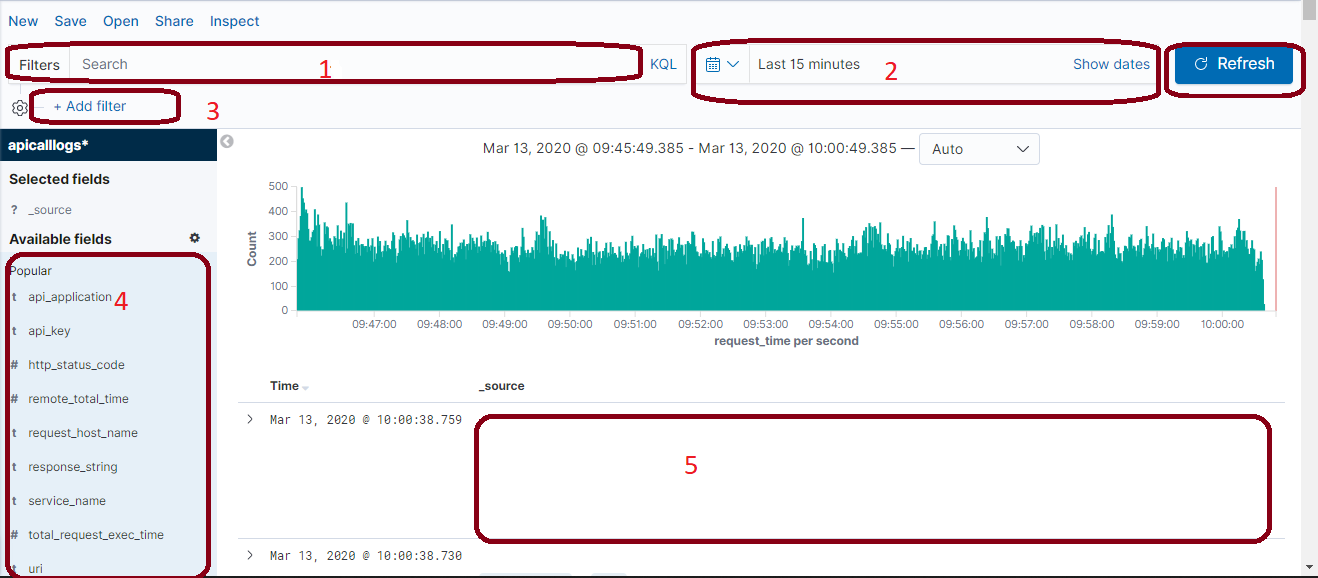

1. Filter: Enter your API URI  ex:  /rest/getstock


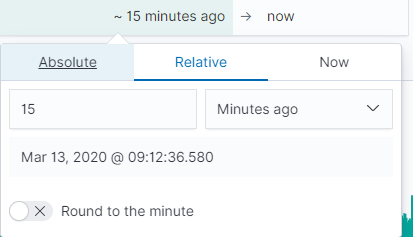
2. Filter by Time: Filter search to a particular time or date range.
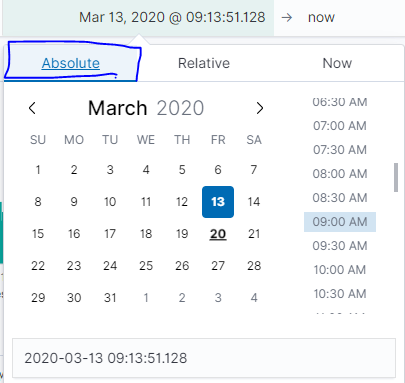

3. Add Filter


4. Different API Fields are useful for searching purposes.
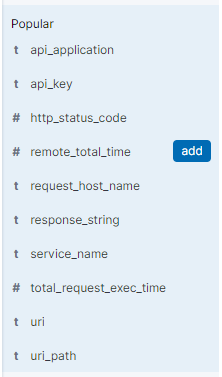

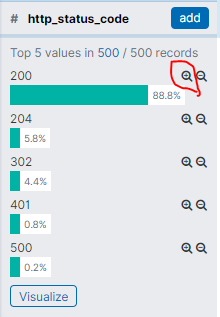
Usecase 1: Search by http_status code

  • Step 1: Select the correct time on the top right.
  • Step 2                                                                                                                                : Left pan select the "Http_status_code" and press "Search Icon". It will automatically be added to the Add Filter.

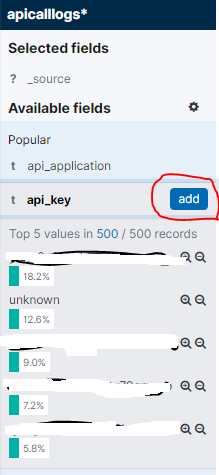
Use case 2: Search by API_KEY

  • Step 1: Select the correct time on the top right.
  • Step 2: Left pan select the "api_key" and press "Search Icon". It will automatically be added to the Add Filter.

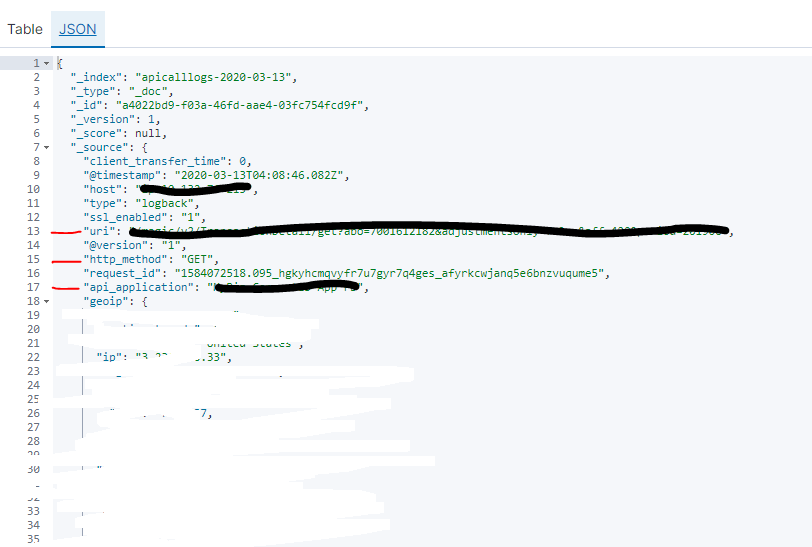
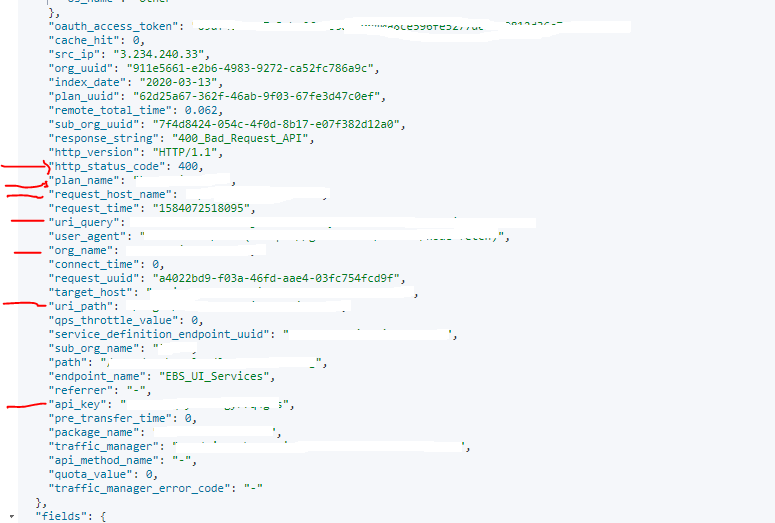
Use case 3: After setting all the filters needed, you want to check more details of the API:



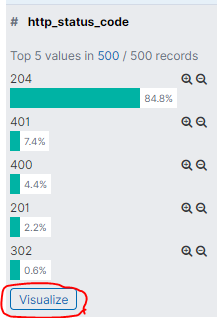
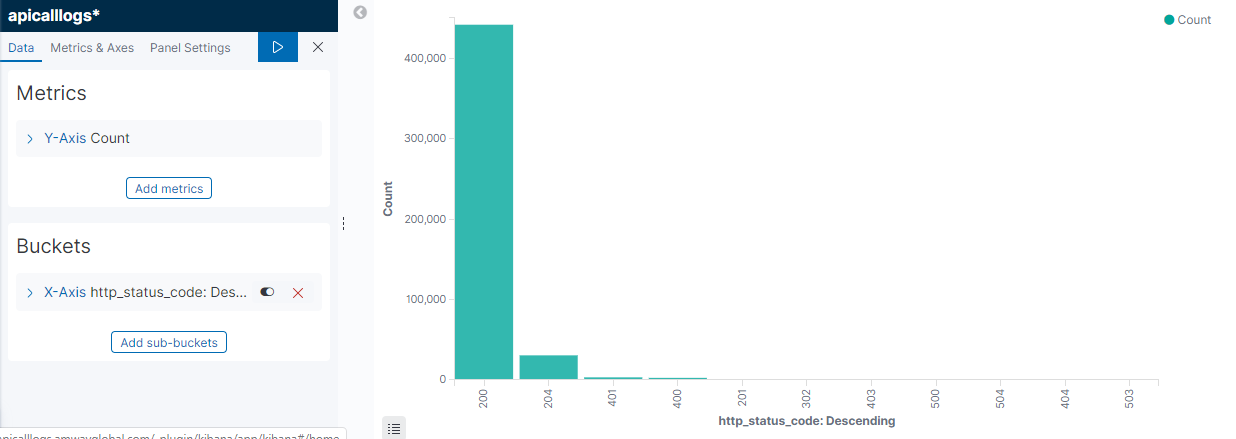
Use Case 4: Want to show a visual representation of the error code. Let select http_status_code from the left pan and press "Visualize"
Thank you for reading. I hope this helps.

API Kibana Use case

Opinions expressed by DZone contributors are their own.

Related

  • LLM: Trust, but Verify
  • Building a Unified API Using GraphQL Joins
  • What Is API-First?
  • Commonly Occurring Errors in Microsoft Graph Integrations and How To Troubleshoot Them (Part 4)

Partner Resources

×

Comments

The likes didn't load as expected. Please refresh the page and try again.

  • RSS
  • X
  • Facebook

ABOUT US

  • About DZone
  • Support and feedback
  • Community research

ADVERTISE

  • Advertise with DZone

CONTRIBUTE ON DZONE

  • Article Submission Guidelines
  • Become a Contributor
  • Core Program
  • Visit the Writers' Zone

LEGAL

  • Terms of Service
  • Privacy Policy

CONTACT US

  • 3343 Perimeter Hill Drive
  • Suite 215
  • Nashville, TN 37211
  • [email protected]

Let's be friends:

  • RSS
  • X
  • Facebook