Eclipse JTAG Debugging the ESP32 With a SEGGER J-Link
There *is* actually a way to use JTAG with the ESP32 devices.
Join the DZone community and get the full member experience.
Join For Free
When Espressif was released back in 2014, their first Wi-Fi ESP8266 transceiver, they took over at least the hobby market with their inexpensive wireless devices. Yet again, the successor ESP32 device is used in many projects.
Rightfully so, there are many other industrial Wi-Fi solutions, but Espressif opened up the door for Wi-Fi in many low-cost projects. Many projects use the ESP devices in an Arduino environment, which basically means decent debugging except using printf() style, which is … hmmm … better than nothing.
What is maybe not known to many ESP32 users: There *is* actually a way to use JTAG with the ESP32 devices. It requires some extra tools and setup, but with this, I have a decent Eclipse-based way to debug the code. And this is what this article is about: how to use a SEGGER J-Link with Eclipse and OpenOCD for JTAG debugging the ESP32.

Using that approach, I have the power of Eclipse and can debug my NXP Kinetis in real-time together with the Wi-Fi component, even with multiple cores and FreeRTOS!

J-Link
In this article, I am using the SEGGER J-Link for debugging. This is simply because the J-Link probes are available on most developers' desks, I’m using them in many of my projects, and their EDU line is affordable for students and/or hobbyists. Otherwise, there are other solutions available using FT2232 USB-2-Serial breakout boards, for example, the http://dangerousprototypes.com/docs/FT2232_breakout_board.
JTAG Connection
You have to consult the datasheet of your ESP32 device or module to identify the JTAG pins. For the ESP32 Pico-D4, which is on the TTGO Micro-32 module (see “Programming the ESP32 with an ARM Cortex-M USB CDC Gateway“), it is on the following pins:
- IO12: JTAG TDI
- IO13: JTAG TCK
- IO14: JTAG TMS
- IO15: JTAG TDO
- RST/EN: JTAG Reset
- 3.3V: VTref
Below are the needed pins available on the TTGO breakout module:

The needed pins are available on a 2×15 JTAG header:

One way is to use jumper wires to connect the probe with the board:

Below demonstrates the wires annotated:

A good idea is to use a JTAG Adapter board, e.g. the one from Adafruit. That way, I can connect with the smaller 2×5 pin standard JTAG/SWD cable:

The ESP32 is *not* officially supported by SEGGER. It is important to mention that in my setup it worked very well using a J-Link EDU or a J-Link Pro (the ‘big’ probe in the plastic enclosure). It did *not* work with a J-Link EDU mini (not really sure why?).
Using jumper wires is working (but painful): I recommend when designing an ESP32 board to route the JTAG pins to a standard 2×5 header. That way, connection with a debug probe is much easier; this is what we did for our ESP32 board, which is used on our robot in combination with an NXP K22FX512 microcontroller:
Below is how to make a debug connection with the TTGO Micro-32 ESP32 module:

Software and Tools
I recommend using OpenOCD with Eclipse/GDB for debugging. This is free of charge and easy to set up. If you already have set up the toolchain for the ESP32, it already comes with GDB and OpenOCD. Otherwise, see this link.
You should be able to use any Eclipse distribution. In this article, I'm using the NXP MCUXpresso IDE because the ESP32 is used in combination with the NXP K22FX512 microcontroller.
USB Driver Tool
Dealing with USB drivers for OpenOCD can be a pain, especially on Windows. The SysProgs USB Driver Tool simplifies this a lot:
Download the tool from https://visualgdb.com/UsbDriverTool/ and install it (actually, it simply unzips the files to a folder of your choice)
Run the tool:
![usb driver tool]()
- With the J-Link connected to the system, you should see a J-Link Driver
Install the WinUSB driver for it:
![Install WinUSB]()


Keep in mind that with this, it is not a ‘normal’ J-Link anymore, so it cannot be used as such. To restore the original J-Link driver, use the restore menu: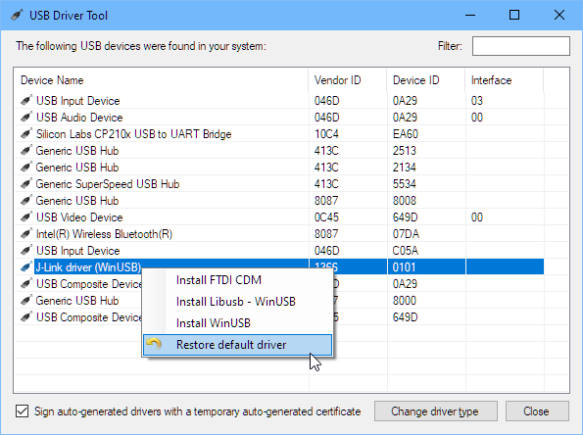
OpenOCD Configuration
I’m going to use the esp-wroom-32.cfg board configuration file.

The default OpenOCD configuration uses a JTAG speed too high. Edit the configuration file and change the speed to 1000 kHz:
adapter_khz 1000
Flashing With OpenOCD
Instead, using the serial bootloader (see “Programming the ESP32 with an ARM Cortex-M USB CDC Gateway“), I can use OpenOCD to program the ESP32 through JTAG:
c:\esp\openocd-esp32\bin\openocd.exe -f interface/jlink.cfg -f board/esp-wroom-32.cfg -c "program_esp32 build/hello-world.bin 0x10000 verify exit"This flashes the given binary (note the forward slashes!) at the given offset, performs a verify, and then exits OpenOCD. Below is an example output:
Open On-Chip Debugger  v0.10.0-esp32-20190708 (2019-07-08-11:04)
Licensed under GNU GPL v2
For bug reports, read
        http://openocd.org/doc/doxygen/bugs.html
adapter speed: 1000 kHz
Info : Configured 2 cores
esp32 interrupt mask on
Info : J-Link V9 compiled Oct 25 2018 11:46:07
Info : Hardware version: 9.10
Info : VTarget = 3.293 V
Info : clock speed 1000 kHz
Info : JTAG tap: esp32.cpu0 tap/device found: 0x120034e5 (mfg: 0x272 (Tensilica), part: 0x2003, ver: 0x1)
Info : JTAG tap: esp32.cpu1 tap/device found: 0x120034e5 (mfg: 0x272 (Tensilica), part: 0x2003, ver: 0x1)
Info : Target halted. PRO_CPU: PC=0x40000400 (active)    APP_CPU: PC=0x40000400
Info : Listening on port 3333 for gdb connections
Info : JTAG tap: esp32.cpu0 tap/device found: 0x120034e5 (mfg: 0x272 (Tensilica), part: 0x2003, ver: 0x1)
Info : JTAG tap: esp32.cpu1 tap/device found: 0x120034e5 (mfg: 0x272 (Tensilica), part: 0x2003, ver: 0x1)
Info : esp32: Debug controller 0 was reset (pwrstat=0x5F, after clear 0x0F).
Info : esp32: Core 0 was reset (pwrstat=0x5F, after clear 0x0F).
Info : Target halted. PRO_CPU: PC=0x5000004B (active)    APP_CPU: PC=0x00000000
Info : esp32: Core 0 was reset (pwrstat=0x1F, after clear 0x0F).
Info : esp32: Debug controller 1 was reset (pwrstat=0x5F, after clear 0x0F).
Info : esp32: Core 1 was reset (pwrstat=0x5F, after clear 0x0F).
Info : Target halted. PRO_CPU: PC=0x40000400 (active)    APP_CPU: PC=0x40000400
** Programming Started **
auto erase enabled
Info : Target halted. PRO_CPU: PC=0x400916EE (active)    APP_CPU: PC=0x40000400
Info : Flash mapping 0: 0x10020 -> 0x3f400020, 84 KB
Info : Flash mapping 1: 0x30018 -> 0x400d0018, 422 KB
Info : Target halted. PRO_CPU: PC=0x400916EE (active)    APP_CPU: PC=0x40000400
Info : Auto-detected flash size 4096 KB
Info : Using flash size 4096 KB
Info : Target halted. PRO_CPU: PC=0x400916EE (active)    APP_CPU: PC=0x40000400
Info : Target halted. PRO_CPU: PC=0x400916EE (active)    APP_CPU: PC=0x40000400
wrote 602112 bytes from file build/hello-world.bin in 23.465628s (25.058 KiB/s)
** Programming Finished **
** Verify Started **
Info : Target halted. PRO_CPU: PC=0x400916EE (active)    APP_CPU: PC=0x40000400
read 599168 bytes from file build/hello-world.bin and flash bank 0 at offset 0x00010000 in 16.135042s (36.264 KiB/s)
contents match
** Verified OK **
shutdown command invoked
Warn : Flash driver of esp32.flash does not support free_driver_priv()
Warn : Flash driver of irom does not support free_driver_priv()
Warn : Flash driver of drom does not support free_driver_priv()
OpenOCD GDB Server
We are going to use a GDB client-server connection with the server already running.
From a DOS prompt, launch OpenOCD with the following command:
c:\esp\openocd-esp32\bin\openocd.exe -f interface/jlink.cfg -f board/esp-wroom-32.cfgThe output should be something like this:

Open On-Chip Debugger  v0.10.0-esp32-20190708 (2019-07-08-11:04)
Licensed under GNU GPL v2
For bug reports, read
        http://openocd.org/doc/doxygen/bugs.html
adapter speed: 4000 kHz
Info : Configured 2 cores
esp32 interrupt mask on
Info : Listening on port 6666 for tcl connections
Info : Listening on port 4444 for telnet connections
Info : J-Link V9 compiled Oct 25 2018 11:46:07
Info : Hardware version: 9.10
Info : VTarget = 3.303 V
Info : clock speed 4000 kHz
Info : JTAG tap: esp32.cpu0 tap/device found: 0x120034e5 (mfg: 0x272 (Tensilica), part: 0x2003, ver: 0x1)
Info : JTAG tap: esp32.cpu1 tap/device found: 0x120034e5 (mfg: 0x272 (Tensilica), part: 0x2003, ver: 0x1)
Info : esp32: Debug controller 0 was reset (pwrstat=0x5F, after clear 0x0F).
Info : esp32: Core 0 was reset (pwrstat=0x5F, after clear 0x0F).
Info : esp32: Debug controller 1 was reset (pwrstat=0x5F, after clear 0x0F).
Info : esp32: Core 1 was reset (pwrstat=0x5F, after clear 0x0F).
Info : Detected debug stubs @ 3ffb39c0 on core0 of target 'esp32'
Info : Listening on port 3333 for gdb connections
The server is now waiting for connections on port 3333, which we are going to use from Eclipse in the next step.
Eclipse Launch Configuration
In Eclipse, create a new ‘GDB Hardware Debugging’ launch configuration.
In the ‘Main’ tab, specify the project and the binary to be used:

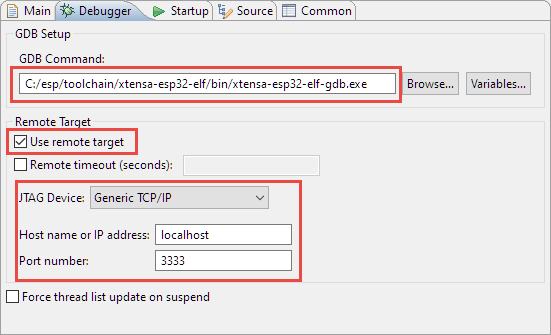
In the ‘Debugger’ tab, specify the path to gdb:
C:/esp/toolchain/xtensa-esp32-elf/bin/xtensa-esp32-elf-gdb.exeNote the forward slashes (/) for the path!
In the ‘Startup’ tab, use the following settings and enter the following commands:
set mem inaccessible-by-default off
mon reset halt
flushregs
set remote hardware-watchpoint-limit 2
The above settings are for debugging an already flashed application on the ESP32. To program the binary, add the following after the ‘mon reset halt’:
mon program_esp32 "build/hello-world.bin" 0x10000 verifyNote that with the above notation, it requires that the OpenOCD server has been started just above that ‘build’ folder location (means: with the current directory of the project).
IMPORTANT: Ideally, I would use something like this:
mon program_esp32 "${project_loc:idf_hello_world}/build/hello-world.bin" 0x10000 verifyBut this does *not* work (at least in the current Eclipse version, as the path gets passed in a wrong way to OpenOCD with the slashes removed:
** Programming Started **
auto erase enabled
Error: couldn't open H:VorlesungADISgitProjectsMCUXpressoIDEidf_hello_world/build/hello-world.bin
embedded:startup.tcl:480: Error: ** Programming Failed **
The alternative (and ugly) way is to use an absolute path instead, e.g.
mon program_esp32 "H:/Vorlesung/ADIS/git/Projects/MCUXpressoIDE/idf_hello_world/build/hello-world.bin" 0x10000 verifyTo save the configuration as .launch file in the project (see “Sharing Debug Configuration with Eclipse“), use the following setting:

That’s it for the Eclipse launch configuration.
Debugging with Eclipse
Now, I can use the launch configuration to debug my target:

In the running GDB server (DOS command prompt), I should see now that it accepts my connection request from Eclipse:
C:\esp\openocd-esp32\bin>openocd.exe -f interface/jlink.cfg -f board/esp-wroom-32.cfg
Open On-Chip Debugger  v0.10.0-esp32-20190708 (2019-07-08-11:04)
Licensed under GNU GPL v2
For bug reports, read
        http://openocd.org/doc/doxygen/bugs.html
adapter speed: 4000 kHz
Info : Configured 2 cores
esp32 interrupt mask on
Info : Listening on port 6666 for tcl connections
Info : Listening on port 4444 for telnet connections
Info : J-Link V9 compiled Oct 25 2018 11:46:07
Info : Hardware version: 9.30
Info : VTarget = 3.335 V
Info : clock speed 4000 kHz
Info : JTAG tap: esp32.cpu0 tap/device found: 0x120034e5 (mfg: 0x272 (Tensilica), part: 0x2003, ver: 0x1)
Info : JTAG tap: esp32.cpu1 tap/device found: 0x120034e5 (mfg: 0x272 (Tensilica), part: 0x2003, ver: 0x1)
Info : Listening on port 3333 for gdb connections
Info : accepting 'gdb' connection on tcp/3333
Error: No symbols for FreeRTOS
Info : Target halted. PRO_CPU: PC=0x40148F12 (active)    APP_CPU: PC=0x40148F12
Info : Target halted. PRO_CPU: PC=0x400916EE (active)    APP_CPU: PC=0x40148F12
Info : Flash mapping 0: 0x10020 -> 0x3f400020, 105 KB
Info : Flash mapping 1: 0x30018 -> 0x400d0018, 490 KB
Info : Target halted. PRO_CPU: PC=0x400916EE (active)    APP_CPU: PC=0x40148F12
Info : Auto-detected flash size 4096 KB
Info : Using flash size 4096 KB
Info : Target halted. PRO_CPU: PC=0x400916EE (active)    APP_CPU: PC=0x40148F12
Info : Flash mapping 0: 0x10020 -> 0x3f400020, 105 KB
Info : Flash mapping 1: 0x30018 -> 0x400d0018, 490 KB
Info : Using flash size 492 KB
Info : Target halted. PRO_CPU: PC=0x400916EE (active)    APP_CPU: PC=0x40148F12
Info : Flash mapping 0: 0x10020 -> 0x3f400020, 105 KB
Info : Flash mapping 1: 0x30018 -> 0x400d0018, 490 KB
Info : Using flash size 108 KB
Warn : negative reply, retrying
Info : JTAG tap: esp32.cpu0 tap/device found: 0x120034e5 (mfg: 0x272 (Tensilica), part: 0x2003, ver: 0x1)
Info : JTAG tap: esp32.cpu1 tap/device found: 0x120034e5 (mfg: 0x272 (Tensilica), part: 0x2003, ver: 0x1)
Info : esp32: Debug controller 0 was reset (pwrstat=0x5F, after clear 0x0F).
Info : esp32: Core 0 was reset (pwrstat=0x5F, after clear 0x0F).
Info : Target halted. PRO_CPU: PC=0x5000004B (active)    APP_CPU: PC=0x00000000
Info : esp32: Core 0 was reset (pwrstat=0x1F, after clear 0x0F).
Info : esp32: Debug controller 1 was reset (pwrstat=0x5F, after clear 0x0F).
Info : esp32: Core 1 was reset (pwrstat=0x5F, after clear 0x0F).
Info : Target halted. PRO_CPU: PC=0x40000400 (active)    APP_CPU: PC=0x40000400
Info : Detected debug stubs @ 3ffb3a30 on core0 of target 'esp32'
Info : Target halted. PRO_CPU: PC=0x400D5650 (active)    APP_CPU: PC=0x40148F12
Note: It does *not* work with a J-Link EDU mini (https://www.segger.com/products/debug-probes/j-link/models/j-link-edu-mini/), probably because it is not fast enough? Lowering the JTAG frequency did help, OpenOCD reports LIBUSB_ERROR_TIMEOUT errors:
Info : accepting 'gdb' connection on tcp/3333
Error: No symbols for FreeRTOS
Warn : Failed to send data to device: LIBUSB_ERROR_TIMEOUT.
Warn : Failed to send data to device: LIBUSB_ERROR_TIMEOUT.
Error: Sending data to device timed out.
Error: transport_write() failed: timeout occurred.
Error: jaylink_jtag_io() failed: timeout occurred.
Error: Failed to fetch AR regs!

Warn : Last read operation left 579 bytes.
Info : Target halted. PRO_CPU: PC=0x00000000 (active)    APP_CPU: PC=0x00000000
Warn : Failed to send data to device: LIBUSB_ERROR_TIMEOUT.
Warn : Failed to send data to device: LIBUSB_ERROR_TIMEOUT.
Error: Sending data to device timed out.
Error: transport_write() failed: timeout occurred.
Error: jaylink_jtag_io() failed: timeout occurred.
Warn : Last read operation left 2048 bytes.
Warn : Failed to send data to device: LIBUSB_ERROR_TIMEOUT.
Warn : Failed to send data to device: LIBUSB_ERROR_TIMEOUT.
Error: Sending data to device timed out.
Error: transport_write() failed: timeout occurred.
Error: jaylink_jtag_io() failed: timeout occurred.
Warn : Last read operation left 2048 bytes.
With this, I’m using the power of Eclipse to debug the ESP32 and can see all the FreeRTOS threads

Summary
While most people are ‘debugging’ the ESP32 in ‘Arduino printf()’ style, I prefer to use a real debugger to inspect the target state and step through the code. Eclipse with GDB is a great tool that helps me to understand the code execution on the ESP32. It requires a JTAG debug probe as the SEGGER J-Link and the needed JTAG pins available on a debug header. While this is some effort, the benefits of it are priceless in my view.
Happy JTAGing!
Helpful Links
Published at DZone with permission of Erich Styger. See the original article here.
Opinions expressed by DZone contributors are their own.
Comments