

Essential Monitoring Metrics for Cloud Native Systems: Part 1
Master cloud-native observability. Learn essential monitoring metrics — from Golden Signals to saturation — to keep your distributed systems reliable.
 CORE
·
CORE
·
Join the DZone community and get the full member experience.
Join For FreeMonitoring Is Not a Dashboard-Only Problem
In the last couple of years, I have moved across a few product teams. Every time I walk into an engineering team and ask how monitoring works. I get a standard response.
| There is a dashboard
Usually, Grafana. Sometimes Kibana or Splunk. Team members have passed me links buried in wiki pages, and nobody updates them anymore.
But dashboards don't make a system observable. I have worked on large-scale cloud projects. All of them have dashboards, but still struggle to answer basic questions during an incident.
What Can Fail?
The answer to this question can change how you think about monitoring. To me, monitoring is a systems thinking problem. Any cloud solution that I work on is not a single application anymore. With cloud solutions, I am talking about API Gateways, event streams, microservices, containers, managed cloud services, and external integrations.
Something is always lagging somewhere, and all users will tell you is "The system is slow."
It might mean that either an API is timing out, the queue is backing up, a container is restarting, or the network path is degraded.
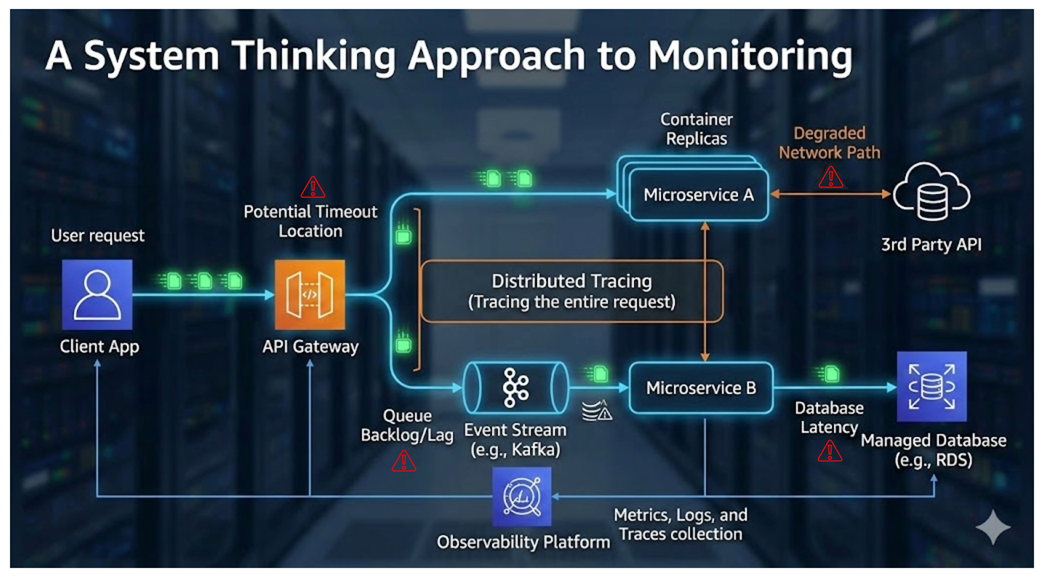
In this article, I try to put down some of the monitoring metrics that I find useful. These can help you diagnose incidents and keep the system reliable.
Monitoring vs. Observability — Why it matters?
I can say that monitoring used to mean one thing:
| Is the server alive?
If CPU was below 80% and memory was below 70%, everything looked fine.
Modern systems are not the same. You can have a healthy-looking infrastructure, a normal CPU utilisation, a healthy memory graph, and still have a production outage. I have seen services returning timeouts for hours while dashboards showed everything green. That can happen as traditional monitoring focuses on resources, while failures can occur during interactions between services.
This is where observability comes in. Monitoring answers: "Is something wrong?" and observability answers: "Why is it wrong?" You need both.
What You Need
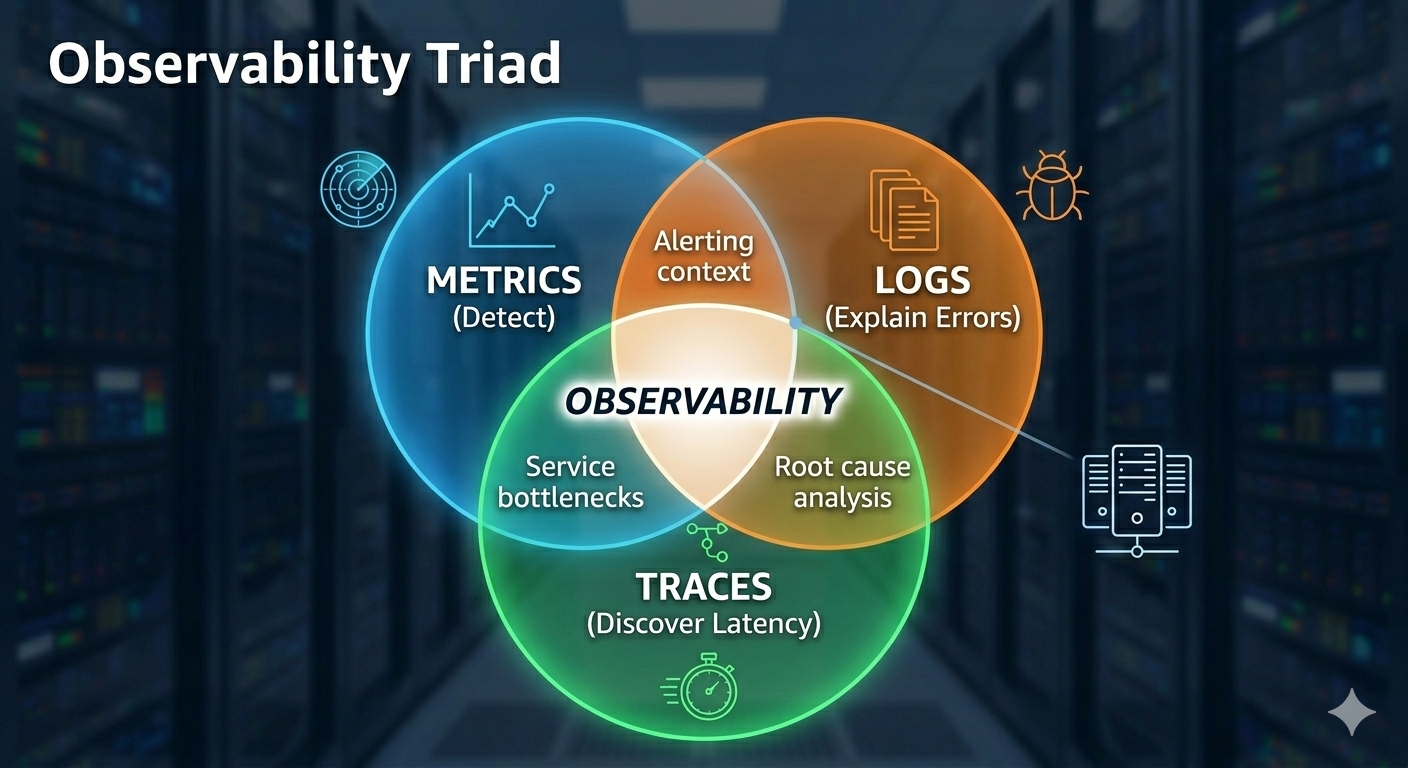
In practice, you need three things. Metrics are used to detect problems, logs to explain errors, and traces to discover latency. If your metrics are wrong, you would never know that something is failing. And if you don't know something is failing, you never check logs and traces, which is why metrics are the entry point of any investigation.
Typical Monitoring Challenges
Most of the time, teams don't have strategies for monitoring. It is the last backlog item to be picked up before the final production release. One service team adds a dashboard, another adds alerts, and a third team introduces a different naming convention.
Six months down the line, you get duplicate metrics and inconsistent naming. There are no standard dashboards and alerts that nobody trusts. Eventually, teams ignore alerts, stop relying on monitoring, and fall back to guesswork. That is a dangerous place to be.
One pattern I have seen repeatedly is metric explosion without clarity. A service exposes 400 metrics, and nobody knows which one matters.
Good monitoring is not about collecting more metrics. It is about collecting the right metrics. A production-ready service rarely needs more than 10-20 core metrics and a small number of critical alerts. Everything else is an investigation detail. Not an operational signal.
4 Signals That Every Service Needs
I recommend that every service must expose the following four signals. I sometimes refer to them as minimum survival metrics.
- Latency
- Traffic
- Errors
- Saturation
They can help you diagnose most production incidents. Let us discuss them.
1. Latency: Earliest Signal
Latency is usually the earliest signal that something is going wrong. Long before error rates increase... Long before services fail... Latency begins to drift upward.
Slow systems become broken systems eventually. If you only monitor errors, you will detect problems late. If you monitor latency, you can catch problems early.
Why Are Averages False Indicators?
- p50 for a typical user experience
- p95 for degraded experience, and
- p99 for worst-case experience
Average latency is one of the most misleading metrics in production systems; however, many teams are still monitoring it. Consider a scenario where 990 requests complete in 40ms and 10 requests take 4 seconds. It means an average latency of about 80 ms. But a user experiencing the slow requests would strongly disagree.
Observing percentiles can solve this problem. You should track all the following:
If p99 starts moving, it is the first clue during the incidents. Even if averages look perfect. Below is a code snippet to produce percentile metrics.
@RestController
public class OrderController {
    private final Timer orderTimer;

    public OrderController(MeterRegistry registry) {
        this.orderTimer =
            registry.timer("order.api.latency");
    }

    @GetMapping("/orders/{id}")
    public Order getOrder(@PathVariable String id) {
        return orderTimer.record(() -> {
            return orderService.getOrder(id);
        });
    }
}
What Good Latency Dashboards Look Like
A good latency dashboard should answer one question instantly
| Are users experiencing slow responses?
That means, you are looking for percentiles and not averages with clear trends. If you need five minutes to interpret a graph, the dashboard is not working.
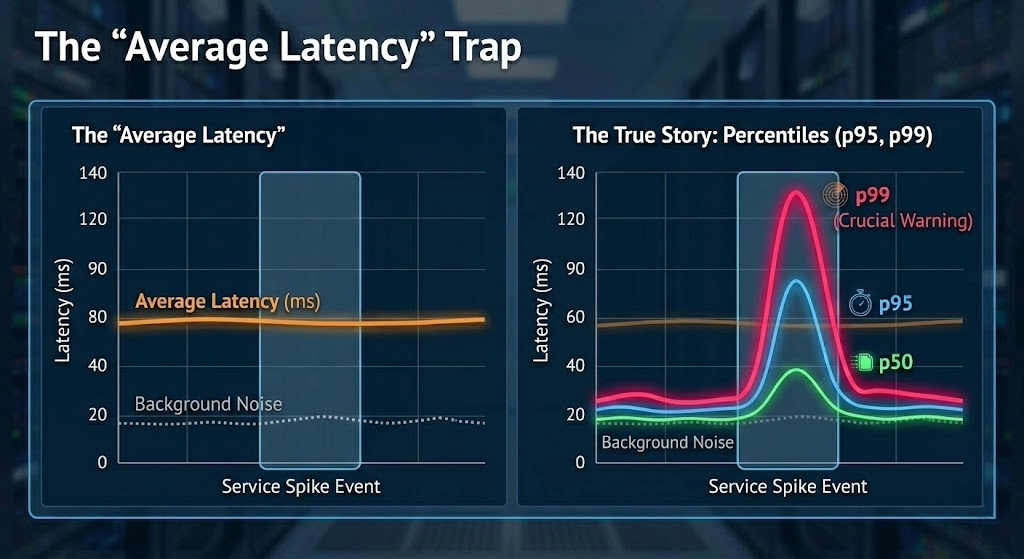 Percentiles over percentage on latency dashboard
2. Traffic: System Load
Traffic on your services tells you what the system is dealing with. Without traffic metrics, you cannot interpret latency or errors correctly. An error spike during a traffic spike means something very different from an error spike during normal load.
Traffic metrics include requests per second, events per second, messages per second, and batch rates. Most incidents begin with a traffic change. Sometimes expected and sometimes not.
A common pattern that I have always observed: Traffic increases, and that increases latency. Integrations slow down, and errors appear. Without traffic metrics, the root cause looks mysterious. With traffic metrics, it becomes obvious.
Prometheus query example:
Requests per second:
rate(http_server_requests_seconds_count[1m])
This metric alone explains a surprising number of incidents.
Production Incident
I once observed a latency spike that looked like a system failure. When I checked, CPU and memory looked normal, pods were healthy, error rates were low, and everything looked fine except traffic.
Traffic doubled within 10 minutes due to a partner integration retry loop. Nothing was technically broken, but the system was overloaded. Without traffic metrics, I would have spent hours investigating. That is the difference good monitoring makes.
I will continue this discussion in my next blog post.
Published at DZone with permission of Gaurav Gaur. See the original article here.
Opinions expressed by DZone contributors are their own.
Comments