

Mastering Latency With P90, P99, and Mean Response Times
Optimizing web performance through latency metrics: mean response times and the critical percentiles P90 and P99 to enhance user experience and system efficiency.
Join the DZone community and get the full member experience.
Join For FreeIn the fast-paced digital world, where every millisecond counts, understanding the nuances of network latency becomes paramount for developers and system architects. Latency, the delay before a transfer of data begins following an instruction for its transfer, can significantly impact user experience and system performance. This post dives into the critical metrics of latency: P90, P99, and mean response times, offering insights into their importance and how they can guide in optimizing services.
The Essence of Latency Metrics
Before diving into the specific metrics, it is crucial to understand why they matter. In the realm of web services, not all requests are treated equally, and their response times can vary greatly. Analyzing these variations through latency metrics provides a clearer picture of a system's performance, especially under load.
Mean Response Time: The Average Perspective
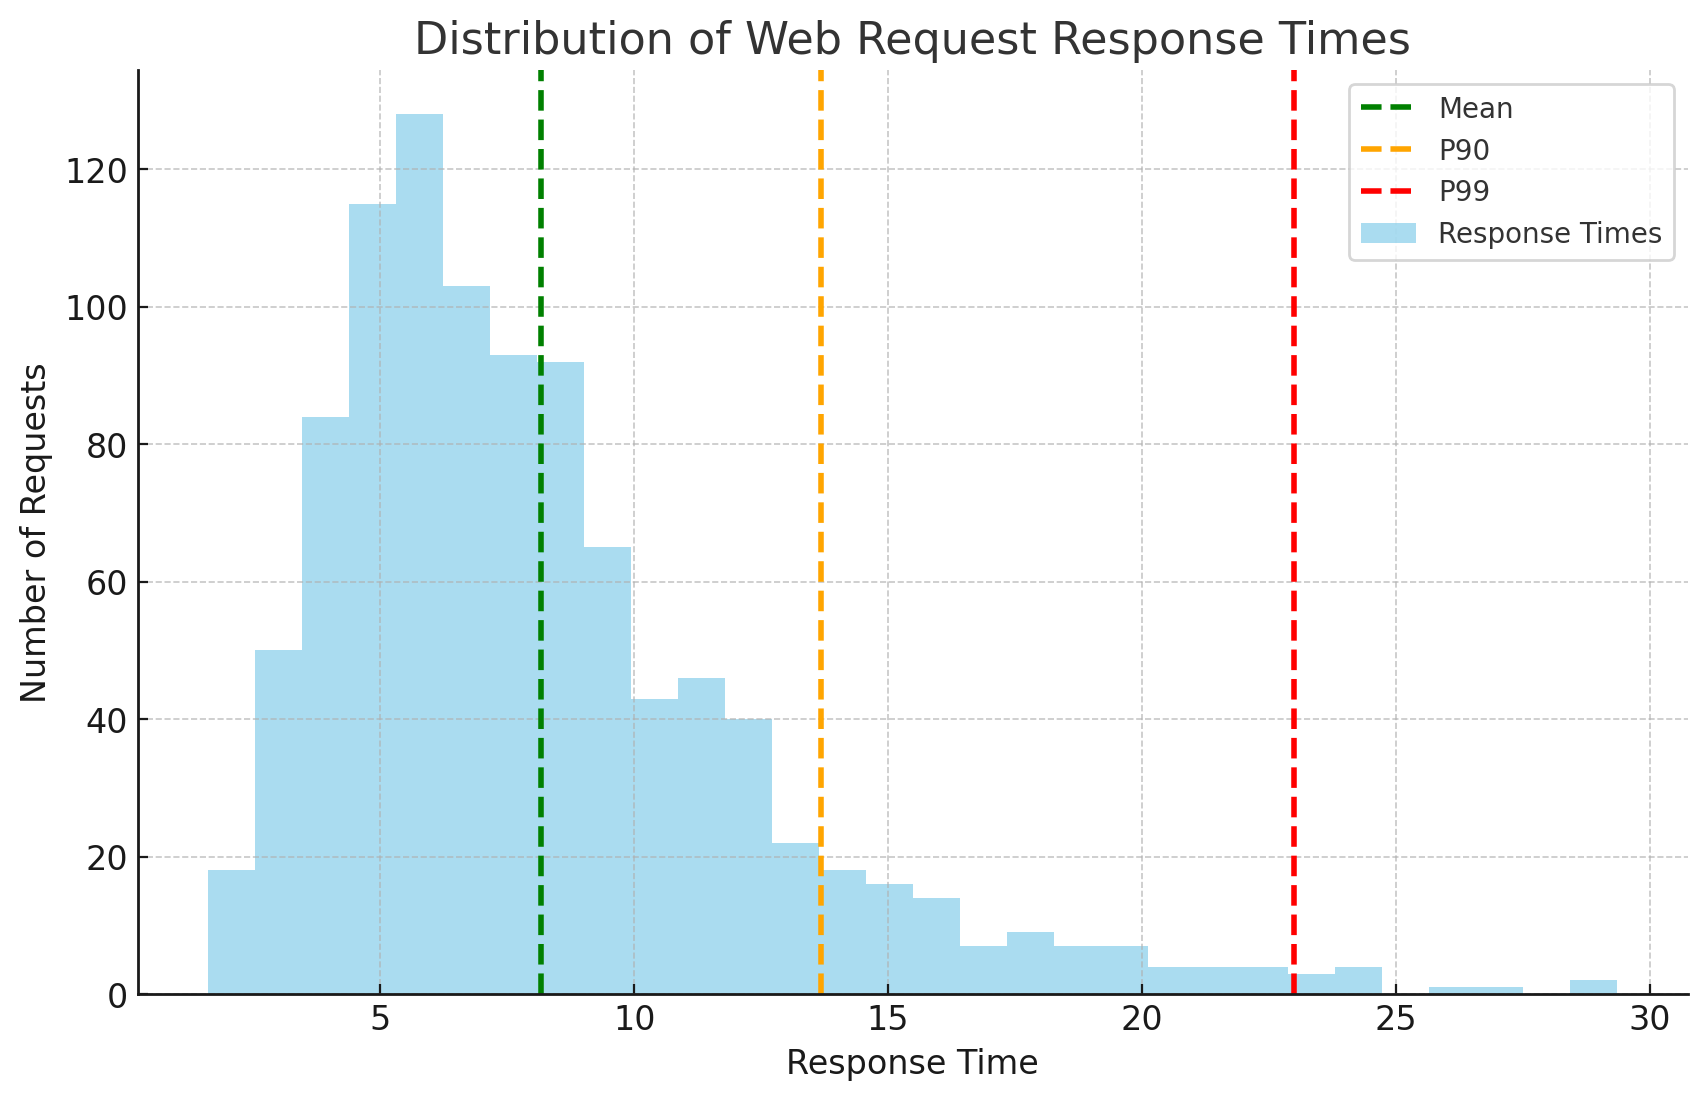
The mean response time is often the first metric people turn to when discussing latency. It represents the average time it takes for a system to respond to requests. While useful for getting a general sense of performance, the mean can be misleading due to its susceptibility to outliers. A few unusually long response times can skew the average, masking the experience of the majority.
P90 and P99: Decoding Percentiles
Percentiles offer a more nuanced view of latency by indicating the proportion of requests completed within a certain timeframe. P90 and P99 are particularly telling:
- P90 (90th Percentile): This metric tells us that 90% of all requests are processed within this time frame. It provides insight into the performance experienced by the majority of users.
- P99 (99th Percentile): By showing the time under which 99% of requests are completed, P99 reveals the worst-case scenarios short of the absolute maximum. This is crucial for understanding the outliers and ensuring that even the slowest 1% of requests meet performance standards.
Why Percentiles Matter More Than Averages
Focusing on P90 and P99, rather than just the mean, allows developers to tune systems for the experiences of nearly all users, including those at the tail end of response times. It helps in identifying bottlenecks and ensuring that performance degradation impacts as few users as possible.
Practical Applications: Enhancing System Performance
Armed with P90 and P99 metrics, developers can:
- Identify and address outliers: By understanding the upper bounds of latency, system architects can pinpoint and mitigate issues causing delays.
- Optimize for the majority: Ensuring that 90% or even 99% of requests are handled swiftly leads to a smoother, more consistent user experience.
- Make informed decisions: When upgrading infrastructure or tweaking systems, knowing where the latency bottlenecks lie can guide more effective improvements.
Conclusion: Beyond the Average
While the mean response time offers a starting point for latency analysis, diving deeper into the percentile P90 and P99 provides a fuller understanding of a system's performance. These metrics are indispensable tools for optimizing web services, ensuring they can handle the demands of today's digital landscape efficiently. By focusing on the experiences of the vast majority of users, including those at the extreme ends of the spectrum, developers can craft more responsive, reliable, and user-friendly applications.
Opinions expressed by DZone contributors are their own.
Comments