

How to Effectively Evaluate a Ranking ML System
Evaluating ranking systems requires more than offline metrics. Learn how to use offline, online, and business metrics to measure real impact.
Join the DZone community and get the full member experience.
Join For FreeI've seen too many ranking systems evaluated on metrics that look great in papers but mean nothing to the business. The evaluation gap between research and production is real, and it costs companies millions of dollars.
The problem starts with how we think about evaluation. Most data science teams treat it as a one-time validation step. You train a model, check some offline metrics, maybe run an A/B test, and ship it. But ranking systems are different from classification or regression tasks. They operate in feedback loops where today's rankings influence tomorrow's training data. They serve millions of requests with millisecond latency requirements. And they affect business metrics that offline metrics barely correlate with.
I learned this when I shipped a feed ranking model that had, on paper, really good offline metrics. NDCG was up, precision was up recall was up. Two weeks into the A/B test, engagement was flat, and revenue had dropped 4%. The model was technically better at predicting what users would click, but it created a filter bubble that hurt long-term retention. Our offline evaluation completely missed this.
Here's what I wish someone had told me earlier: Evaluating a ranking system requires three distinct lenses. You need offline metrics to iterate quickly during development. You need online metrics to measure real user behavior. And you need business metrics to understand if any of this actually matters. Most teams do one or two of these. The best teams do all three and understand how they connect.
The challenge is that each lens requires different infrastructure, different expertise, and different timescales. Offline evaluation happens in hours. Online evaluation takes weeks. Business impact becomes clear over months.
Understanding Ranking Metrics: What They Actually Measure
Let's get concrete about what these metrics mean with a real example. Imagine you're ranking articles for a user, and you have 5 articles to show. Based on the user's past behavior, articles 1, 3, and 5 are actually relevant to them. (This is the ground truth for us).
Your ranking system produces this order: [1, 2, 3, 4, 5].
So positions 1, 3, and 5 contain relevant items, while positions 2 and 4 have irrelevant ones.
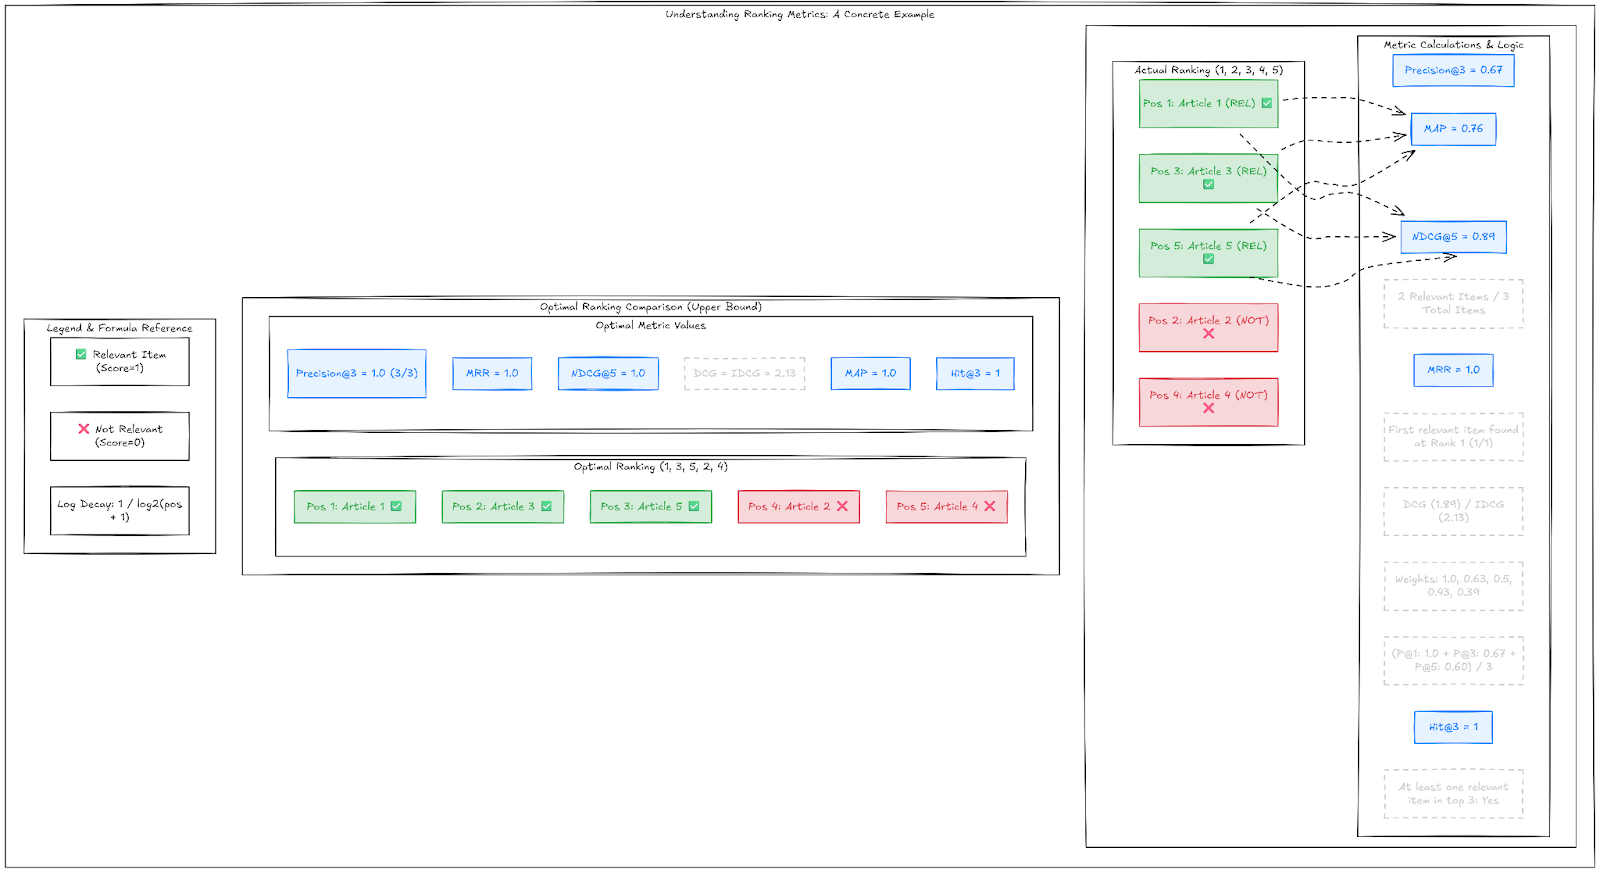
Precision at K (P@K) is the simplest metric. It asks: Of the top K items I showed, how many were relevant? For our example, P@3 = 2/3 (items at positions 1 and 3 are relevant out of 3 shown). P@5 = 3/5. This metric treats all positions within K equally, which is both its strength and weakness. It's easy to understand and directly measures what users see, but it ignores that position 1 gets way more attention than position 3.
Mean reciprocal rank (MRR) only cares about the first relevant item. It's 1 divided by the position of the first relevant result. In our example, the first relevant item is at position 1, so MRR = 1/1 = 1.0. Perfect score. If the first relevant item was at position 3, MRR would be 1/3 = 0.33. This metric is great for search engines, where users typically want one good answer fast. It's terrible for feeds or recommendations where users browse multiple items.
Normalized discounted cumulative gain (NDCG) is more sophisticated. It gives you credit for relevant items but discounts them based on position. The formula is DCG = Σ(relevance / log2(position + 1)). For our example with binary relevance (1 for relevant, 0 for not):
- Position 1: 1/log2(2) = 1.0
- Position 2: 0/log2(3) = 0
- Position 3: 1/log2(4) = 0.5
- Position 4: 0/log2(5) = 0
- Position 5: 1/log2(6) = 0.39
- DCG = 1.0 + 0.5 + 0.39 = 1.89
Then you normalize by the ideal DCG (if you had ranked all relevant items first: [1, 3, 5, 2, 4]), which would give you IDCG = 1.0 + 0.63 + 0.5 = 2.13. So NDCG = 1.89/2.13 = 0.89.
The logarithmic discount means position 2 is worth about half of position 1, and position 5 is worth much less. This matches user behavior better than P@K, but the math is harder to explain to stakeholders.
Mean average precision (MAP) computes precision at each relevant item's position, then averages. For our ranking [1, 2, 3, 4, 5] with relevant items at positions 1, 3, 5:
- At position 1: P@1 = 1/1 = 1.0
- At position 3: P@3 = 2/3 = 0.67
- At position 5: P@5 = 3/5 = 0.6
- MAP = (1.0 + 0.67 + 0.6) / 3 = 0.76
MAP rewards you for putting relevant items higher and penalizes spreading them throughout the list. It's particularly useful when you care about finding multiple relevant items, like in document retrieval.
Hit rate at K is even simpler than P@K. It's binary: did at least one relevant item appear in the top K? For our example, Hit@3 = 1 (yes, we found relevant items), Hit@1 = 1, Hit@2 = 1. If our ranking was [2, 4, 1, 3, 5], then Hit@1 = 0, Hit@2 = 0, Hit@3 = 1. This is useful for recommendation systems where you just need to show the user something they'll engage with.
Here's what catches people: these metrics can disagree wildly. Consider two rankings:
- Ranking A: [1, 3, 5, 2, 4] (all relevant items first) Ranking B: [1, 2, 3, 4, 5] (relevant items scattered)
- P@5: Both get 3/5 = 0.6 MAP: A gets 1.0, B gets 0.76 NDCG@5: A gets 1.0, B gets 0.89 Hit@5: Both get 1.0
Which ranking is better depends entirely on your use case. For a search engine where users want the best results immediately, A is clearly superior. For a browsing feed where users scroll anyway, the difference matters less.
The metrics also behave differently under improvement. Moving one relevant item from position 10 to position 5 will barely change P@3 but significantly improve NDCG@10. This is why I always track multiple metrics and understand their trade-offs before optimizing.
Ranking Metrics Comparison Table
| Metric | formula | best for | when to use |
|---|---|---|---|
|
Precision@K |
relevant_in_top_k / k |
Browse experiences, feeds |
News feeds, product listings where users scan multiple items |
|
MRR |
1 / position_of_first_relevant |
Search, Q&A systems |
Search engines, chatbots, FAQ systems |
|
NDCG@K |
DCG / IDCG where DCG = Σ(rel/log2(pos+1)) |
All-purpose ranking |
General recommendations, search results with varying relevance |
|
MAP |
mean(precision@each_relevant_pos) |
Information retrieval |
Document retrieval, email search, academic search |
|
Hit@K |
1 if any_relevant_in_top_k else 0 |
Casual browsing, entertainment |
Video recommendations, music playlists, explore features |
|
Recall@K |
relevant_in_top_k / total_relevant |
Comprehensive results needed |
Medical search, legal research, compliance checking |
The Offline Evaluation Problem
Offline metrics are where most teams start, and where most problems hide. You take historical data, split it into train and test sets, and measure how well your model predicts held-out interactions. Standard practice. Also deeply flawed for ranking systems.
The core issue is position bias. Users click on items partly because of relevance and partly because of where they appear. Your historical data has items ranked by the old system, so your test set is contaminated with the old ranker's biases. When you evaluate a new model on this data, you're not measuring how good it is at ranking. You're measuring how similar it is to the old ranker.
I've debugged this exact problem multiple times. A new model scores worse on NDCG than the baseline, so the team abandons it. But when we finally run an A/B test out of desperation, the "worse" model wins. The offline metrics were lying because they were trained on biased data.
There are techniques to handle this. Inverse propensity scoring reweights examples by their probability of being shown. Unbiased learning-to-rank methods try to debias during training. But these require logging propensity scores at serving time, which many systems don't do. And they make strong assumptions about user behavior that rarely hold in practice.
The practical solution is simpler: use offline metrics for relative comparisons, not absolute judgments. If model A beats model B offline, A might be better. But the gap size tells you almost nothing about real-world impact. I've seen 0.001 NDCG improvements drive 5% engagement lifts and 0.05 improvements do nothing.
What Metrics Actually Matter Offline
If you're going to use offline metrics, at least use the right ones. NDCG is fine for academic papers, but often wrong for production. It assumes all positions matter, just with diminishing returns. Real users mostly look at the top 3–5 items.
Precision at K is better for most applications. Precision@3 tells you how many of the top 3 items were relevant. This matches how users actually consume ranked lists. For a news feed, users scroll until they find something interesting. For search results, they click the first good option. Optimizing for the entire ranking is wasted effort.
But relevance itself is tricky. In offline evaluation, you typically use implicit feedback, like clicks, or explicit feedback, like ratings. Clicks are abundant but noisy. A user might click something by accident, or because the thumbnail was misleading, or because everything else looked worse. Ratings are cleaner but sparse and biased toward extreme opinions.
The best approach I've found is using multiple feedback signals with different time horizons. Clicks tell you about immediate appeal. Time spent tells you about actual engagement. Return visits tell you about long-term value. A good ranking system should improve all three, not just optimize for clicks.
Building Reliable Online Evaluation
Online evaluation means A/B testing in production. This is where you find out if your model actually works. But running ranking experiments at scale has unique challenges that trip up even experienced teams.
The first challenge is interference. In a standard A/B test, you assume treating one user doesn't affect others. This breaks down for ranking systems in multiple ways. If your ranker promotes viral content, it affects what everyone sees. If it changes marketplace dynamics, sellers change their behavior, which changes what you're ranking. Your control and treatment groups aren't independent.
Network effects make this worse. Social feeds are especially problematic because popular items become more popular. You can't tell whether your new ranker is actually better or just got lucky by promoting something that went viral. I've seen teams celebrate a winning variant that was just riding a trend.
The solution is to be very careful about your randomization unit and your metric collection period. For most ranking systems, randomizing by user is fine if you run the test long enough to wash out short-term fluctuations. Two weeks minimum, four weeks better. And track leading indicators daily while only making decisions on lagging indicators weekly.
Handling Scale and Latency
Here's something that doesn't get talked about enough: your evaluation infrastructure needs to handle production scale, or your metrics will lie to you.
The problem is usually latency. Ranking systems have brutal latency requirements. Users won't wait more than a few hundred milliseconds for results. Your fancy neural ranker might score items beautifully, but if it takes 500ms to run, you can only rank a small candidate set. The candidate generation step becomes your actual ranker, and you're measuring the wrong thing.
This means your evaluation pipeline needs to measure latency under a realistic load. Not average latency on your development machine. P99 latency with production traffic patterns, real database load, and actual network conditions. Some teams use shadow mode for this, where they run the new ranker in parallel without serving results. This tells you if it can even survive production before you waste time on an A/B test.
Conclusion
Evaluating ranking systems well is hard. You need offline metrics to iterate fast, online tests to measure reality, and the wisdom to know when they disagree. The gap between a good NDCG score and actual user value is real, and no amount of mathematical sophistication closes it completely.
But here's what works: Start simple with Precision@3 and NDCG@10, validate everything with A/B tests, and remember that your users don't care about your metrics. They care about finding what they need. Build your evaluation pipeline to serve that goal, not the other way around.
The best ranking system isn't the one with the highest offline score. It's the one that ships, learns from real users, and improves over time.
Further Reading
For those interested in diving deeper into ranking evaluation and related topics, here are some authoritative resources:
- Wang, Y., et al. (2013). "A Theoretical Analysis of NDCG Ranking Measures" - The definitive theoretical analysis proving why logarithmic discounting works in NDCG.
- Scikit-learn Documentation. "NDCG Score Implementation" - Practical implementation with examples.
- Casalegno, F. (2022). "Learning to Rank: A Complete Guide" - Comprehensive overview of pointwise, pairwise, and listwise approaches.
- Saisuman, Singamsetty (2024). "Efficacy of Data Governance: A Cutting Edge Approach to Ensuring Data Quality in Machine Learning for Banking Industry" - Machine Learning Techniques.
- Sudheer, Singamsetty (2025). "An Intelligent Framework for Secure and Fair Cloud Resource Distribution" - Policy-driven model like QoS-Aware Policy Model and Meta-Learning Ensemble Model (MLEM) learner framework.
Opinions expressed by DZone contributors are their own.
Comments