

Event-Driven Pipelines With Apache Pulsar and Go
Build scalable, real-time pipelines with Apache Pulsar and Go using event-driven producers and consumers that communicate via Pulsar topics.
 ·
·
Join the DZone community and get the full member experience.
Join For FreeA Practical Walkthrough
Most distributed systems eventually hit a wall with their messaging layer, whether it's Kafka's tight coupling between compute and storage, RabbitMQ's limited replay capabilities, or the operational overhead of managing multiple tools for queuing and streaming.
Apache Pulsar was engineered to address these gaps from the ground up. In this article, we'll dissect a working Go-based demo that wires together a Pulsar producer, consumer, and Prometheus monitoring layer into a cohesive, observable messaging pipeline. The full source is on GitHub.
Why Pulsar Deserves a Closer Look
Pulsar's architecture makes a deliberate trade-off that most messaging systems avoid: it physically separates the broker tier (which handles routing, subscriptions, and protocol) from the storage tier (Apache BookKeeper, which handles persistence). This isn't just an implementation detail. It means you can independently autoscale message routing capacity without touching your storage cluster, and vice versa.
Beyond the architecture, a few capabilities stand out for engineering teams:
- Multi-tenancy at the protocol level – tenants, namespaces, and topics form a three-level hierarchy, making it practical to run a single Pulsar cluster for multiple teams or services without namespace collisions.
- Four distinct subscription semantics – Exclusive, Shared, Failover, and Key_Shared give you precise control over how messages are distributed across consumer instances, something Kafka's consumer group model doesn't natively offer.
- Cursor-based message retention – Pulsar retains messages based on subscription cursors, not time-based log compaction. A consumer that falls behind doesn't lose messages; it simply catches up from its last acknowledged position.
- Native schema enforcement – The built-in schema registry validates message payloads at the broker level before they reach consumers, catching contract violations at the boundary rather than deep inside application logic.
What the Demo Builds
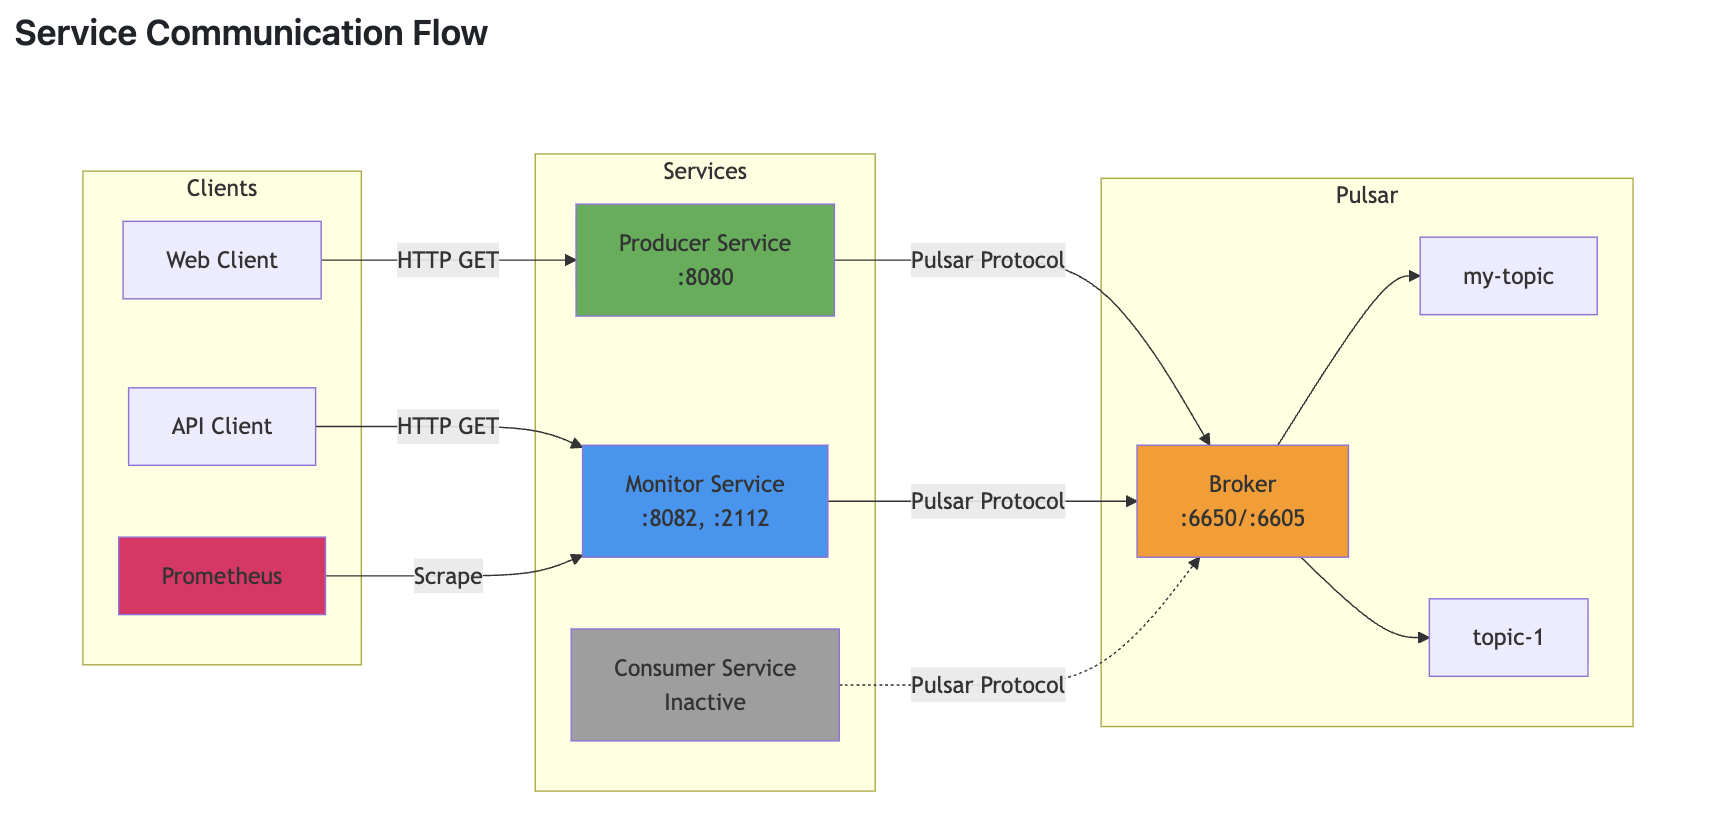
The project is structured as three independent Go binaries, each with a single responsibility:
├── producer/
│   ├── main.go       # HTTP server → Pulsar publisher
│   ├── go.mod
│   └── go.sum
├── consumer/
│   └── main.go       # Pulsar subscriber → message processor
├── monitor/
│   └── main.go       # Pulsar producer + Prometheus metrics server
├── prometheus.yml    # Scrape configuration
└── README.md
All three use `github.com/apache/pulsar-client-go/pulsar` — the official, Apache-maintained Go client. The client is not a thin wrapper; it implements the full Pulsar binary protocol, connection pooling, producer batching, and automatic Prometheus metric registration.
Component 1: The Producer
The producer exposes a single HTTP endpoint. An incoming HTTP request triggers a Pulsar publish operation, decoupling the caller from any direct knowledge of the messaging infrastructure.
package main

import (
    "context"
    "fmt"
    "log"
    "net/http"
    "github.com/apache/pulsar-client-go/pulsar"
)

var client pulsar.Client

func main() {
    var err error
    client, err = pulsar.NewClient(pulsar.ClientOptions{
        URL: "pulsar://localhost:6650",
    })
    if err != nil {
        log.Fatal(err)
    }

    defer client.Close()
    http.HandleFunc("/publish", func(w http.ResponseWriter, r *http.Request) {
        msg := r.URL.Query().Get("msg")
        err := publishMessage(msg)
        if err != nil {
            w.Write([]byte("msg failed to published"))
        } else {
            w.Write([]byte("msg successfully published"))
        }
    })

    if err := http.ListenAndServe(":8080", nil); err != nil {
        log.Fatal(err)
    }
}

func publishMessage(msg string) error {
    producer, err := client.CreateProducer(pulsar.ProducerOptions{
        Topic: "my-topic",
    })
    if err != nil {
        log.Fatal(err)
    }
    _, err = producer.Send(context.Background(), &pulsar.ProducerMessage{
        Payload: []byte("Hello"),
    })
    return err
}
A few architectural observations worth unpacking:
The HTTP-to-Pulsar bridge pattern is deliberately pragmatic. Rather than requiring every upstream service to embed a Pulsar client, you expose a thin HTTP adapter. This is particularly valuable when integrating with systems that speak HTTP natively — CI/CD pipelines, third-party webhooks, or legacy services that can't easily adopt a new client library.
`pulsar.NewClient` establishes a connection pool, not a single TCP connection. The client maintains persistent connections to the broker and handles reconnection, load balancing across broker nodes, and TLS negotiation transparently. Calling `client.Close()` via `defer` ensures all in-flight messages are flushed before the process exits.
`producer.Send` with `context.Background()` submits the message to the producer's internal send queue. The Pulsar client batches outgoing messages by default (configurable via `BatchingMaxMessages` and `BatchingMaxPublishDelay`), which significantly improves throughput under load without any changes to application code.
For production use, the producer instance should be created once at startup and reused across requests. Creating a new producer per request incurs connection overhead and bypasses the batching optimization entirely.
Component 2: The Consumer
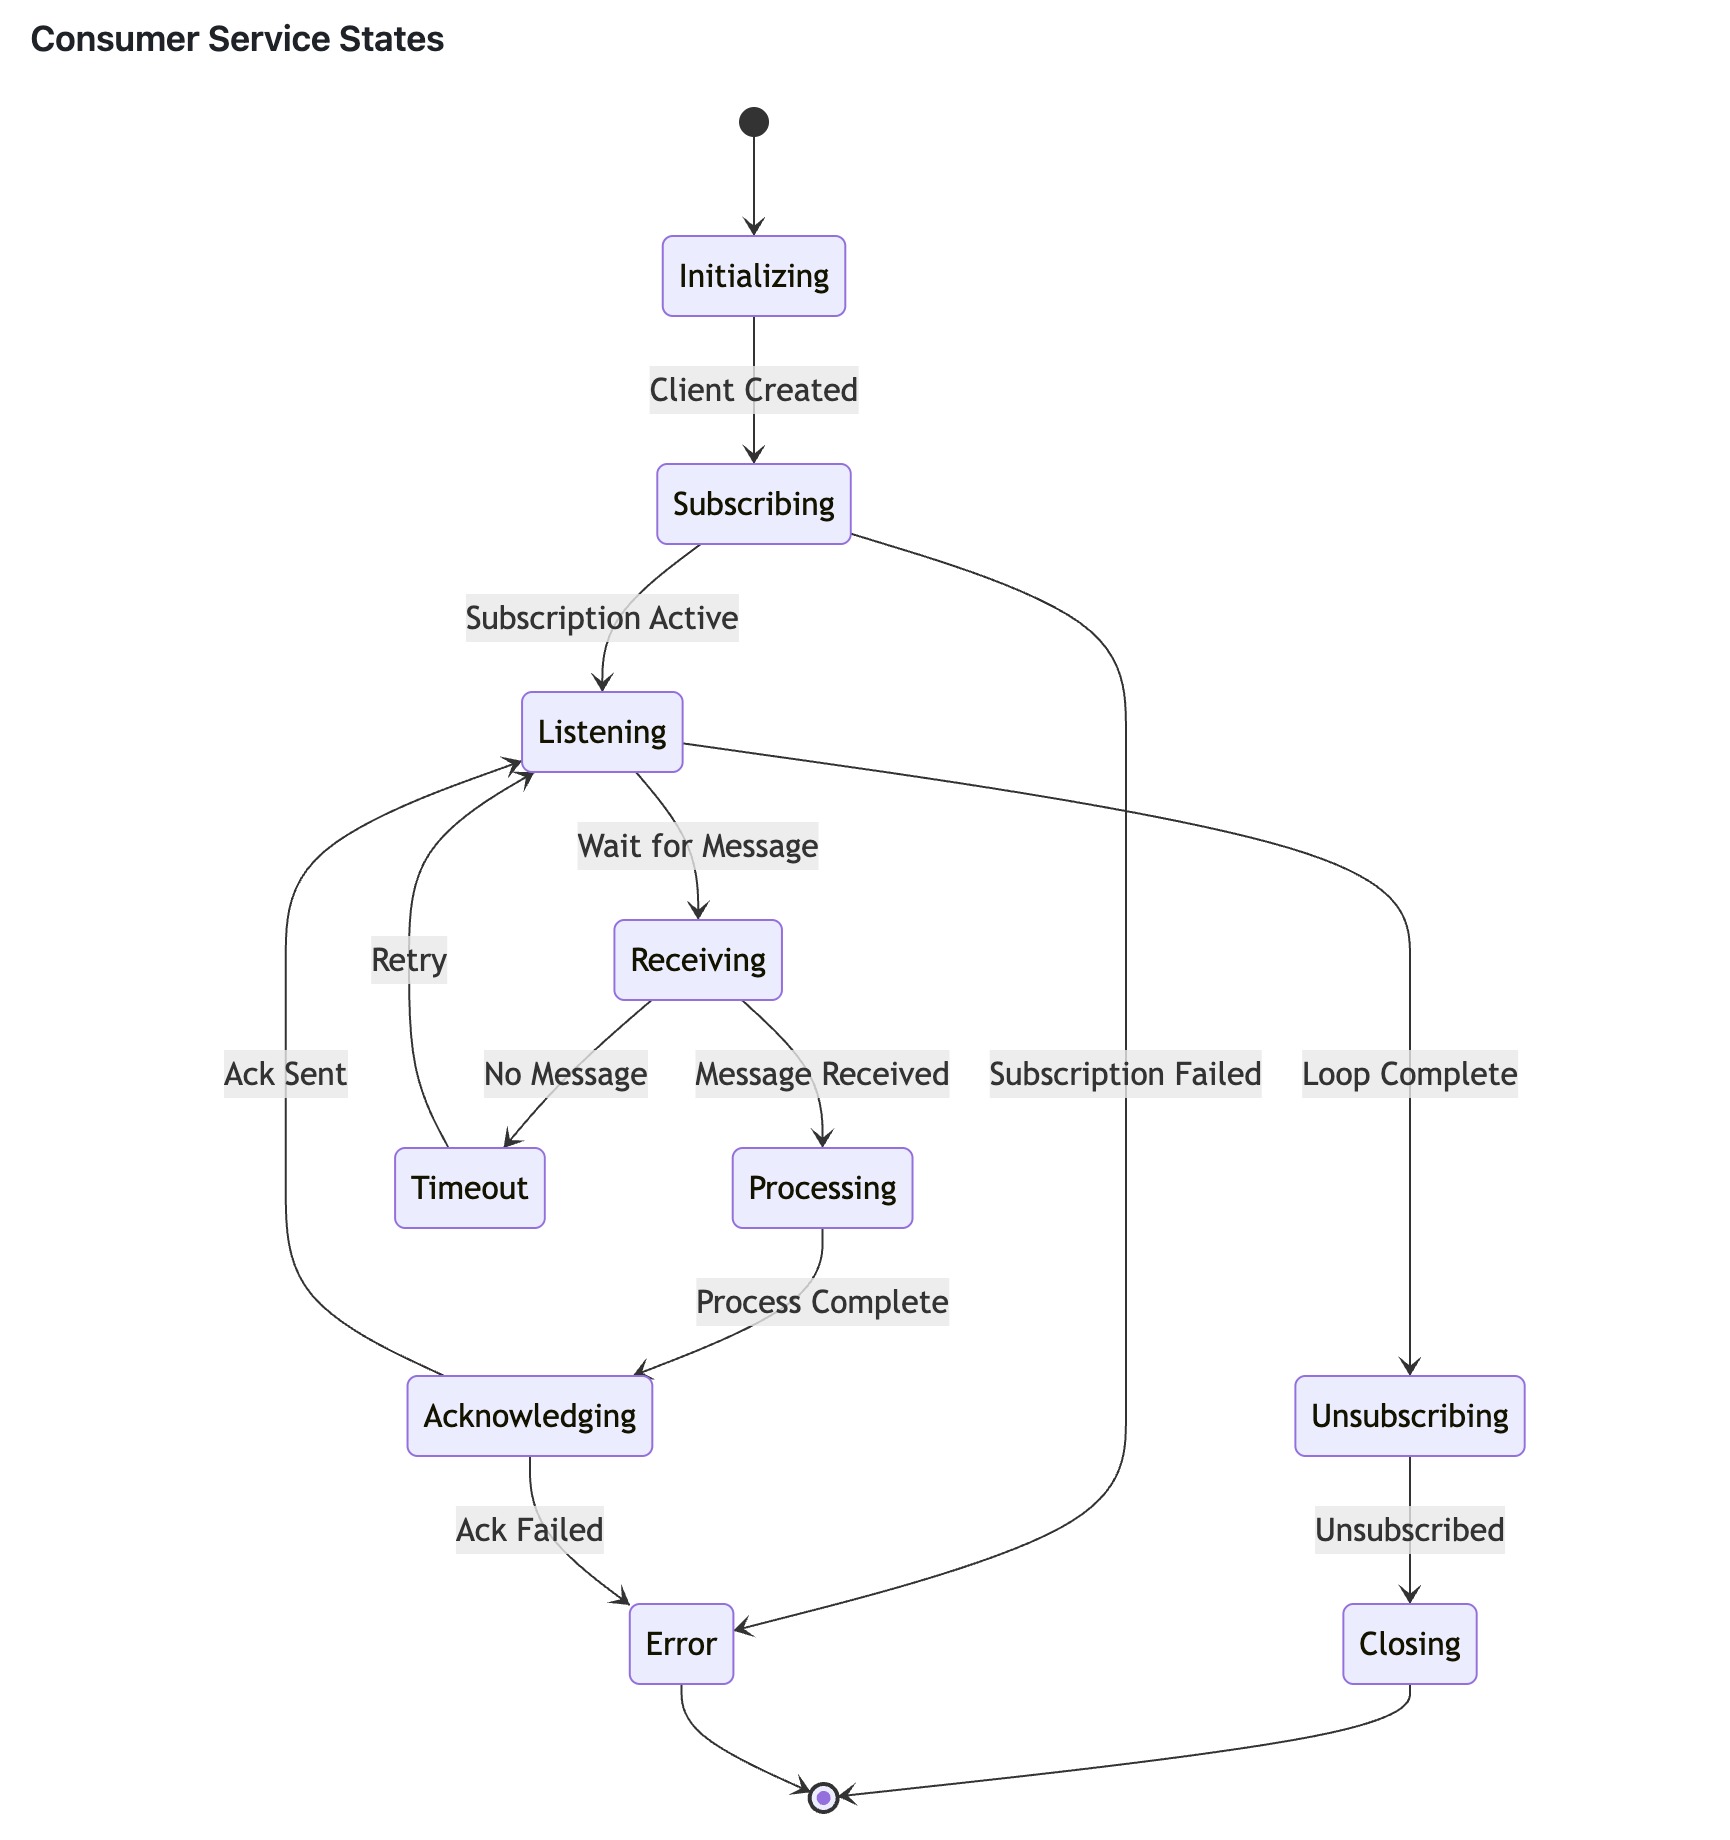
The consumer subscribes to a topic and processes messages with explicit acknowledgment. The subscription type chosen here — `pulsar.Shared` — has meaningful implications for how the system scales.
consumer, err := client.Subscribe(pulsar.ConsumerOptions{
    Topic:            "topic-1",
    SubscriptionName: "my-sub",
    Type:             pulsar.Shared,
})

if err != nil {
    log.Fatal(err)
}

defer consumer.Close()
for i := 0; i < 10; i++ {
    msg, err := consumer.Receive(context.Background())
    if err != nil {
        log.Fatal(err)
    }
    fmt.Printf("Received message with Id: %#v -- content: '%s'\n", msg.ID(), string(msg.Payload()))
    consumer.Ack(msg)
}

if err := consumer.Unsubscribe(); err != nil {
    log.Fatal(err)
}
Subscription Semantics in Depth
Pulsar's subscription model is one of its most differentiating features. Here's how the four types behave at the broker level:
- Exclusive – The broker enforces that only one consumer holds the subscription at any time. A second consumer attempting to subscribe with the same name will receive an error. This guarantees strict message ordering but eliminates horizontal scaling.
- Shared – The broker distributes messages across all active consumers in round-robin order. Any number of consumers can join or leave the subscription dynamically. This is the right choice for stateless workloads where processing order doesn't matter and throughput is the priority.
- Failover – The broker designates one consumer as the active receiver. Others remain connected but idle, ready to take over if the active consumer disconnects. This preserves ordering while providing high availability — a pattern common in financial transaction processing.
- Key_Shared – The broker routes messages with the same key consistently to the same consumer instance. This enables stateful processing (e.g., per-user session aggregation) without external coordination, as long as the consumer count remains stable.
Why Explicit Acknowledgment Matters
`consumer.Ack(msg)` signals to the broker that the message has been durably processed and can be removed from the subscription's cursor. If the consumer process crashes between `Receive` and `Ack`, the broker will redeliver the message to another consumer in the subscription. This is the mechanism behind at-least-once delivery.
For workloads that require exactly-once semantics, Pulsar supports transactional acknowledgment, where the `Ack` and any downstream writes are committed atomically. That's a more advanced topic, but the foundation is the same `Ack` call shown here.
Component 3: The Monitor
The monitor is architecturally the most interesting component. It runs two HTTP servers concurrently — one for the application endpoint, one for Prometheus metrics — and uses a Pulsar producer to generate observable traffic.
package main

import (
    "context"
    "fmt"
    "log"
    "net/http"
    "strconv"
    "github.com/apache/pulsar-client-go/pulsar"
)

func main() {
    client, err := pulsar.NewClient(pulsar.ClientOptions{
        URL: "pulsar://localhost:6605",
    })
    if err != nil {
        log.Fatal(err)
    }

    defer client.Close()
    prometheusPort := 2112

    go func() {
        if err := http.ListenAndServe(":"+strconv.Itoa(prometheusPort), nil); err != nil {
            log.Fatal(err)
        }
    }()

    producer, err := client.CreateProducer(pulsar.ProducerOptions{
        Topic: "topic-1",
    })
    if err != nil {
        log.Fatal(err)
    }
    defer producer.Close()
    ctx := context.Background()
    webPort := 8082
    http.HandleFunc("/produce", func(w http.ResponseWriter, r *http.Request) {
        msgId, err := producer.Send(ctx, &pulsar.ProducerMessage{
            Payload: []byte(fmt.Sprintf("hello-world")),
        })
        if err != nil {
            log.Fatal(err)
        } else {
            log.Printf("Published message: %v", msgId)
            fmt.Fprintf(w, "Message Published: %v", msgId)
        }
    })

    if err := http.ListenAndServe(":"+strconv.Itoa(webPort), nil); err != nil {
        log.Fatal(err)
    }
}
How the Pulsar Client Registers Prometheus Metrics
When `pulsar.NewClient` is called, the Go client automatically registers a set of Prometheus collectors with the default `prometheus.DefaultRegisterer`. No additional instrumentation code is required. The metrics are served at `/metrics` on whatever port you bind `http.DefaultServeMux` to port — in this case, port `2112`.
The metrics exposed include:
- `pulsar_client_producers_opened` / `pulsar_client_producers_closed` – producer lifecycle counters
- `pulsar_client_consumers_opened` / `pulsar_client_consumers_closed` – consumer lifecycle counters
- `pulsar_client_messages_published_total` – cumulative publish count per topic
- `pulsar_client_publish_latency_seconds` – histogram of end-to-end publish latency
- `pulsar_client_bytes_published_total` – total bytes written to the broker
Running the Prometheus metrics server in a goroutine while the main goroutine handles the application HTTP server is idiomatic Go concurrency. Both servers share the same `http.DefaultServeMux`, which is why the Prometheus `/metrics` handler (registered automatically by the client library) is accessible on the metrics port without any explicit route registration.
Prometheus Scrape Configuration
scrape_configs:
  - job_name: pulsar-client-go-metrics
    scrape_interval: 10s
    static_configs:
      - targets:
        - localhost:2112
The `scrape_interval: 10s` is a reasonable starting point for development. In production, you would typically align this with your alerting resolution requirements — a 30-second interval is common for dashboards, while 10 seconds or less is appropriate for latency-sensitive alerting rules.
With these metrics flowing into Prometheus, you can build Grafana panels that surface producer throughput, consumer lag, and publish latency percentiles with three signals that matter most when diagnosing messaging pipeline issues.
Running the Full Pipeline
Prerequisites
- Apache Pulsar standalone
- Go 1.18+
- Prometheus (optional)
Startup Sequence
1. Launch Pulsar in standalone mode:
bin/pulsar standalone2. Start the producer service:
cd producer && go run main.go3. Start the consumer service:
cd consumer && go run main.go4. Start the monitor service:
cd monitor && go run main.go5. Start Prometheus:
prometheus --config.file=prometheus.yml6. Publish a message via the producer endpoint:
curl "http://localhost:8080/publish?msg=test_pulsar_message_publish_event"
# msg successfully published
7. Trigger the monitor producer:
curl http://localhost:8082/produce
# Message Published: (messageId)
8. Inspect raw Prometheus metrics:
curl http://localhost:2112/metrics | grep pulsar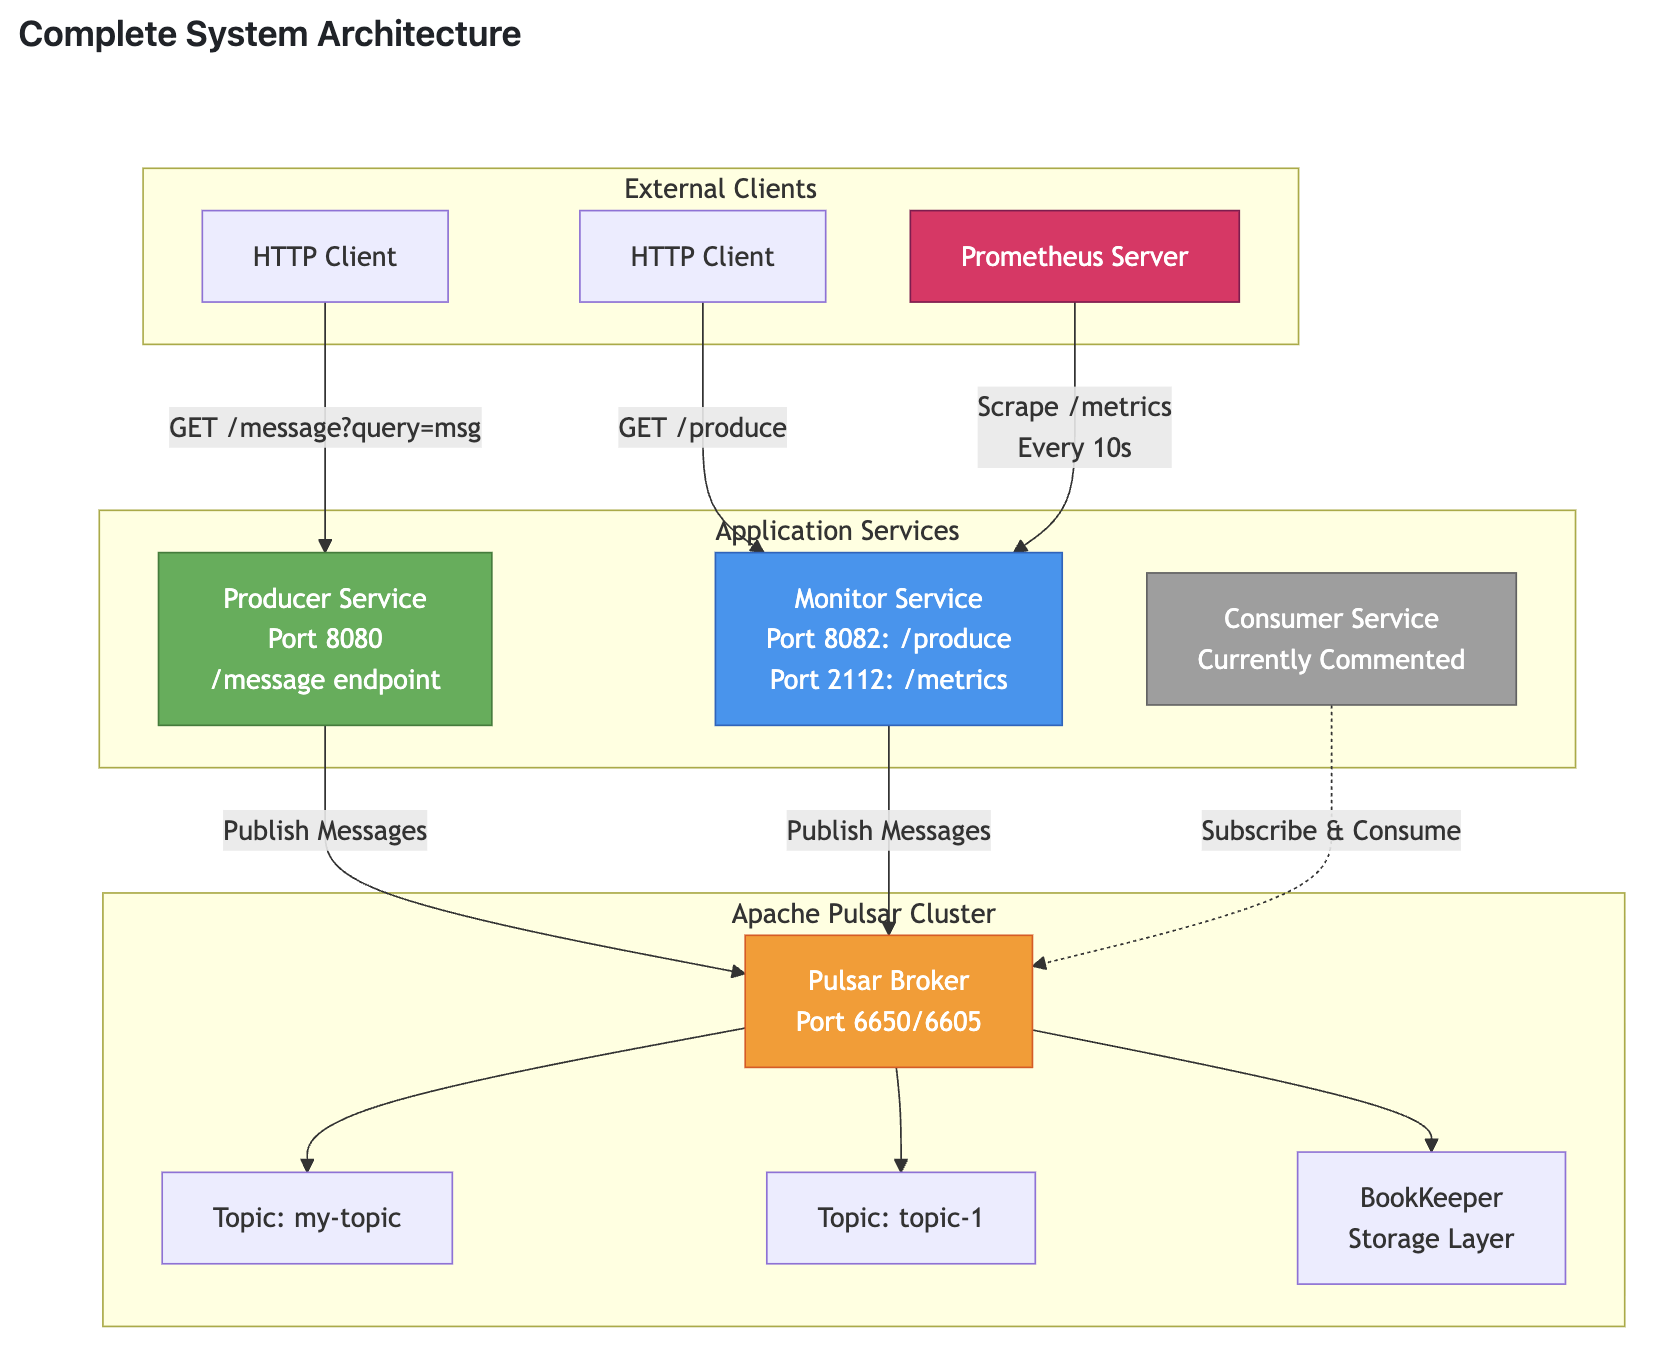
Engineering Takeaways
- Decouple publish triggers from client library dependencies. The HTTP-to-Pulsar adapter pattern used in the producer is not just a demo convenience. It is a legitimate architectural boundary. Services that need to emit events don't need to know anything about Pulsar's protocol, topic naming, or client configuration. They make an HTTP call; the adapter handles the rest.
- Match subscription type to processing semantics, not just throughput. A common mistake is defaulting to `Shared` for everything because it scales horizontally. If your processing logic is stateful, for example, aggregating events per user session. `Key_Shared` gives you the same horizontal scalability while preserving per-key ordering without any application-level coordination.
- Treat the acknowledgment boundary as your consistency boundary. Everything between `Receive` and `Ack` is your processing window. Any side effects (database writes, downstream API calls, cache updates) that happen in this window must be idempotent, because Pulsar will redeliver the message if the consumer fails before acknowledging. Design your processing logic around this constraint from the start, not as an afterthought.
- Zero-cost observability is a genuine advantage. The fact that `pulsar-client-go` registers Prometheus metrics automatically means you get throughput, latency, and connection health data from the moment your application starts, without writing a single line of instrumentation code. This is a meaningful operational advantage over client libraries that require manual metric registration.
Extending the Demo
The current implementation is intentionally minimal. Here are technically meaningful extensions worth exploring:
- Schema enforcement – Replace raw `[]byte` payloads with Pulsar's schema-aware producer/consumer API. Using `pulsar.NewAvroSchema` or `pulsar.NewJSONSchema` moves payload validation to the broker, preventing malformed messages from ever reaching consumers.
- Dead-letter topic routing – Configure `DeadLetterPolicy` on the consumer to automatically route messages that exceed a maximum redelivery count to a separate topic. This prevents poison-pill messages from blocking the subscription indefinitely.
- Producer batching tuning – Set `BatchingMaxMessages`, `BatchingMaxSize`, and `BatchingMaxPublishDelay` on `ProducerOptions` to optimize the throughput/latency trade-off for your specific workload profile.
- Graceful shutdown – Add `os/signal` handling to flush in-flight messages and close the producer cleanly before the process exits. The current `defer client.Close()` handles the happy path but won't fire on `SIGKILL`.
- Kubernetes-native deployment – Package each component as a container and deploy using the official Pulsar Helm chart. The producer and monitor can be exposed as Kubernetes Services; the consumer can run as a Deployment with HPA scaling based on the `pulsar_client_messages_published_total` metric exported to a custom metrics adapter.
Conclusion
The `apache-pulsar` project demonstrates that building a production-grade messaging pipeline with Apache Pulsar and Go doesn't require much code. It requires understanding the right abstractions. The producer-consumer-monitor triad covers the three concerns that matter in any event-driven system: getting data in, getting data out, and knowing what's happening in between.
Pulsar's architecture, decoupled storage, flexible subscription semantics, and built-in observability make it a strong candidate for teams that have outgrown simpler messaging systems and need more precise control over delivery guarantees, scaling behavior, and operational visibility.
Source Code
Opinions expressed by DZone contributors are their own.
Comments