Filebeat vs. Logstash — The Evolution of a Log Shipper
This comparison of log shippers Filebeat and Logstash reviews their history, and when to use each one- or both together.
Join the DZone community and get the full member experience.
Join For FreeAnyone using ELK for logging should be raising an eyebrow right now. How can these two tools even be compared to start with?
Yes, both Filebeat and Logstash can be used to send logs from a file-based data source to a supported output destination. But the comparison stops there. In most cases, we will be using both in tandem when building a logging pipeline with the ELK Stack because both have a different function.
So, why the comparison? Well, people are still getting confused by the differences between the two log shippers. With the introduction of Beats, the growth in both their popularity, and the number of use cases, people are inquiring whether the two are complementary or mutually exclusive. The new Filebeat modules can handle processing and parsing on their own, clouding the issue even further.
This post will attempt to shed some light on what makes these two tools both alternatives to each other and complementary at the same time by explaining how the two were born and providing some simple examples.
In the Beginning, There Was Logstash
Logstash was originally developed by Jordan Sissel to handle the streaming of a large amount of log data from multiple sources, and after Sissel joined the Elastic team (then called Elasticsearch), Logstash evolved from a standalone tool to an integral part of the ELK Stack (Elasticsearch, Logstash, Kibana).
To be able to deploy an effective centralized logging system, a tool that can both pull data from multiple data sources and give meaning to it is required. This is the role played by Logstash — it handles the tasks of pulling and receiving the data from multiple systems, transforming it into a meaningful set of fields and eventually streaming the output to a defined destination for storage (stashing). Sounds great, right?
Well, there was, and still is, one outstanding issue with Logstash, and that is — performance. Logstash requires JVM to run, and this dependency coupled with the implementation in Ruby became the root cause of significant memory consumption, especially when multiple pipelines and advanced filtering are involved.

This pain point became the catalyst of change. Necessity is the mother of invention.
And Along Came Lumberjack (and Later, Logstash-Forwarder)
♫ I’m a lumberjack and I’m ok! I sleep when idle, then I ship logs all day! I parse your logs, I eat the JVM agent for lunch! ♫ (source based on this Monty Python skit)
There’s nothing like a logging lyric to clarify things, hey?
Lumberjack was initially developed as an experiment for outsourcing the task of data extraction and was meant to be used as a lightweight shipper for collecting logs before sending them off for processing in another platform (such as Logstash). Written in Go, the concept behind Lumberjack was to develop a network protocol that would be more efficient in handling large bulks of data, have a low memory footprint, and support encryption.
A dramatic turn of events led to Lumberjack being renamed the Logstash-Forwarder, with the former now constituting only the network protocol and the latter being the actual logging program.
In the Logstash-Forwarder configuration file (JSON format), users configure the downstream servers that will receive the log files, SSL certificate details, the time the Logstash-Forwarder waits until it assumes a connection to a server is faulty and moves to the next server in the list, and the actual log files to track. An example of that configuration:
{
      "network": {
         "servers": [ "10.0.0.5:5043" ],
         "ssl certificate": "/etc/ssl/certs/logstash-forwarder.crt",
         "ssl key": "/etc/ssl/private/logstash-forwarder.key",
         "ssl ca": "/etc/ssl/certs/logstash-forwarder.crt"

 },
   "files": [
    {
              "paths": [ "/var/log/syslog" ],
              "fields": { "type": "iptables" }
    },
    {
              "paths": [ "/var/log/apache2/*access*.log" ],
              "fields": { "type": "apache" }
    }
 ]
}
The Birth of Beats
A second version of the Lumberjack protocol (oddly, with no documentation available on the web) was developed, deprecating Logstash-Forwarder. This new protocol became the backbone of a new family of shippers called Beats.
The key differences between the two versions were support for JSON nesting in a message, better handling of back pressure with efficient window-size reduction, and the ability to ack in mid-window.
The first “beat” was Packetbeat, the developers of which joined Elastic back in May 2015, and Filebeat, heralded as the “next-generation Logstash Forwarder,” was introduced soon thereafter.
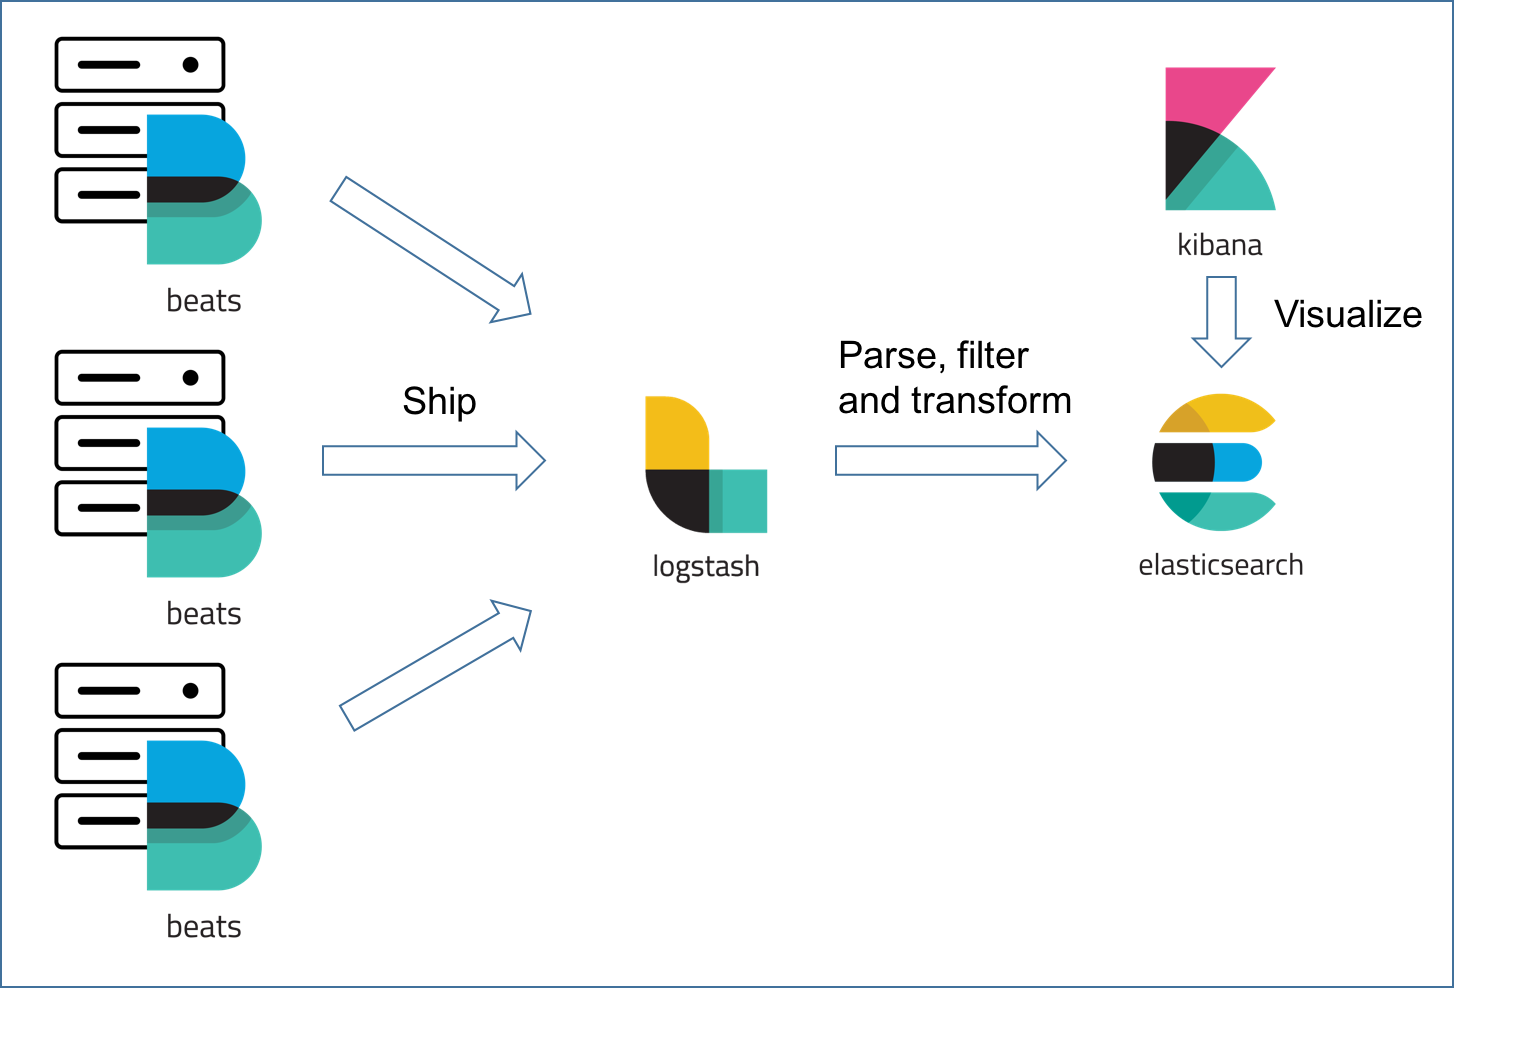
The different Beats are used as lightweight agents installed on the different servers in your infrastructure for shipping logs or metrics (see diagram below). These can be log files (Filebeat), network metrics (Packetbeat), server metrics (Metricbeat), or any other type of data that can be collected by the growing number of Beats being developed by both Elastic and the community.
So…When Do I Use Filebeat and/or Logstash?
The simple answer is — when logging files at least, you will almost always need to use a combination of Filebeat and Logstash. Why? Because unless you’re only interested in the timestamp and message fields, you still need Logstash for the “T” in ETL (Transformation) and to act as an aggregator for multiple logging pipelines.
Filebeat is one of the best log file shippers out there today — it’s lightweight, supports SSL and TLS encryption, supports back pressure with a good built-in recovery mechanism, and is extremely reliable. It cannot, however, in most cases, turn your logs into easy-to-analyze structured log messages using filters for log enhancements. That’s the role played by Logstash.
Logstash acts as an aggregator — pulling data from various sources before pushing it down the pipeline, usually into Elasticsearch but also into a buffering component in larger production environments. It’s worth mentioning that the latest version of Logstash also includes support for persistent queues when storing message queues on disk.
Filebeat (and the other members of the Beats family) acts as a lightweight agent deployed on the edge host, pumping data into Logstash for aggregation, filtering, and enrichment. The relationship between the two log shippers can be better understood in the following diagram:
Example: Apache Access Logs
Apache access logs can be used for monitoring traffic to your application or service.
127.0.0.1 - frank [10/Oct/2000:13:55:36 -0700] "GET /apache_pb.gif HTTP/1.0" 200 2326If you’re using ELK as your logging solution, one way to ship these logs is using Filebeat to send the data directly into Elasticsearch. Since Filebeat ships data in JSON format, Elasticsearch should be able to parse the timestamp and message fields without too much hassle. Not only that, Filebeat also supports an Apache module that can handle some of the processing and parsing.
However, as of yet, advanced log enhancement — adding context to the log messages by parsing them up into separate fields, filtering out unwanted bits of data and enriching others — cannot be handled without Logstash. Moreover, for a number of reasons, and especially in medium- and large-sized environments, you will not want to have each Filebeat agent installed on a host sending off data directly into Elasticsearch.
If Elasticsearch is temporarily unavailable, back pressure to disk is not always a good solution as files can get rotated and deleted. Ideally, you would like to control the amount of indexing connections and having too many may result in a high bulk queue, bad responsiveness, and timeouts. Additionally, Elasticsearch maintenance work that necessitates the pausing of indexing — during upgrades, for example — becomes much more complicated.
So, in most cases, you will be using both Filebeat and Logstash. Filebeat will be configured to trace specific file paths on your host and use Logstash as the destination endpoint:
filebeat.prospectors:
- input_type: log
  paths:
    - /var/log/httpd/access.log

document_type: apache-access
fields_under_root: true

output.logstash:
  hosts: ["127.0.0.1:5044"]
In your Logstash configuration file, you will use the Beats input plugin, filter plugins to parse and enhance the logs, and Elasticsearch will be defined as the output destination:
input {
  beats {
    port => 5044
  }
 }

filter {
  grok {
    match => { "message" => "%{IPORHOST:clientip} %{USER:ident} %{USER:auth} \[%{HTTPDATE:time}\] "(?:%{WORD:verb} %{NOTSPACE:request}(?: HTTP/%{NUMBER:httpversion})?|%{DATA:rawrequest})" %{NUMBER:response} (?:%{NUMBER:bytes}|-)" }
  }
  date {
    match => [ "timestamp" , "dd/MMM/yyyy:HH:mm:ss Z" ]
  }
 }

output {
  elasticsearch { hosts => ["localhost:9200"] }
  }
Summing It Up
Another option for processing logs that is not covered in this article is Ingest Node — an Elasticsearch 5.x feature that allows users to process data before indexing. Documentation and usage examples are somewhat sparse, and from what we have seen until now, we do not recommend using it for heavy transformations. The reasons for this will be discussed in future posts.
Tough configuration, resource consumption, frequent crashes, and difficult troubleshooting have all made Logstash the weakest link in the ELK Stack. Yet despite these flaws, Logstash still remains a crucial component of the stack.
Elastic has made big steps in trying to alleviate these pains by introducing Beats (and adding a visual element to Logstash pipelines in the future version 6.0), which has enabled users to build and configure multiple and resilient logging pipelines — and ultimately make logging with ELK much more reliable.

Published at DZone with permission of Daniel Berman. See the original article here.
Opinions expressed by DZone contributors are their own.
Comments