

Microsoft Foundry Agent Debugging Dashboard with Microsoft Fabric Eventhouse, KQL, Docker and Grafana
Build a Microsoft Foundry agent debugging dashboard using OpenTelemetry, Aspire, Microsoft Fabric Eventhouse, KQL, and Grafana.
 CORE
·
An agent built in Microsoft Foundry makes many decisions in a single run. It calls a model, selects a tool, reads the tool result, and calls the model again. When the answer is slow or wrong, the cause sits somewhere inside that sequence, and the final response gives no hint about which step failed.
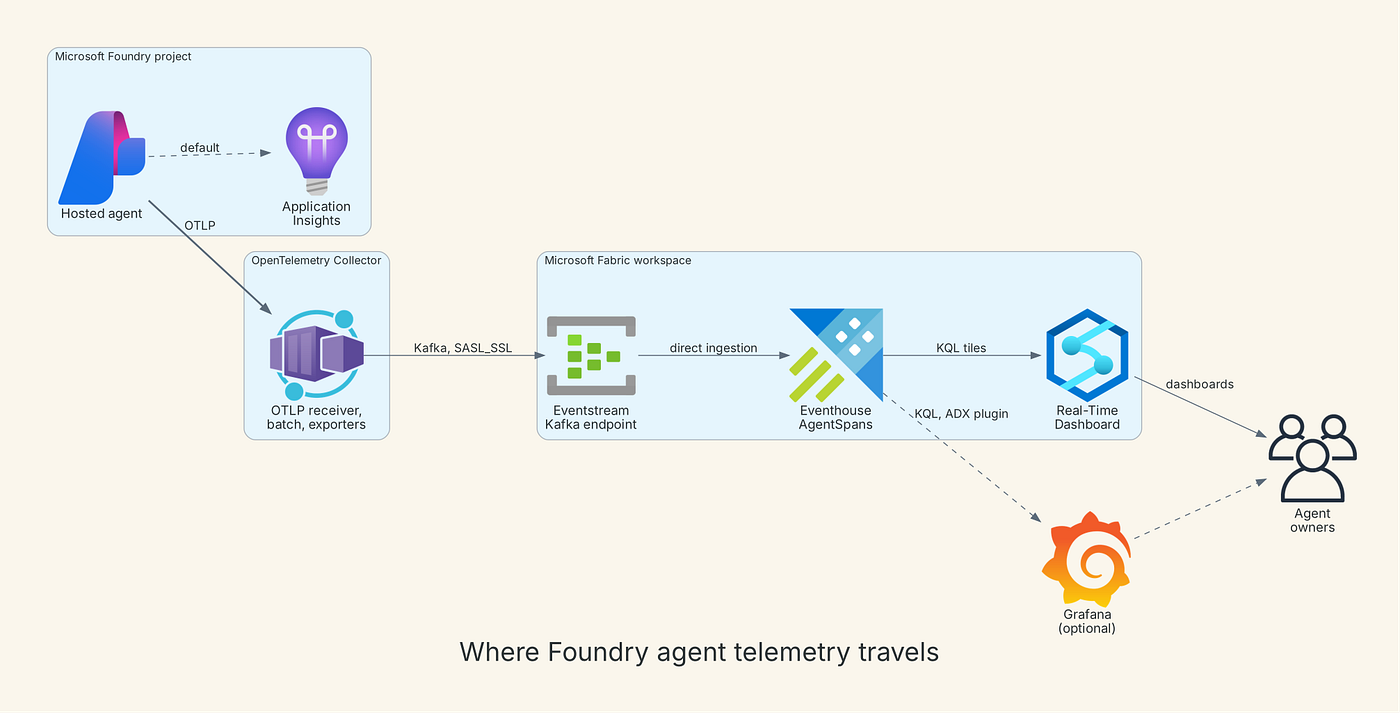
Foundry records this sequence as OpenTelemetry traces. By default, a hosted agent sends them to Application Insights, which is a good place to start. Two gaps remain for a team that builds agents every day. The first gap appears during development. A developer who changes a prompt or a tool wants to see the spans of that one run within seconds, on a laptop, without a deployed project. The second gap appears after deployment. Agent owners want a shared dashboard with run counts, latency percentiles, token use, tool latency, and errors, and they want to query raw spans with the same language they use for the rest of their data.
This article builds a debugging dashboard that covers both gaps with one OpenTelemetry Collector configuration. In development, the collector runs in Docker Compose next to the Aspire dashboard, which displays each trace as a waterfall. In production, the same collector forwards spans to a Microsoft Fabric Eventstream. An Eventhouse stores them, and a Real-Time Dashboard reads them with KQL. Teams that already run Grafana can read the same Eventhouse there as well, and a later section shows that option.
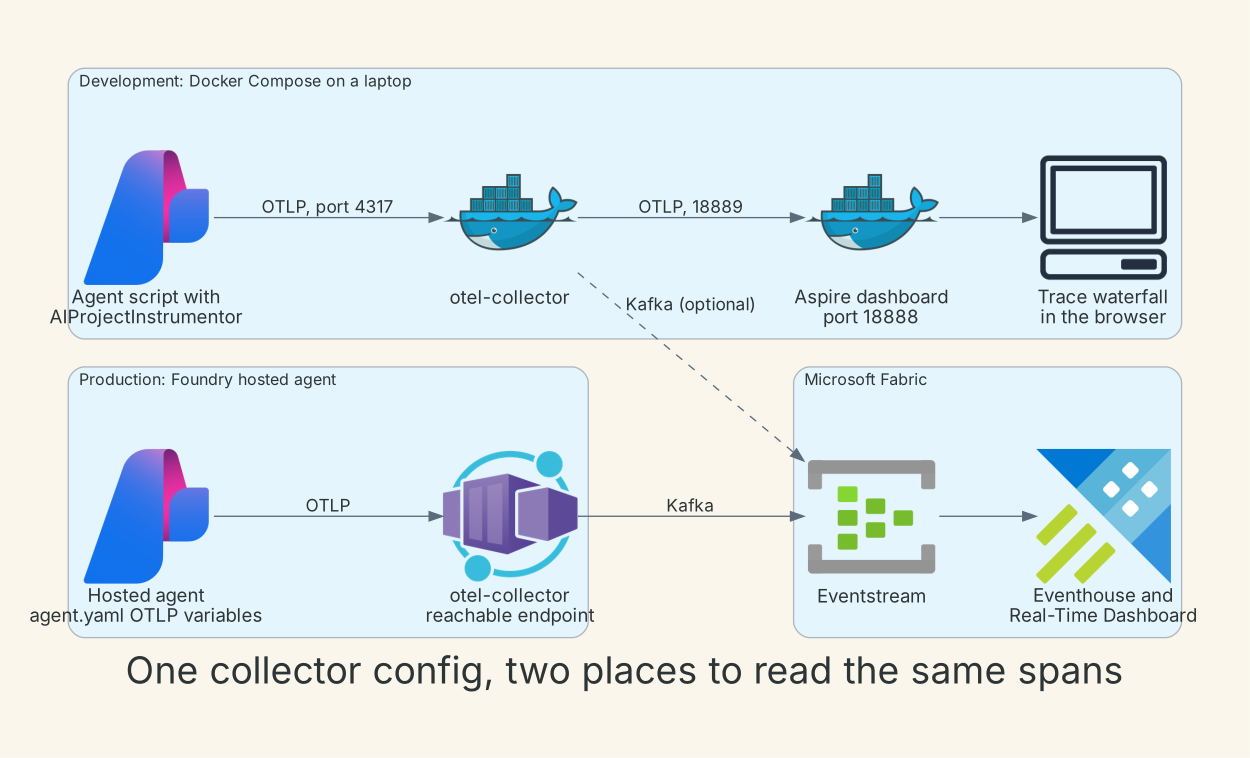
A note on scope before the build starts. The collector configuration and the Compose file in this article were checked for syntax only, and the Fabric steps follow the product documentation. Run each stage against a real project and compare the result with the screenshots described here. The dashboard images in this article use illustrative data.
What a Foundry Agent Emits
Foundry follows the OpenTelemetry semantic conventions for generative AI. These conventions currently have Development status, so attribute names can change between releases. The agent tracing documentation names several span types, which the following table summarizes together with the attributes this article reads.
| Span name | What it covers | Attributes used in this article |
|---|---|---|
invoke_agent |
One complete run of an agent | gen_ai.agent.name, gen_ai.request.model, gen_ai.usage.input_tokens, gen_ai.usage.output_tokens, error.type |
execute_tool |
One tool call made by the agent | gen_ai.tool.call.arguments, gen_ai.tool.call.result |
plan and invoke_workflow |
Planning and workflow steps | Operation specific |
The Foundry documentation does not list every attribute that the service writes on every span. For that reason, the KQL later in this article is a starting point. Open one real span in the Aspire dashboard first, read its attribute names, and adjust the queries if they differ.
Message content is the second point of attention. The environment variable OTEL_INSTRUMENTATION_GENAI_CAPTURE_MESSAGE_CONTENT controls whether prompts and responses are written into spans. Enable it on a laptop when the content is needed to debug a prompt. Leave it disabled for anything that leaves the laptop, because spans sent to a provider other than Microsoft can contain prompt and tool content.
Trace One Agent Run Locally
The client-side tracing path uses the azure-ai-projects package at version 2.0.0 or later, together with the OpenTelemetry SDK and an exporter. Tracing for generative AI is an opt-in feature, so the environment variable AZURE_EXPERIMENTAL_ENABLE_GENAI_TRACING must be set to true before the instrumentor starts.
pip install "azure-ai-projects>=2.0.0" azure-identity opentelemetry-sdk \
    azure-core-tracing-opentelemetry opentelemetry-exporter-otlp
The documentation shows a console exporter and describes the OTLP exporter as a replacement without a full sample. The script below applies that replacement. It creates a prompt agent, sends one request through the Responses API, and exports the spans to localhost:4317, which is the port that the collector will expose.
import os

os.environ["AZURE_EXPERIMENTAL_ENABLE_GENAI_TRACING"] = "true"
os.environ["OTEL_INSTRUMENTATION_GENAI_CAPTURE_MESSAGE_CONTENT"] = "false"
from azure.identity import DefaultAzureCredential
from azure.ai.projects import AIProjectClient
from azure.ai.projects.models import PromptAgentDefinition
from azure.ai.projects.telemetry import AIProjectInstrumentor
from opentelemetry import trace
from opentelemetry.sdk.resources import Resource
from opentelemetry.sdk.trace import TracerProvider
from opentelemetry.sdk.trace.export import BatchSpanProcessor
from opentelemetry.exporter.otlp.proto.grpc.trace_exporter import OTLPSpanExporter
provider = TracerProvider(resource=Resource.create({"service.name": "foundry-agent-local"}))
provider.add_span_processor(
    BatchSpanProcessor(OTLPSpanExporter(endpoint="http://localhost:4317", insecure=True))
)
trace.set_tracer_provider(provider)
AIProjectInstrumentor().instrument()
tracer = trace.get_tracer(__name__)
project = AIProjectClient(
    endpoint=os.environ["FOUNDRY_PROJECT_ENDPOINT"],
    credential=DefaultAzureCredential(),
)
with tracer.start_as_current_span("local-agent-run"):
    agent = project.agents.create_version(
        agent_name="trace-demo-agent",
        definition=PromptAgentDefinition(
            model=os.environ["FOUNDRY_MODEL_NAME"],
            instructions="Answer in one sentence.",
        ),
    )
    client = project.get_openai_client()
    response = client.responses.create(
        input="What does a scheduler heartbeat tell an operator?",
        extra_body={"agent": {"name": agent.name, "type": "agent_reference"}},
    )
    print(response.output_text)
provider.force_flush()
Set FOUNDRY_PROJECT_ENDPOINT and FOUNDRY_MODEL_NAME in the shell, and sign in with the Azure CLI so that DefaultAzureCredential can find an identity. The script runs correctly before the collector exists, but it prints an export warning because nothing listens on port 4317 yet.
Start the Collector and the Aspire Dashboard
The Aspire dashboard is a standalone container that accepts OTLP and displays traces, logs, and metrics. It listens for OTLP over gRPC on container port 18889 and serves its interface on port 18888. The collector forwards to it, so the same spans can later go to a second destination.
services:
  otel-collector:
    image: otel/opentelemetry-collector-contrib:latest
    command: ["--config=/etc/otelcol/config.yaml"]
    environment:
      FABRIC_KAFKA_BOOTSTRAP: ${FABRIC_KAFKA_BOOTSTRAP:-localhost:9093}
      FABRIC_KAFKA_TOPIC: ${FABRIC_KAFKA_TOPIC:-agent-traces}
      FABRIC_KAFKA_CONNECTION_STRING: ${FABRIC_KAFKA_CONNECTION_STRING:-unset}
    volumes:
      - ./otel-collector-config.yaml:/etc/otelcol/config.yaml:ro
    ports:
      - 4317:4317
      - 4318:4318
    depends_on:
      - aspire-dashboard

aspire-dashboard:
    image: mcr.microsoft.com/aspire/dashboard:latest
    environment:
      ASPIRE_DASHBOARD_UNSECURED_ALLOW_ANONYMOUS: "true"
    ports:
      - 18888:18888
  # Optional. Start with: docker compose --profile grafana up -d
  # The Azure Data Explorer plugin is a Grafana Enterprise plugin and needs a license.
  grafana:
    profiles: ["grafana"]
    image: grafana/grafana-enterprise:latest
    environment:
      GF_INSTALL_PLUGINS: grafana-azure-data-explorer-datasource
      GF_ENTERPRISE_LICENSE_TEXT: ${GRAFANA_LICENSE_TEXT:-}
      EVENTHOUSE_QUERY_URI: ${EVENTHOUSE_QUERY_URI:-}
      AZURE_TENANT_ID: ${AZURE_TENANT_ID:-}
      AZURE_CLIENT_ID: ${AZURE_CLIENT_ID:-}
      AZURE_CLIENT_SECRET: ${AZURE_CLIENT_SECRET:-}
    volumes:
      - ./grafana/provisioning/datasources:/etc/grafana/provisioning/datasources:ro
    ports:
      - 3000:3000
The anonymous access variable removes the login prompt, which is acceptable for a dashboard that is reachable only from the local machine. The grafana service belongs to a Compose profile, so it does not start until a later section asks for it. The collector configuration defines two pipelines, one for each destination.
receivers:
  otlp:
    protocols:
      grpc:
        endpoint: 0.0.0.0:4317
      http:
        endpoint: 0.0.0.0:4318


processors:
  batch:
    timeout: 5s
exporters:
  # Local trace viewer
  otlp/aspire:
    endpoint: aspire-dashboard:18889
    tls:
      insecure: true
  # Fabric Eventstream, through its Kafka-compatible custom endpoint
  kafka/fabric:
    brokers:
      - ${env:FABRIC_KAFKA_BOOTSTRAP}
    traces:
      topic: ${env:FABRIC_KAFKA_TOPIC}
      encoding: otlp_json
    tls:
      insecure: false
    auth:
      sasl:
        mechanism: PLAIN
        username: $$ConnectionString
        password: ${env:FABRIC_KAFKA_CONNECTION_STRING}
service:
  pipelines:
    traces/local:
      receivers: [otlp]
      processors: [batch]
      exporters: [otlp/aspire]
    traces/fabric:
      receivers: [otlp]
      processors: [batch]
      exporters: [kafka/fabric]
Several details in this file deserve attention. The exporter name otlp/aspire points at the service name aspire-dashboard on the Compose network, and TLS is disabled for that hop only. The SASL username contains a literal dollar sign, so the collector configuration escapes it as $$ConnectionString. The encoding value otlp_json makes each Kafka message a readable JSON document, which the Eventhouse can ingest without a custom decoder.
Start the stack with docker compose up -d, then run the Python script. A new trace appears at http://localhost:18888 under the service name foundry-agent-local. Select it to see the waterfall, with invoke_agent at the top and its child spans below. The first run is the moment to record the real attribute names for the KQL stage.
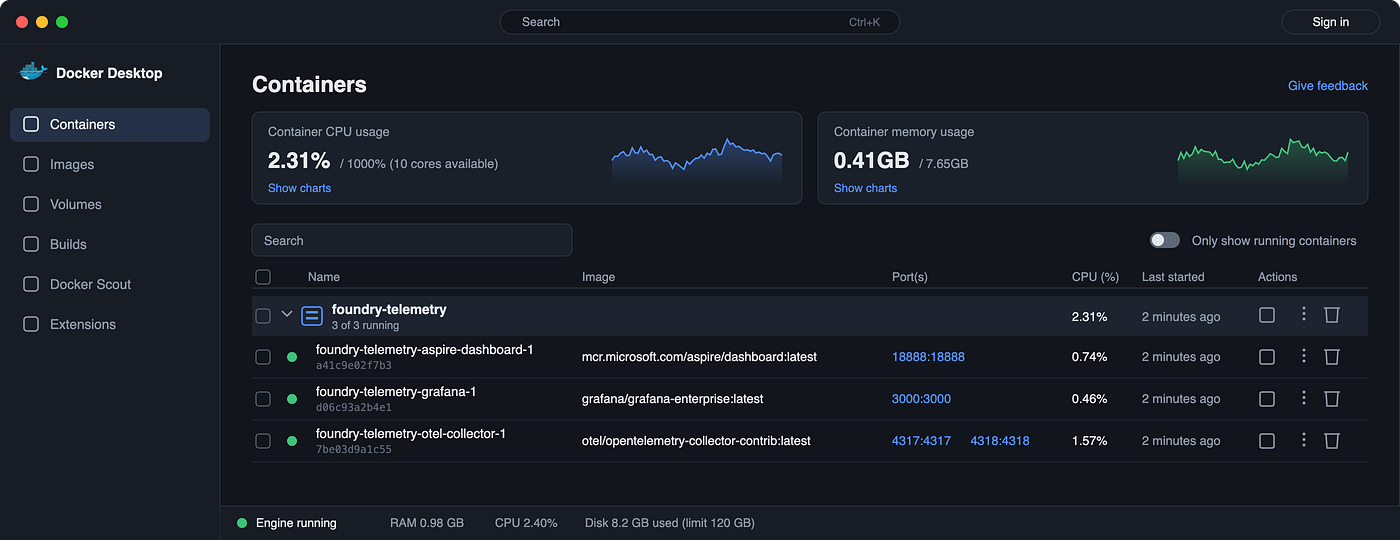
Without Fabric values in the environment, the Kafka pipeline fails to connect, and the collector logs retry messages. The local pipeline continues to work, because each pipeline has its own queue. Comment out the traces/fabric pipeline if the log noise is distracting.
Create the Fabric Eventstream and Eventhouse
The Fabric side has three items. An Eventstream receives the spans, an Eventhouse stores them, and a Real-Time Dashboard displays them. The Eventstream accepts Kafka clients through a custom endpoint source, which is the reason the collector can use its standard Kafka exporter.
- Create an Eventhouse named
agent-telemetry. Fabric creates a default KQL database with the same name. - Create an Eventstream and add a Custom endpoint source.
- Open the source, select the Kafka tab, and choose SAS Key Authentication. The page shows the bootstrap server, the connection string for the primary and secondary keys, and the topic name.
- Copy these values into a
.envfile next to the Compose file.
# Copy to .env and fill in from the Kafka tab of the Eventstream custom endpoint.
FABRIC_KAFKA_BOOTSTRAP=<bootstrap-server-from-sas-key-authentication-page>
FABRIC_KAFKA_TOPIC=<topic-name-from-the-kafka-tab>
FABRIC_KAFKA_CONNECTION_STRING=<connection-string-primary-key>
The Fabric documentation describes the authentication settings as security.protocol of SASL_SSL, sasl.mechanism of PLAIN, a username equal to the literal text $ConnectionString, and the connection string as the password. The collector configuration above maps each of these to its own keys. Copy the bootstrap server exactly as the page shows it, including the port.
Before the Eventstream can write to the Eventhouse, the tables must exist. Run the following script in the KQL query set of the database. It creates a landing table, a typed table for analysis, a function that flattens the OTLP structure, and an update policy that runs the function for every ingested batch.
.create table RawTraces (resourceSpans: dynamic)

.create table AgentSpans (
    Timestamp: datetime,
    TraceId: string,
    SpanId: string,
    ParentSpanId: string,
    Service: string,
    SpanName: string,
    Operation: string,
    AgentName: string,
    Model: string,
    DurationMs: real,
    InputTokens: long,
    OutputTokens: long,
    ErrorType: string
)
.create-or-alter function ExpandAgentSpans() {
    RawTraces
    | mv-expand rs = resourceSpans
    | mv-apply a = rs.resource.attributes on (
        where a.key == "service.name"
        | project Service = tostring(a.value.stringValue)
    )
    | mv-expand ss = rs.scopeSpans
    | mv-expand sp = ss.spans
    | mv-apply a = sp.attributes on (
        summarize attrs = make_bag(bag_pack(tostring(a.key), a.value))
    )
    | project
        Timestamp = unixtime_nanoseconds_todatetime(tolong(sp.startTimeUnixNano)),
        TraceId = tostring(sp.traceId),
        SpanId = tostring(sp.spanId),
        ParentSpanId = tostring(sp.parentSpanId),
        Service,
        SpanName = tostring(sp.name),
        Operation = tostring(attrs["gen_ai.operation.name"].stringValue),
        AgentName = tostring(attrs["gen_ai.agent.name"].stringValue),
        Model = tostring(attrs["gen_ai.request.model"].stringValue),
        DurationMs = (tolong(sp.endTimeUnixNano) - tolong(sp.startTimeUnixNano)) / 1000000.0,
        InputTokens = tolong(attrs["gen_ai.usage.input_tokens"].intValue),
        OutputTokens = tolong(attrs["gen_ai.usage.output_tokens"].intValue),
        ErrorType = tostring(attrs["error.type"].stringValue)
}
.alter table AgentSpans policy update
@'[{"IsEnabled": true, "Source": "RawTraces", "Query": "ExpandAgentSpans()", "IsTransactional": false, "PropagateIngestionProperties": false}]'
.alter-merge table RawTraces policy retention softdelete = 1d
Each Kafka message holds one OTLP export request, so each row in RawTraces holds one resourceSpans array. The function expands that array level by level, reads the service name from the resource attributes, and converts the span attributes into a property bag. OTLP JSON stores every attribute as a typed object, for instance {"intValue": "412"}, which explains why the function reads .intValue and .stringValue separately. The retention policy on RawTraces keeps raw data for one day, because the typed table holds the long-term copy.
Back in the Eventstream, add the Eventhouse as a destination. Select direct ingestion, choose the RawTraces table, and set the data format to JSON. When the mapping page appears, map the top-level resourceSpans field to the single column of the same name. Publish the Eventstream, then restart the collector so that it picks up the .env values.
docker compose up -d --force-recreate otel-collector
python agent_trace_demo.py
Within a minute, the query AgentSpans | take 10 should return rows. When it does not, query RawTraces | take 1 first. An empty landing table points to the Kafka connection, and a populated landing table with an empty AgentSpans points to the update policy or to an attribute name that differs from the one in the function.
Build the Real-Time Dashboard
Create a real-time dashboard in the same workspace and add the Eventhouse database as a data source. Each tile runs one KQL query. The queries below cover the five questions that agent owners ask most often. The first compares load between agents, and the second shows whether latency has changed. The third and fourth show cost and tool health, and the last lists failures.
// Agent runs per 15 minutes
AgentSpans
| where Operation == "invoke_agent" and Timestamp > ago(6h)
| summarize Runs = count() by bin(Timestamp, 15m), AgentName
| render timechart

// Run latency, median and 95th percentile
AgentSpans
| where Operation == "invoke_agent" and Timestamp > ago(6h)
| summarize p50 = percentile(DurationMs, 50), p95 = percentile(DurationMs, 95) by bin(Timestamp, 15m)
| render timechart
// Token use per hour
AgentSpans
| where Operation == "invoke_agent" and Timestamp > ago(24h)
| summarize InputTokens = sum(InputTokens), OutputTokens = sum(OutputTokens) by bin(Timestamp, 1h)
| render columnchart
// Tool calls and their latency
AgentSpans
| where Operation == "execute_tool" and Timestamp > ago(6h)
| summarize Calls = count(), p95 = percentile(DurationMs, 95) by SpanName
| order by Calls desc
// Errors by type
AgentSpans
| where isnotempty(ErrorType) and Timestamp > ago(24h)
| summarize Errors = count() by ErrorType
| order by Errors desc
Two choices in these queries are worth explaining. Latency uses percentiles, because the mean hides slow runs when most runs are fast. Token counts are summed from invoke_agent spans only, so a model call inside a run is not counted twice.
Set the dashboard to refresh every 30 seconds. A tile that shows errors can also be connected to a Fabric Activator rule, which sends a message to a Teams channel when the count exceeds a threshold. That step is optional, and it works on the same AgentSpans table.
Read the Same Data in Grafana
The Real-Time Dashboard is the shortest path, because it needs no extra software. Many teams already operate Grafana for other services, and they prefer to keep agent panels next to those. Grafana can query the Eventhouse with the Azure Data Explorer data source plugin, because an Eventhouse accepts the same KQL queries as an Azure Data Explorer cluster.
One condition applies before any setup. The plugin is a Grafana Enterprise plugin. Its installation page states that it needs an Enterprise license for self-managed Grafana, or a Pro or Advanced plan on Grafana Cloud. If no license is available, the Real-Time Dashboard from the previous section remains the way to read the data.
The Compose file already contains a grafana service in a profile. It uses the Enterprise image, installs the plugin at startup through GF_INSTALL_PLUGINS, and reads a provisioning file that defines the data source.
apiVersion: 1

datasources:
  - name: Eventhouse
    type: grafana-azure-data-explorer-datasource
    access: proxy
    jsonData:
      clusterUrl: ${EVENTHOUSE_QUERY_URI}
      tenantId: ${AZURE_TENANT_ID}
      clientId: ${AZURE_CLIENT_ID}
      defaultDatabase: agent-telemetry
    secureJsonData:
      clientSecret: ${AZURE_CLIENT_SECRET}
    version: 1
The data source authenticates with an app registration. Create one in Microsoft Entra ID and add it as a viewer on the agent-telemetry KQL database in Fabric. Copy the Query URI from the Eventhouse page into EVENTHOUSE_QUERY_URI, and add the tenant ID, client ID, and client secret to the .env file. Whether a service principal can reach an Eventhouse depends on the Fabric tenant settings, so ask a Fabric administrator to confirm that setting before the first attempt.
docker compose --profile grafana up -dOpen http://localhost:3000, select the Eventhouse data source, and use Save and test. A panel then takes the same queries as the Real-Time Dashboard. Replace the fixed ago(6h) filter with the Grafana time macro so that the dashboard time picker controls the range, for example where $__timeFilter(Timestamp). Check the macro names against the plugin documentation for the installed version.
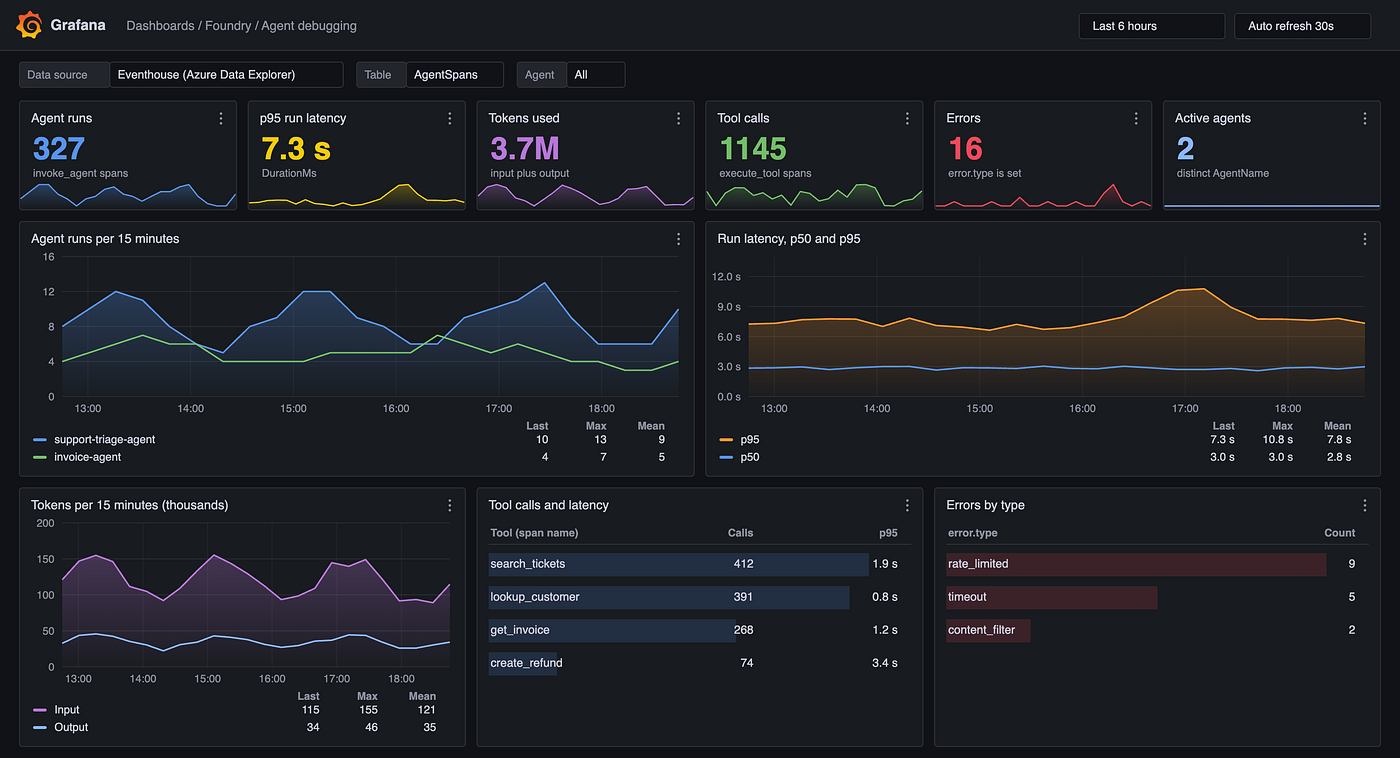
Both dashboards read one table, so the numbers agree. The choice between them depends on where the team already works. The Real-Time Dashboard fits a team that works in Fabric, and Grafana fits a team with an existing alerting and on-call setup.
Send Spans From a Hosted Agent
A hosted agent in Foundry sends telemetry to Application Insights through the connection string that the platform injects. It also exports OTLP when OTEL_EXPORTER_OTLP_ENDPOINT is set. The related variables are OTEL_EXPORTER_OTLP_PROTOCOL, which accepts http/protobuf or grpc, OTEL_EXPORTER_OTLP_HEADERS, and OTEL_TRACES_SAMPLER. These variables belong in the environment_variables section of the agent definition.
environment_variables:
  OTEL_EXPORTER_OTLP_ENDPOINT: https://<collector-host>
  OTEL_EXPORTER_OTLP_PROTOCOL: http/protobuf
  OTEL_EXPORTER_OTLP_HEADERS: ${{connections.otel-secrets.credentials.otlp_headers}}
The headers value usually carries a credential, so the documentation stores it in a custom keys connection and references it, as the last line shows. Check the hosted agent telemetry page for the exact agent definition schema before the first deployment.
Several constraints shape the design. Environment variables are fixed for each agent version, so a change to the endpoint requires a new version. The service.name value always equals the agent name. OTLP export does not disable Application Insights, and project monitoring must be turned off for an OTLP-only setup.
The collector must also be reachable from Foundry. A container app with HTTPS ingress is one option, and the same otel-collector-config.yaml works there with the receiver on port 4318 and the Aspire exporter removed. Add authentication to the receiver before exposing it, because an open OTLP endpoint accepts spans from any sender.
Where This Leaves You
The local stack answers the question a developer asks after every change: what happened inside this run. The Fabric stack answers the question an owner asks every morning: how the agent behaved overnight. Both read the same spans from the same collector, so a pattern found on the dashboard can be reproduced on a laptop with a matching input.
Two limits apply. The attribute names come from a convention still in development, so the flattening function is the only place to adjust after a platform update. Eventstream and Eventhouse also consume Fabric capacity, so review the sampler setting for high-volume agents.
References
- Trace an agent in Microsoft Foundry (client-side tracing)
- Configure telemetry for hosted agents in Microsoft Foundry
- Agent tracing concepts in Microsoft Foundry
- Consume events from a Fabric Eventstream with the Kafka endpoint
- OpenTelemetry Collector Contrib: Kafka exporter
- Aspire standalone dashboard
- Azure Data Explorer data source for Grafana: installation
- Azure Data Explorer data source for Grafana: configuration
Published at DZone with permission of Jubin Soni, FBCS. See the original article here.
Opinions expressed by DZone contributors are their own.