Garbage Collection Analysis: OpenJDK and GraalVM
In this article, we will be discussing and analyzing the garbage collection mechanisms of GraalVM and OpenJDK.
Join the DZone community and get the full member experience.
Join For FreeIn this article, we are going to compare the performance of the Garbage Collection(GC) of OpenJDK and GraalVM. GraalVM is a popular open-source JVM implementation in Java with the capability to run applications as native images. Apart from that, it has got other functionalities such as fast loading time, compacted memory usage, etc.
In this article, we will compare the garbage collection details of GraalVM and OpenJDK.
Garbage Collector in GraalVM
GraalVM's concurrent, generational, mostly copying collector is efficient, scalable, and minimizes pauses. It divides the heap into young and old generations, collecting the young more frequently to improve performance. The copying collector moves live objects to a new part of the heap, further improving performance.
Precision Time Calculator Application
This application pulls out time from open time servers such as time.google.com and time.facebook.com. Then, it calculates the average time required to get this time from these time servers. This average time is calculated based on the current system time. If this average time is different from the open time server time, then the application is displaying messages on the console. This application creates a thread for each time server. Take a look at the startMonitor() method for more information.
Here is the link for the code.
Here, each thread runs in a while loop, gets the time from the open time servers, and displays the information continuously.
Study Garbage Collection Behavior
Now, let's run this code using OpenJDK version 17.0 and GraalVM 17.0 community edition using IntelliJ IDE for about one hour. We are running it because of how much the application is going to be stable when it runs in production for a longer time. Also, we take the garbage collection for analysis by enabling GC logging.
Enable GC Logging
It is very easy to enable GC logging in the IntelliJ IDEA editor. We can do this by passing a switch to the JVM arguments when we run the above code.
- -XX:+PrintGCDetails -Xloggc:openjdk-gc.log
- -XX:+PrintGCDetails -Xloggc:gc_graal.log
After these operations are finished, there will be two GC logs at the root of the application. We will upload these logs into the GC log analysis tool gceasy for further analysis.
Garbage Collection Metrics
There are three main key process indicators in the gceasy.io report. They are:
1. Throughput
2. Latency
3. FootPrint
We are going to analyze mainly the GC throughput and latency indicators in this report.
Throughput is the amount of work completed by the application to run the transactions in a given time. Latency is the amount of time taken by one single Garbage collection event to run. This indicator should be studied from three aspects. They are listed below:
- Average GC time
- Maximum GC time
- GC Time distribution
Note: You will get more details about these topics from the website.
First, we will take a look at the Throughput indicator. Below are the throughputs of OpenJDK and GraalVM.
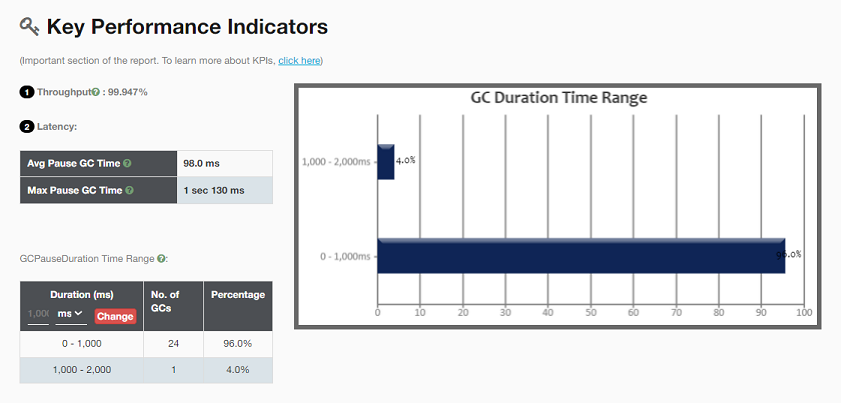
OpenJDK GC KPI generated by gceasy.

GraalVM GC KPI generated by gceasy.
1. Throughput of the Application
From the above images, the gceasy tool provides accurate information about the status of the application. The GC throughput is 99.947%. Garbage Collection throughput indicates what percentage of the application's time is spent in processing customer transactions and what percentage of time is spent in the garbage collection activities. For example, if someone says the application's GC throughput is 99.947%, it means the application spends 99.947% of its time processing customer transactions and the remaining 0.053% of the time processing Garbage Collection activities. A high GC throughput is desirable as it indicates that the application is efficiently utilizing system resources, leading to minimal interruptions and improved overall performance.
We ran our code for one hour, and the application is performing most of the time. We can say the overall health is very good.
2. Latency of the Application
This is the overall time taken by the GC event to run the garbage collection process. One thing you have to remember here is that the lesser the value is, the better. If the average pause time is high, we need to understand that the application is taking more time to remove the garbage.
3. GraalVM GC Performance
But, we are going to analyze the latency and pause time from the gceasy reports. Latency is mainly represented based on GC pause time. There are other KPIs in the report, but we are focusing mainly on GC pause time because the throughput is almost the same for both OpenJDK and GraalVM.
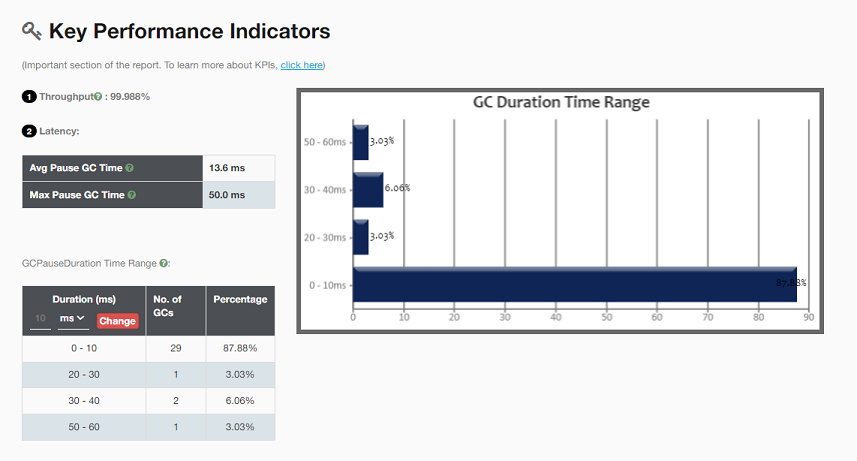

In the above report, we can see that the throughput is slightly greater than OpenJDK.It is not a big difference here. The performance of OpenJDK is almost the same as GraalVM. But if you take a look at the latency, the average pause time is very low compared to the OpenJDK's. This means that GraalVM is removing garbage quicker than OpenJDK.So, we need to understand why there is a low value in the case of GraalVM. This is because GraalVM uses a better garbage collector. We will check one more metric to understand this behavior. It is called 'Pause Time'.
The Pause Time indicates that the time required to pause the application while performing the garbage collection process. During garbage collection, the application will pause until GC activity is over. This time is called Pause Time.

Above is the pause time for GraalVM. In the case of the GraalVM, this value is 450 ms.
OpenJDK GC Performance
Now, we will analyze the pause time for OpenJDK. Look at the screenshot below for the Pause time.

This value is very high in the case of OpenJDK, which is 2 secs 450 ms.
The Results in Summary
From the above results, we can see that the GC mechanism is more mature in the case of GraalVM. It is able to remove unreachable objects quickly as compared to the OpenJDK. You will get more information about the Garbage Collectors from the GC reports, and based on this data, it is possible to take your application to the next level.
Links to the report are given below:
Note: Please note that the objective of this article is to understand the differences in the GC behaviors of the two different JDK platforms.
Conclusion
We have analyzed the throughput and latency for two different JDK platforms. The overall health of these two applications is very good. However, when comparing the different KPIs, the latency of the application is found to be more promising in the case of GraalVM. The gceasy.io report reveals a lot of information about the GC process.
Published at DZone with permission of Unni Mana. See the original article here.
Opinions expressed by DZone contributors are their own.
Comments