An Introduction to Load Testing With Gatling
A new open source weapon for load testing has emerged, (Gatling) guns blazing!
Join the DZone community and get the full member experience.
Join For FreeTesting is the most crucial part of an application development process to ensure high-quality, impeccable features. Therefore, along with the standard, integration, functional, and load tests, browser tests are also important in a company’s testing strategy. After developing the application, the substantial final task is to write and implement load tests.
To perform the load tests efficiently, a new tool, known as Gatling Tool, has been preferred by many organizations. Gatling is an open-source load testing framework for analyzing and measuring the performance of applications. It is an easy-to-install tool where simulations and scenarios are coded in a simple domain-specific language (DSL). An attractive point of this tool is that you can just define and write up your performance test scenarios in a similar way to other test automation frameworks. You can thus generate readable and easy to maintain performance test code.
Positives
- High performance
- Scenario recorder and developer-friendly DSL
- Ready-to-present HTML reports
Supported Technologies
- HTTP
- JMS
- WebSockets
- Server-sent events
Keeping it Portable
- Gatling’s installation process is simple and doesn’t require machine-by-machine basis installation. Gatling libraries are available from a Maven repository.
- Gatling is built on Scala, and the simulations also must be written in Scala
- Gatling also provides us elegant and meaningful reports that are easy to analyze and understand what exactly is going on with the application.
- Gatling integrates easily with Jenkins through the Jenkins-plugin and runs your tests through Gradle and Maven with the help of maven-plugin and gradle-plugin.
Let’s Have Deeper Look
Basically, Gatling can be structured in 4 different parts:
- HTTP protocol configuration — This defines the base URL that runs against your tests. Also, you can define other configurations such as user agent, language header, connection, and so on.
- Headers definition — This provides the headers with a request that has to be sent to the server. This is relevant because the headers add a bit of a load on servers that are testing.
- Scenario definition — The core of your test! A Scenario includes a group of actions (like GET, POST, etc.) that are executed to simulate user’s interaction with the application.
- Simulation definition — This defines the load (number of users) that concurrently executes your scenario for a period.
Simulation
A simulation is a description of the load test, which describes how user populations runs; which scenario they execute and how new virtual users are injected. Here is an example of simulation definition:

Steps to Install Gatling
Step 1
Download Gatling <Gatling 2.1.7 latest> based on your operating system (you need to have a JDK installed for Gatling; it requires, at least, JDK7u6)
Step 2
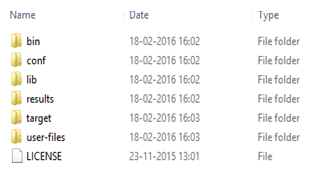
Extract zip and navigate to the <D:\gatling-charts-highcharts-bundle-2.1.7\bin> and run recorder (recorder.bat)

Step 3
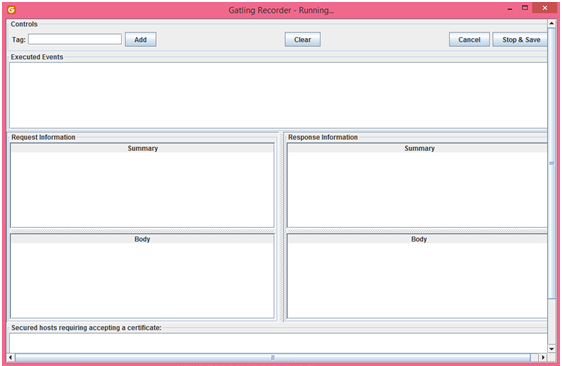
Once the recorder is launched, the following GUI lets you configure how requests and responses are recording.

Step 4
Configure the recorder. All you need to do is start recorder and configure your browser to use Gatling Recorder’s proxy.
Step 5
Recording the scenario:
- Browser your application URL
- When you open the application, it will automatically start running the scenario
- When the scenario playing is finished, click stop in the Recorder interface
Note: Try to act like a real user. Don’t jump from one page to another immediately without taking the time to read. This will make your scenario closer to real users’ behavior.
Step 6
The Simulation will get generate in the folder user-files/ simulations/ computer database of your Gatling installation, under the name BasicSimulation.scala.
Step 7
Running Gatling:
- Launch the script located in the bin directory:
- On Windows: %GATLING_HOME%\bin\gatling.bat
- On Linux/Unix: $GATLING_HOME/bin/gatling.sh
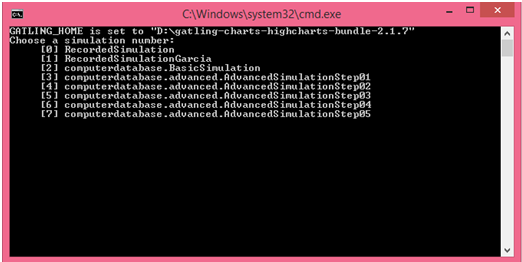
- You will see a menu with the simulation
- Choose a simulation number (it depends on your stimulation name):
[2] computerdatabase.BasicSimulation
Step 8
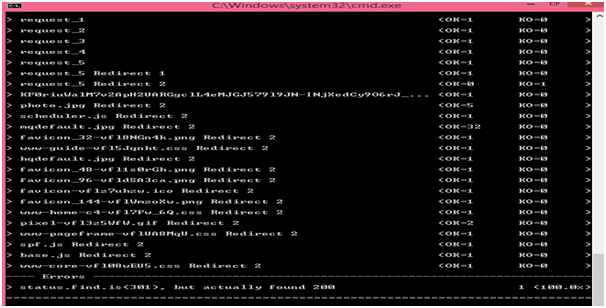
When the simulation is finished, the console will display a link to the HTML reports
Analysis
Reports will be generated in the Results folder:
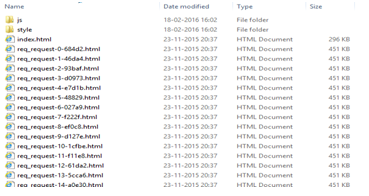
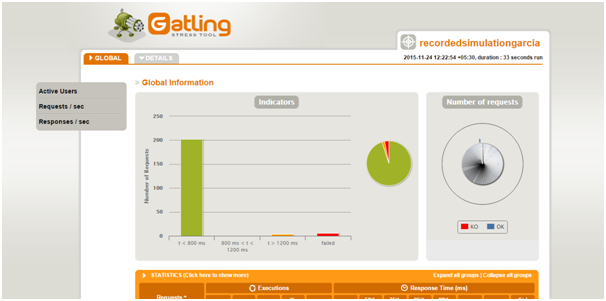
Gatling gives a complete analysis of each and every request with graphical representation (charts) in HTML files. Hence, they are portable and can be viewed on a web browser of any device.
Reports give us these details:
- Active users over time
- Response time distribution
- Response time percentiles over time
- Requests per second over time
- Responses per second over time
For More information please visit: http://vmokshagroup.com/
Opinions expressed by DZone contributors are their own.

Comments