Prediction Zone: Using R With Shiny
Sibanjan Das offers up a tutorial for building a web-based cluster and prediction analysis application through using R with the open source Shiny framework. Oh yeah, and he embedded the app directly into this DZone article... shine on you crazy data scientist.
Join the DZone community and get the full member experience.
Join For FreeThis time we have an interactive article for you. There's an embedded application in this article, right here below this paragraph. It's built from R in conjunction with the Shiny framework. With the app, you can upload your text (.csv) files, then do clustering analysis and view predictions using your own uploaded data.
The app isn't perfectly functional and is more of a proof of concept than anything else. The main idea here is to show you how Shiny and R can work together.
Note: This app is hosted on shinyapps.io with a monthly limit of free 25 hours. So, if the app below is not rendered, please leave a note in the comment section and we will buy some extra hours.
Instructions and Limitations for This Application:
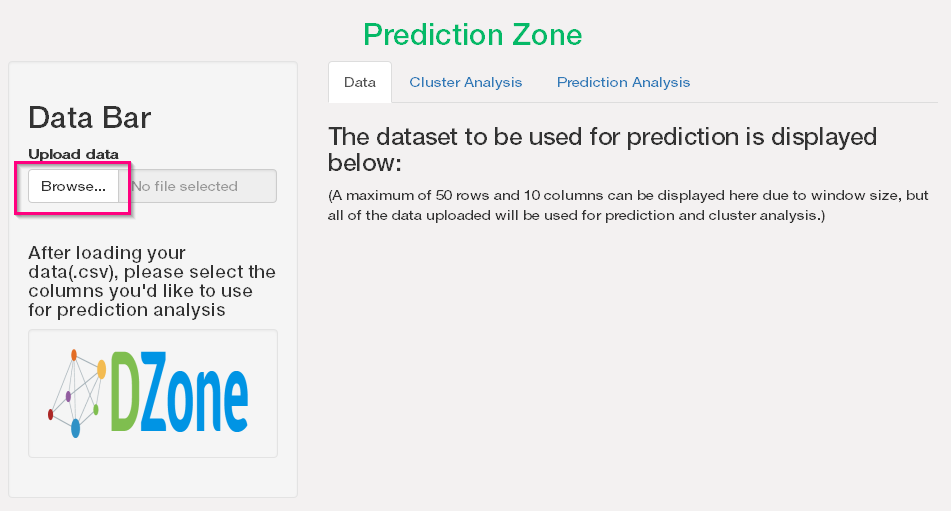
1) Upload a comma separated file (.csv) preferably with available headers. The header row is used for column names displayed as below. For now, we are now limited to using only .csv files but I plan on adding more data sources in the future.

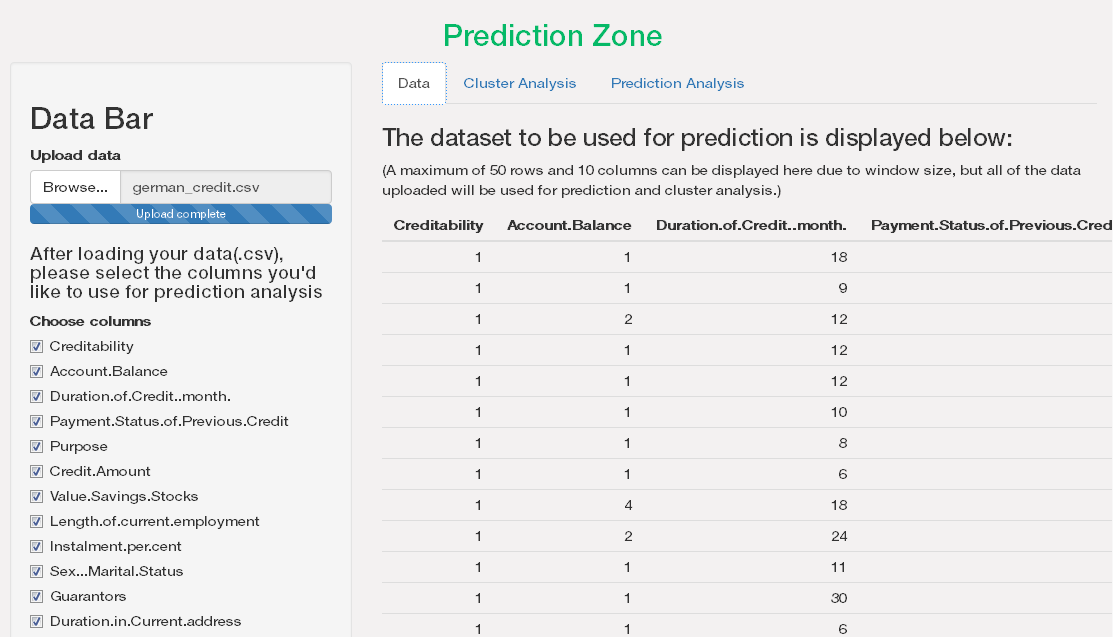
2) Once uploaded, you can view the column names and see a snapshot of the uploaded data. This is to provide just a glimpse if the data uploaded correctly.

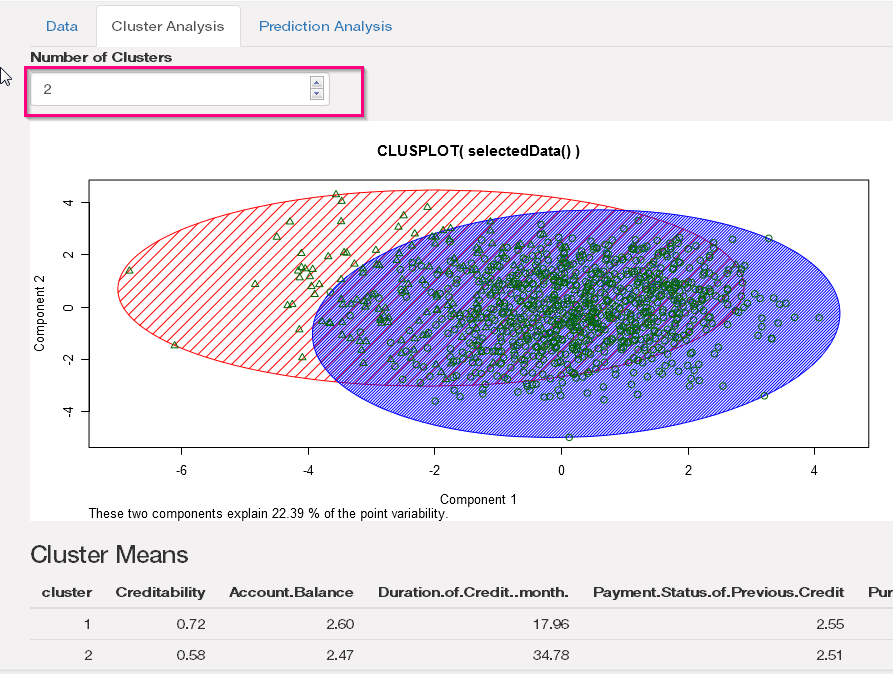
3) Now, navigate to the Cluster Analysis tab and create clusters. You can change the number of clusters to dynamically create new clusters and view results instantaneously.

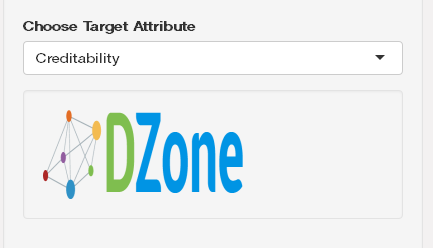
4) The Prediction Analysis tab details the predictions for the unknown targets. You can choose the target column of your choice to predict its value.

5) Remember, to accomplish this, you need to have few unknowns, i.e. nulls for target columns in your .csv file. For example, we had set Creditability (the target column) to null for 4 records in the example german credit data set (Figure Below).

6) The results returned predicted creditability for those four records (Figure Below).

Again, this application is not perfectly functional and is only a skeleton app. It lacks many functions required to have automated prediction. We will develop it further in stages. However, I've deployed it here to get suggestions and drive contributions to make it better. The code can be pulled from my GitHub repo. Please check out and contribute!
Why Are Shiny and R a Winning Combination?
R is vert popular and arguably has become the most preferred tool for Data Science and Analytic exercises. However, what it lacks is a GUI experience. R users typically had to work with web developers to give flesh to the structures that they prepared. This limited the capability of R to be used for many projects as using R also involved integration with some other visualization tools or web applications. With Shiny, now R developers can generate interactive web pages directly with many prebuilt widgets available as R functions. Though we aren't going to provide flashy websites through using Shiny, it is user-friendly enough to publish the model results as web pages and interactive enough for users to play with the results without code changes.
Benefits of Using Shiny:
1) Ability to use all R functionality and packages without any constraints.
2) Open-source R and JavaScript help to create highly customizable applications.
3) Can expose model parameters using controls like sliders, text fields, and drop-down lists.
4) For primary use-cases, only having R knowledge is enough to get by.
5) Easy to handle events using reactive components.
6) Quickly deploy and share Shiny applications.
Installation
Shiny can be installed in R using standard package installation with: install.packages("shiny")
Shiny has two components: ui and server. You can define a Shiny app by creating a single file with a name app.r (The name is important or else it will not be recognized as a shiny app.) and defining shinyApp(ui = ui, server = server) in the last line of the file.
Another good way is to separate the UI and server code into two files: ui.R and server.r
This modularization helps to manage the separate code bases as the applications are sometimes very complex.
Note: Below is a simple example for illustration purposes to quickly get you started using Shiny and building out nice apps like our 'Prediction Zone.'
Structure
The shiny applications execute the following steps:
- The interface is generated by
ui.R. - The input is passed to
server.R,the data is processed inserver.R, and it returns the output which is displayed back in the browser.
ui.r
The UI is the web page a user gets to see. It defines the layout and appearance of the shiny application.
The function fluidPage creates the display that automatically adjusts to the dimensions of the browser. sidebarLayout() places inputs on the left (or right, optionally) and the main output section in the middle. sidebarPanel() will usually contain the input widgets, while mainPanel()sets up the output window.
The textOutput and plotOutput are basically used to capture the results returned after data processing in the server. To learn about the UI components, follow this RStudio Shiny tutorial.
# ui.R
library(shiny)
shinyUI(fluidPage(
  titlePanel("Simple Shiny Application"),
  sidebarLayout(
    sidebarPanel(
      p("Shiny Demo App"),
      selectInput("x", "Select X axis",choices = c("Gender","Dept"))
    ),
    mainPanel(
          h4(textOutput("graph_vars")),
         plotOutput("plotgraphs"))   )
  ))
server.r
The server is responsible for the processing logic in the app. The server.R script contains the instructions and code that are to be performed as per the supplied data and options selected by the users. All of the logic necessary to prepare a graph, data summarization, or create machine learning models goes in here.
# server.R
uca_admit <- UCBAdmissions
shinyServer(function(input, output) {
     output$graph_vars <- renderText(paste("Admit ~", input$x))
    output$plotgraphs <- renderPlot(
        plot(as.formula(paste("Admit ~",input$x)),data=uca_admit))
})
Execute
To execute a shiny app locally, you can use the runApp command. Make sure to invoke the library(shiny) before executing this command.
library(shiny)
runApp("F:/git/shiny/dummyapp")
Wrap Up
Alright, so we prepared a sample app and then ran it from our local machine. Now, deploying it in a shiny server should be easy and can be done in minutes... so long your deployment packages are error free! To know the various options to deploy the shiny app, you can view the Rstudio's Shiny Hosting and Deployment page. The code for this task is present in my GitHub Repo.
Opinions expressed by DZone contributors are their own.

Comments