Graph Augmented Intelligence and XAI
The need for innovation to address the problems we are facing is the trend we are seeing, and we need the convergence of AI and Big-Data.
Join the DZone community and get the full member experience.
Join For FreeThere are broad-spectrum real-world applications that can be powered by graph technologies. Social networks dwell on graphs that best model how people follow and befriend each other; Biotech and pharmaceutical companies leverage graphs to understand protein interactions and chemical compounds efficacies; Supply chains, telco networks, and power grids are naturally presented as graphs for root-cause analysis; Financial transactions naturally form networks and fraud detections, smart recommendations or asset-liability management are possible to run across these networked data for improved productivity, prediction accuracy or business intelligence. Many industries are looking to graph’s smart (and deep) data processing capabilities to help with their businesses.
The big-data era started around 2010, as more and more industries are interested in machine learning (and deep learning and AI) to boost their business predictability; some have been using deep learning and specifically varied neural networks to extract more predictive powers. There are three major problems lingering around, though:
- Siloed Systems within AI Eco-system;
- Low-Performance AI;
- Black-Box AI.
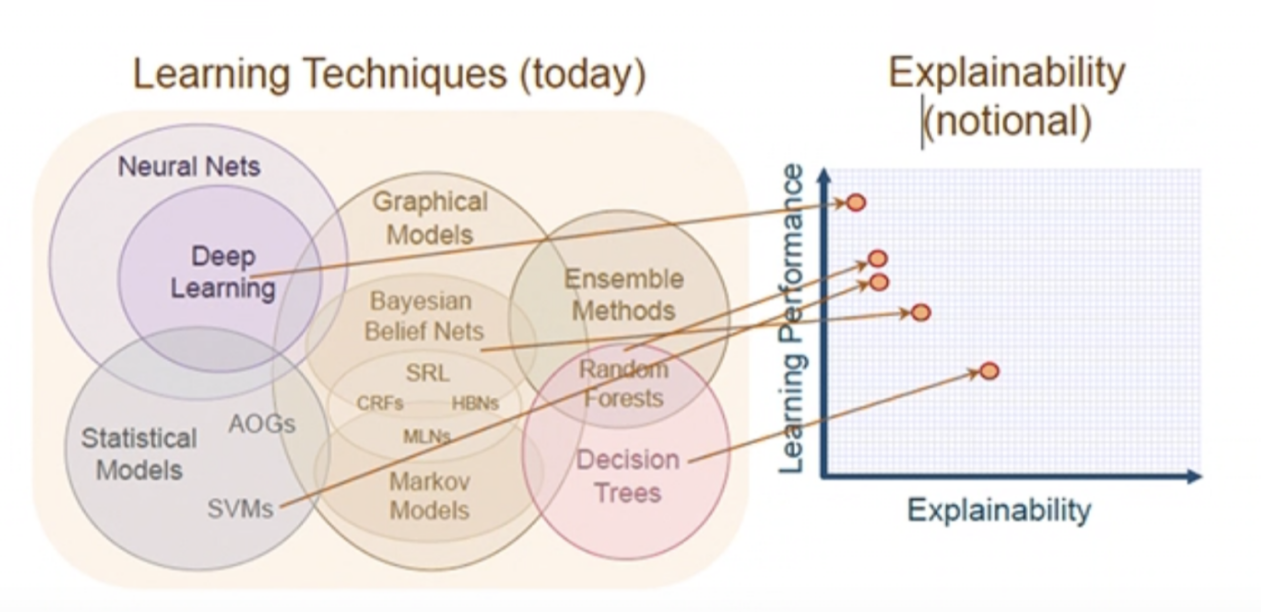
Graph-0: AI Learning Techniques and Their Performance and Explainability.
Graph-0 illustrates the three major problems well.
First, there are quite a few AI learning techniques, but they are NOT offered in a one-stop-shop fashion; most AI users and programmers are dealing with multiple siloed systems, software, and hardware wise, which means a lot of data ETL are needed for all the time (we’ll give detailed examples to illustrate how serious the problem is next).
Secondly, AI (deep/machine) learning seems to be facing the dilemma of performance and explainability contradictory to each other; you can NOT have the best of both, and needless to say that as we go deeper into the deep-learning and ANN/CNN space, things are so black-box that human decision-makers are NOT okay with this status-quo.
Last but certainly not the least important problem is most of these learning processes are NOT high-performance; the data preparation, ETL, training, and application against production data can be a very complex and lengthy process. For example, some large retail banks tried to use machine learning and AI to predict monthly credit card spending (turnover) for their hundreds of millions of card holders, but the prediction process takes weeks (as you would imagine if they start the process mid-month every month, you won’t get a result until a few days passing the deadline, which renders the whole effort pointless. Besides, such ML/AI-based prediction method is problematic in terms of accuracy, which implies a higher-cost association with the bank’s liquidity management.
All in all, these problems deserve elevated attention, and ideally, infrastructure-level innovation should be attained to address and solve these challenges.
To be a bit analytical on the needed innovation to address the problems we are facing – the trend we are seeing, and what we need is the convergence of AI and Big-Data. We desire AI to be smarter, faster, and explainable on the one hand, and we request Big-Data to be fast, deep, and flexible in terms of data processing capabilities. The greatest common factor of this AI+Big-Data convergence leads to graph augmented intelligence and XAI. A graph database is the infrastructure and data-intelligence innovation that we have been looking for. We’ll show you why and how in this essay.
The graph below (Graph-1) shows this converging trend:
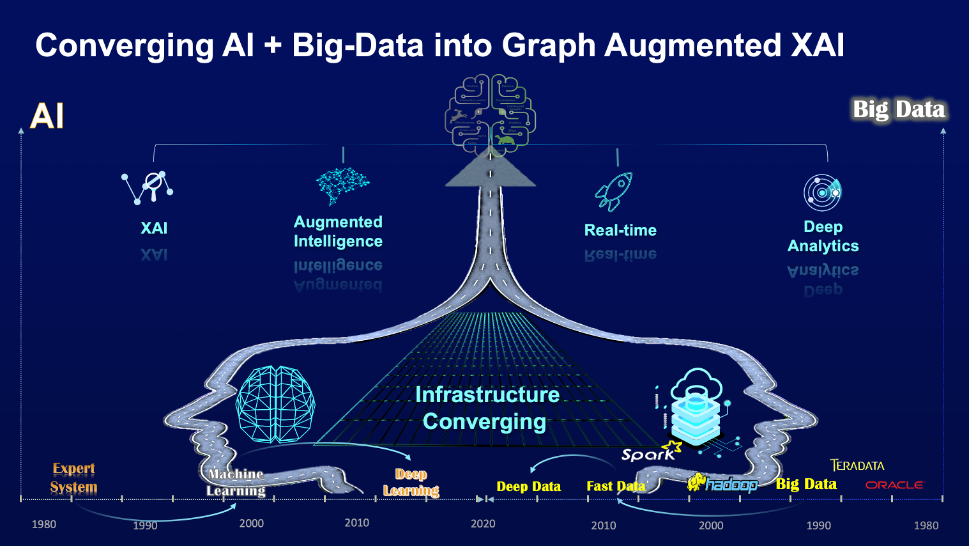
Graph-1: The Convergence of AI and Big Data to Graph Augmented XAI.
Traditionally, mathematical and statistical operations are rather limited on graphs. To understand the reason, we have to look at the evolution of graph data structures which is covered in a separate essay, The Specific Evolution of Graph Data Structures. To recap, in either adjacency matrix or adjacency list-centric data structures, very few math or stat operations can be done, not to mention these data structures are NOT high-currency capable.
Due to these limitations, developers have invented the concept of graph embedding, which basically transforms a property graph into vector space so that a lot more mathematical and statistical operations can be performed with higher efficiency. This transformation essentially is to transform high-dimensional data to be represented in lower dimensions while still preserving certain properties (such as graph topology and node/edge relationships). The other benefit of such transformation is that vector operations are much simpler and faster.
Slightly expanded discussions around vector computing are necessary. It’s an effective way to accelerate graph computing. A major advantage that’s highly relevant to graph embedding is that – the underlying data structure is vector-space comparable, which enables convenient mathematical and statistical computing operations. Moreover, from a technological stack perspective, it’s possible to parallel everything, from infrastructure, data structure, and algorithm to engineering implementation. Finally, the pursuit for high concurrency has never ceased to thrust forward, and this will ensure that otherwise time-consuming operations like graph embedding and learning can be completed as fast and timely as possible!
We’ll use the Word2Vec example to explain why vector-computing empowered graph embedding can be orders of magnitude faster and simpler. Word2Vec method can be seen as the basis and prototypical for all node, edge, or struct-centric graph embedding methods. It basically transforms words into embedding vector space so that mathematically in the lower dimensional vector space, similar words have similar embeddings – and “You shall know a word by the company it keeps,” as coined by the famous English linguist J.R. Firth in 1957 – this is to say that similar words with similar meanings tend to have similar neighboring words!
In the three following graphs (Graph-2, Graph-3, and Graph-4), a Skip-gram algorithm and SoftMax training method implementing Word2Vec are illustrated; there are other algorithms (i.e., Continuous Bag of Words) and methods (i.e., Negative Sampling) which are abbreviated for discussion simplicity.
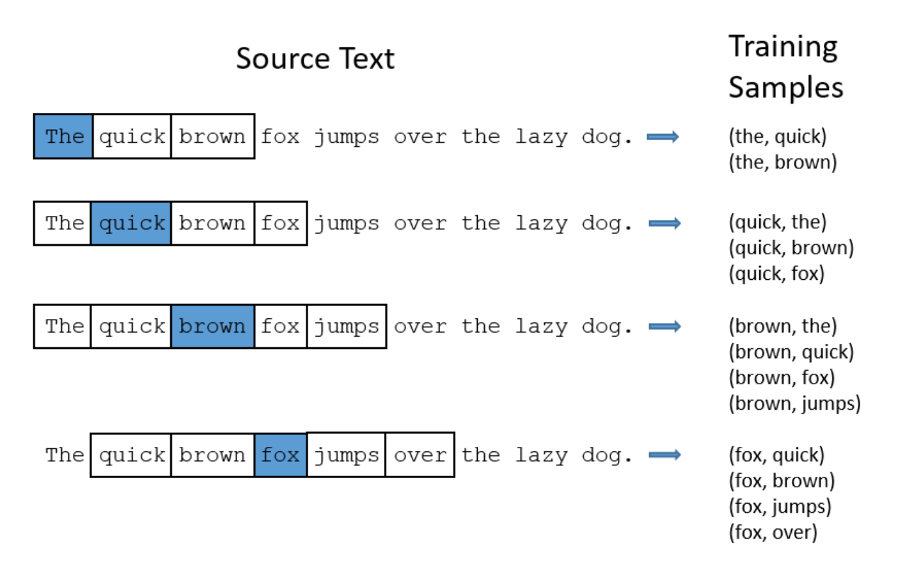
Graph-2: Word2Vec from Source Text to Training Samples
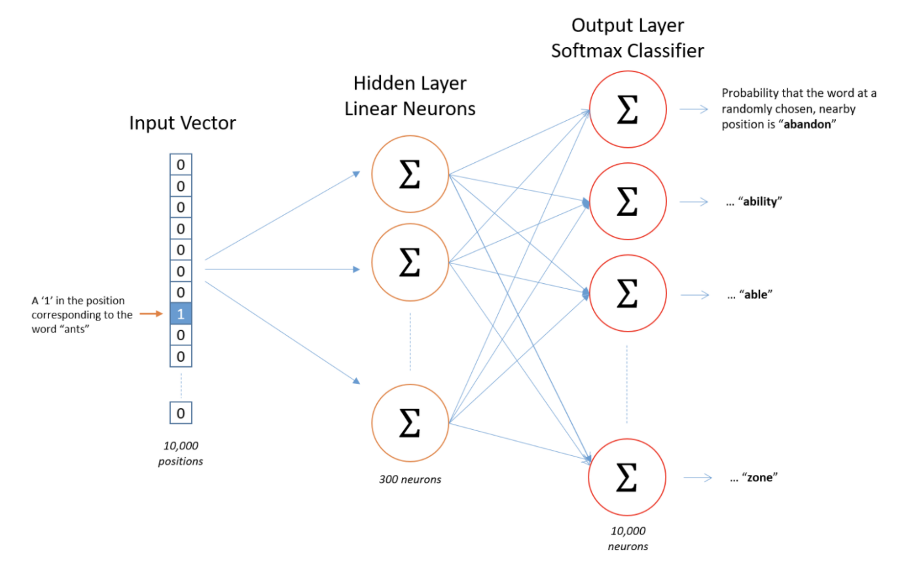
Graph-3: Architecture of Word2Vec Neural Network
Graph-2 shows some of the training samples extracted from a sentence with a window size of 2 (meaning two words pre- and two words post-the input/focused/highlighted word). Note that in the improved word2vec method, techniques like sub-samplings are used to remove samples containing words like “the” to improve overall performance.
To represent a word and feed it to a neural network, the one-hot vector method is used; as illustrated in Graph-4, the input one-hot vector for the word “ants” is a vector of 10,000 elements, but with only one and all the other positions are 0s. Similarly, the output vector also contains 10,000 elements but is filled with the probability (floating points) of each nearby word.
Assuming we have only 10,000 words in our vocabulary and 300 features or parameters that you would use to fine-tune this Word2Vec model. This translates into 300 neurons in the hidden layer and 300 features in the word vector (See Graph-4).
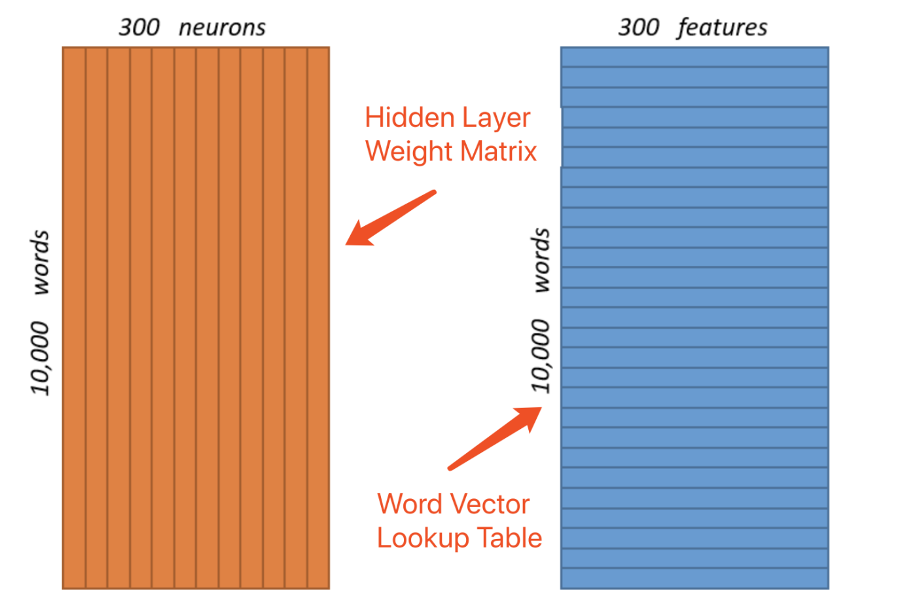
Graph-4: Gigantic Word Vectors (3,000,000 Weights!)
As you can see from Graph-4, the hidden layer and output layer each carries 3,000,000 weights, this is NOT feasible for real-world applications. In real-world circumstances, the vocabulary size can be as large as in the range of millions, multiplied by hundreds of features, which will make the size of one-hot vector reach billions, even with the help of sub-sampling, negative sampling and word-pair-phrase techniques; this sheer computational challenge is NOT acceptable. The one-hot vectors in both the input and output layers are clearly way too sparse a data structure; it’s like the adjacency matrix; it may be partitioned for parallel computing on GPUs when it’s very small in terms of the number of elements (<32,768 for instance) the matrix can hold for each dimension. Still, for much larger real-world applications, this will be overwhelming in terms of resource and time consumption.
Now, recall what we wanted to achieve with Word2Vec; essentially, we are trying to predict, in a search and recommend engine setup, when a word (or more) is entered, what other words we would like to recommend. This is a statistical game, and underlying, it’s a mathematical problem for one word asked, a handful of other words with the highest probability of appearing as close neighbors for this asked word. This is naturally a graph challenge; every single word is considered a node (or vertex) in the graph, and its neighbors are forming edges connecting with it directly; this goes on recursively. And each node and edge can have its own weight, type, label, and attributes (as many as needed).
What we just described in the above paragraph can be represented in Graph-5, with two data structure variations. On the surface, they look like big-table data structures, but under the hood, it’s the high-concurrency multi-dimensional vector-space implementations that make things fly.
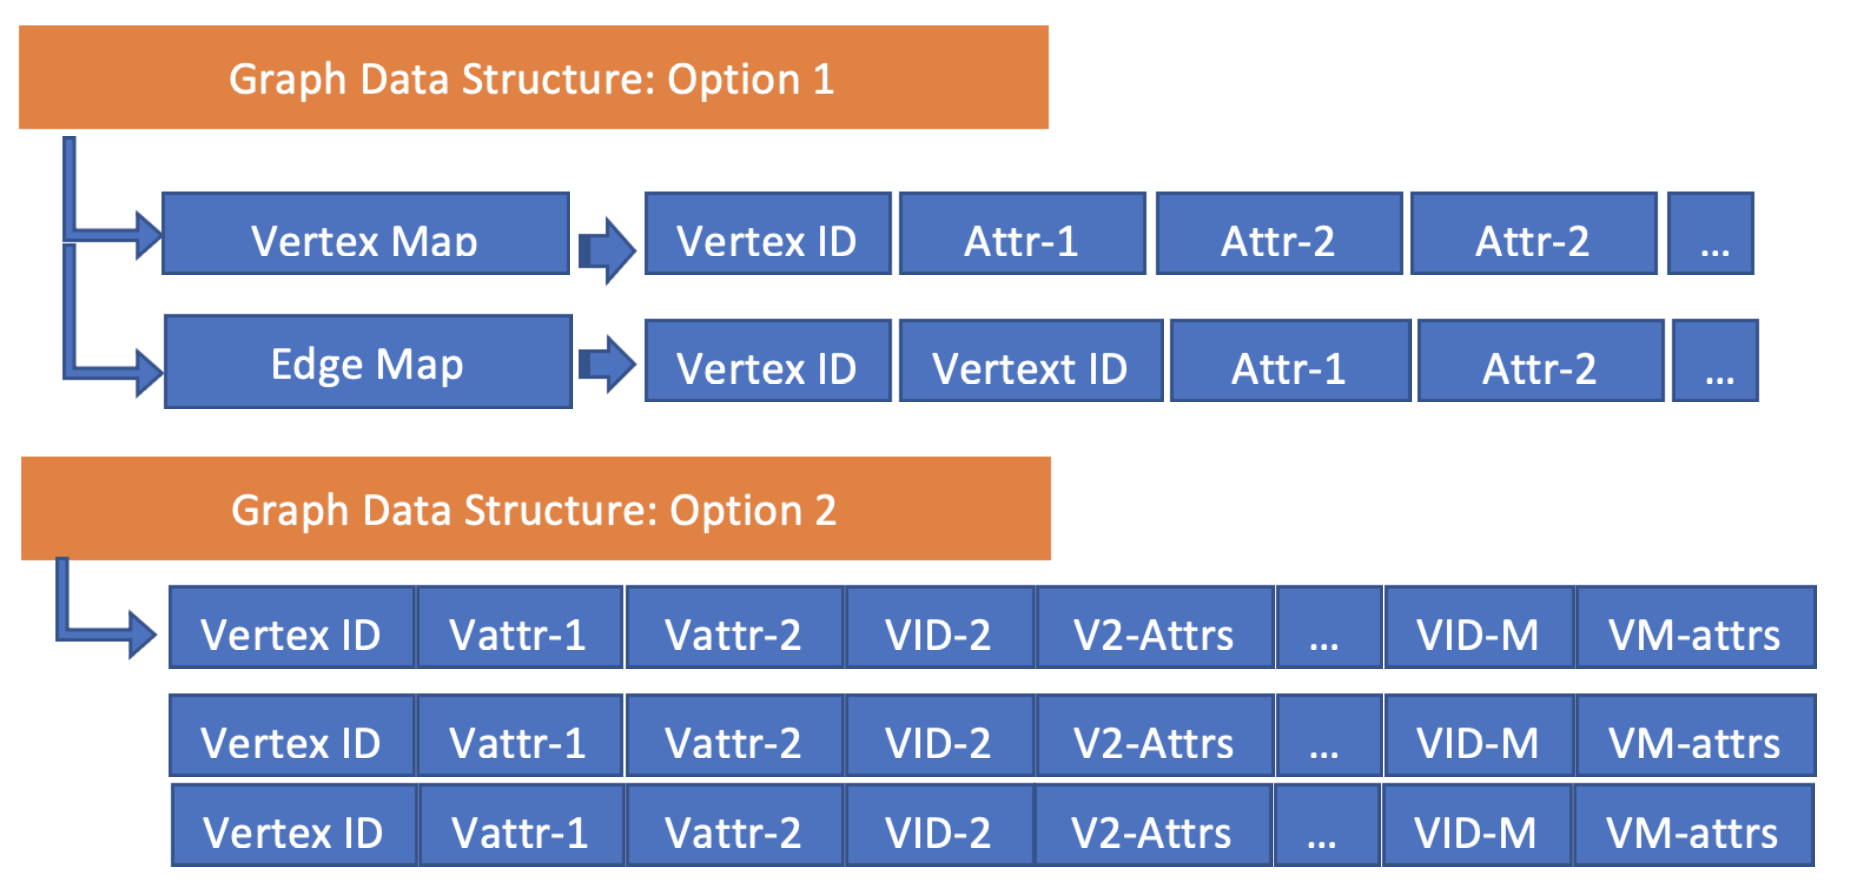
Graph-5: Graph Data Structures with Natural Graph Embeddings
Given the vector-space data structure, the word2vec problem really boils down to two steps:
- Assigning a probability weight for each directed edge connecting two words, and this can be done statistically;
- Search and recommendation are simple and short graph traversal tasks that simply pick the top-X number of vertices connecting the starting vertex. This operation can be done recursively to traverse deeper in the graph – this is like to search and recommend in real-time (similar to real-time suggestion, but potentially more accurate and intelligent if you recall this exactly resembles how the human brain functions with NLP).
What we just described is a complete white-box process; every single step is specific, explainable, and crystal clear. It’s very much unlike the black box and hidden layer(s) that you have to deal with cluelessly, as in Graph-3 and Graph-4. This is why graph will drive XAI (short for eXplainable Artificial Intelligence) forward!
More specifically, vector-space computing is naturally graphically embedded – there is no further computation or operations needed; when the data are presented in the graph in the format of vectors (a form of index-free adjacency), the embeddings are done.
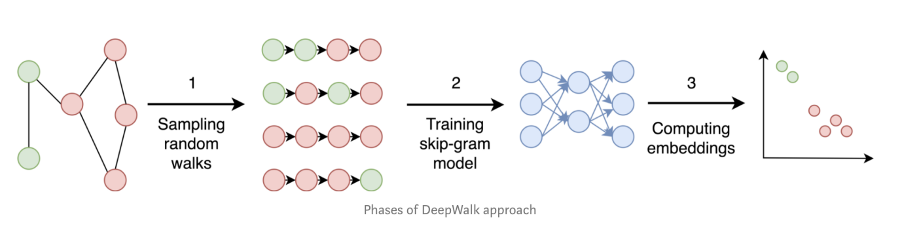
Graph-6: Breakdown of DeepWalk
DeepWalk is a second example to investigate. It is a typical vertex-centric embedding approach and uses random walks to produce embeddings. With the help of vector-space computing, random-walk is as easy as selecting a specific node and moving on to a random neighboring node, and deeply traversing the graph for a random number of steps (i.e., ~ 40 steps). Pay attention to the depth/length of the walk; we understand that with every hop deeper into the graph, the computational challenge is exponential; the simple math here is that if an average node has 20 neighbors, going 40 steps deep is to look through neighbors as many as 2040, no production system today can handle this in a brutal-force way. However, with the help of highly concurrent vector computing, each step of traversing (sampling) in the graph takes O(1); going 40 steps further is basically O(40*20) in terms of overall latency (though compute-wise, all the concurrency tasks still parallelly deal with all neighbors encountered and filter out any duplicated or revisited nodes effectively).
The step-by-step breakdown of DeepWalk is illustrated in Graph-6. With highly concurrent vector computing, the random walking, training, and embedding processes are reduced into native graph operations like K-Hop-ing and Path-Finding, which are straightforward, explainable therefore XAI friendly!
DeepWalk has been criticized for 1. The inability to generalization, not being capable of handling highly dynamic graphs (each new coming node must be re-trained) well, and 2). not possible to preserve the local neighborhood (because deep random walks do NOT preserve neighborhood information).
The Node2Vec method has been invented to address at least the second shortcoming of DeepWalk. Graph-7 illustrates the many steps taken to make the whole learning process complete. Please note that there are ten steps (subprocesses) involved; each step by itself can further break down into a series of computing processes. A graph embedding method like this usually takes a long time to complete. But, this is NOT the case with Ultipa’s graph embedding algorithms; we convert all these subprocesses into concurrent fashion to maximize the leverage of underpinning hardware computing juices as well as minimize turnaround time. Specifically, all of the following subprocesses are run in a parallel fashion:
- Node2Vec’s random walks
- Preparation of precomputed Exp. Table
- Learning of Vocabulary (from Training File)
- Removal of Low-Frequency Vocabularies
- Sub-sampling of Frequent Words (Vectors)
- Initialization of Network (Hidden Layer, Input and Output Layers)
- Initialization of Unigram Table (Negative Sampling)
- Training of Skip-Gram
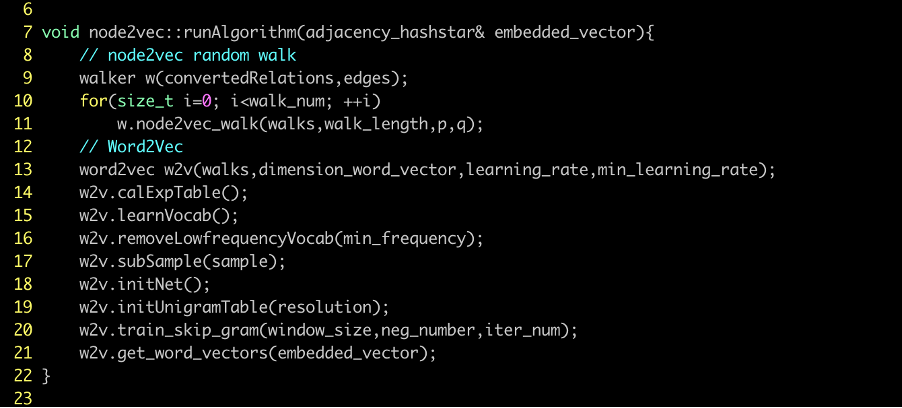
Graph-7: Outer Steps of Node2Vec Relying on Word2Vec
The parallelization of these steps helps achieve much better latency and performance improvement; always remember that every single second wasted on not achieving high concurrency is a waste of resources, therefore, not environment friendly, and we are not kidding.
There are other graph embedding techniques that bear similar concepts and steps:
- Sampling and labeling
- Training of certain models (i.e., Skip-Gram, n-Gram, etc.)
- Computing embeddings
Some are done locally at the vertex/subgraph level; others are done against the entire graph, therefore mathematically more time-consuming; whichever approach we take, being able to achieve the following goals would be meaningfully fantastic:
- Attain high performance via high concurrency on data structure, architecture, and algorithm level.
- Explain every step of operations in a definite, specific, white-box way.
- Ideally, complete the operations in a one-stop-shop fashion.
If we recall Graph-0 at the beginning of this essay, the Explainability-vs-Performance chart is intriguing. Decision Trees have better explainability because we understand what they do step-by-step; trees are essentially simple graphs; they don’t contain circles which are considered perplexing mathematically, therefore, harder to explain, and most so-called graph algorithms or embedding implementations today are based on low-performance adjacency list or academic-oriented adjacency matrix. On the other hand, overly sophisticated neural networks and deep learning techniques are going in a direction that’s black-box centric and difficult to explain. In real-world applications, AI can NOT go away with human beings not being able to understand what exactly is going on under the hood – it’s against the XAI rule of thumb – Explainability!
Graph-8: Integrated Ultipa Real-Time Graph Database and Ultipa Manager
The breakthrough of graph data structures and implementation of highly parallel graph computing architecture would make achieving the three goals highly tangible. This is what Ultipa Graph has been invented for and geared toward.
Ultipa is all about Graph Augmented Intelligence and XAI.
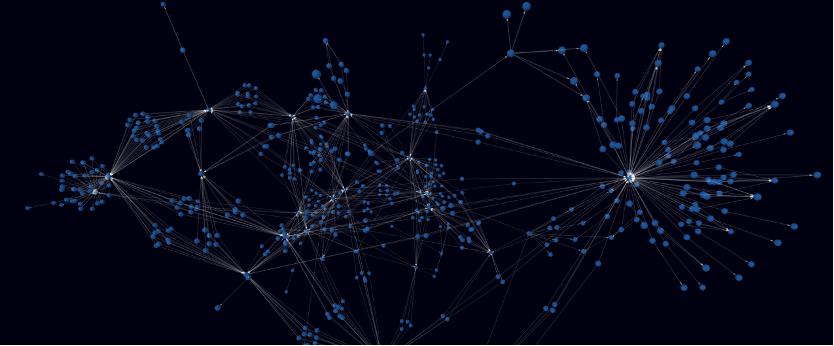
Graph-9: Ultipa Manager in 3D Mode
Published at DZone with permission of Ricky Sun. See the original article here.
Opinions expressed by DZone contributors are their own.
Comments