Graylog With Kubernetes in GKE
Take a look at how you can use Graylog to collect data from multiple sources with independent streams.
Join the DZone community and get the full member experience.
Join For Free
We all know that when collecting data from different data sources — whether it is an application, server, or service — it is a necessity to have a tracking system that tells what went wrong with your system at a specific time, and to know exactly how your system behaves.
This article aims to demonstrate how to deploy The Graylog Stack — Graylog v3 and Elasticsearch v6, along with MongoDB v3 — use Kubernetes, and how to collect data from different data sources using inputs, and streams.
What is Graylog?
Graylog is a leading centralized log management solution built to open standards for capturing, storing, and enabling real-time analysis of terabytes. It supports the primary-replica architecture.
Graylog is very flexible in such a way that it supports multiple inputs (data sources) like:
- GELF TCP.
- GELF Kafka.
- AWS Logs.
as well as Outputs (how can Graylog nodes forward messages):
- GELF Output.
- STDOUT.
You can route incoming messages into streams by applying rules against them. Messages matching the stream rules are routed into that stream. A message can also be routed into multiple streams.
Scenario
In this article, we will create a Kubernetes cron job which will be used as a data source for Graylog. This data source will send messages to the Graylog pod every two seconds. Then we will create a stream to hold these messages.
The advantage of this approach is that you can collect data from multiple data sources and each one gets its own stream; for example, a stream of data that comes from AWS EC2 instance has its stream, and your running application will, too.
Pre-requisites:
- GKE cluster. Google gives you an account with $300 for free.
- Minikube
You can create an account in Google Cloud so that you get $300 credit. This credit is only used when you exceed free usage limits. The credit expires in 12 months.
Setting up The Project on Your Cluster
1) Cloning the Project
Clone the project from GitHub repository:
git clone https://github.com/mouaadaassou/K8s-Graylog.git2) Explaining the Graylog Stack Deployments
To deploy Graylog, you need to run Elasticsearch along with MongoDB, but why both of them?
The reason behind this requirement is as follow:
- Graylog uses MongoDB to store your configuration data, not your log data. Only metadata is stored, such as the user information or stream configuration
- Graylog uses Elasticsearch to store the logged data, as we know Elasticsearch is a powerful search engine. It is recommended to use a dedicated Elasticsearch cluster for your Graylog setup.
So you have first to deploy Elasticsearch and MongoDB so that the Graylog can start.
To start Graylog service, we need to start the Elasticsearch cluster first and then MongoDB instance. After that, you can deploy Graylog.
3) Explaining the Cron Job
To simulate a data source that sends some data to be logged to Graylog, we create a Kubernetes cron job that will be running every two seconds. and it uses curl to send the message to Graylog.
apiVersion: batch/v1beta1
kind: CronJob
metadata:
  name: curl-cron-job
spec:
  schedule: "* * * * *"
  jobTemplate:
   spec:
    template:
     spec:
      containers:
      - name: curl-job
        image: alpine:3.9.4
        args:
        - /bin/sh
        - -c
        - apk add curl -y; while true; do curl -XPOST http://graylog3:12201/gelf -p0 -d '{"short_message":"Hello there", "host":"alpine-k8s.org", "facility":"test", "_foo":"bar"}';sleep 1s; done
      restartPolicy: OnFailure
4) Configuring Graylog Deployment
First things first: You have to customize the GRAYLOG_HTTP_EXTERNAL_URI value in the graylog-deploy.yaml file:
- name: GRAYLOG_HTTP_EXTERNAL_URI
  value: #your_remote_or_localhost_ip
You can also change the default login password to Graylog. In order to generate a password for your Graylog, run the following command:
echo -n "Enter Password: " && head -1 </dev/stdin | tr -d '\n' | sha256sum | cut -d" " -f1This command will ask you to enter your password, then copy and paste the generated hashed password to the environment variable:
- name: GRAYLOG_ROOT_PASSWORD_SHA2
  value: generated_hashed_password_here
You can check the Graylog config file graylog.conf for more details.
5) Deploying the Graylog Stack
Now we will deploy Graylog Stack using Kubernetes:
kubectl create -f es-deploy.yaml
kubectl create -f mongo-deploy.yaml
kubectl create -f graylog-deploy.yaml
You can check the deployment using the following command:
kubectl get deploy
You can also check the pods created by this deployments:
kubectl get pods6) Login to Graylog Web Interface
After running the Graylog stack, you can log in to the Graylog web interface:

Change <your_ip_address> to yours
7) Creating a Gelf HTTP Input
After login, we have to create an input to receive the messages from the Cron job. To do so you can go to System -> Input.

Then select "Gelf HTTP" and click "Launch New Input":

After that, a form box will ask you to specify the node, so bind the address and port as follows:

8) Creating the Cron Job
Now everything is set up, our Graylog input is running, so we have to start our data source to log messages to the Graylog instance.
Launch the K8s cron job using the following command:
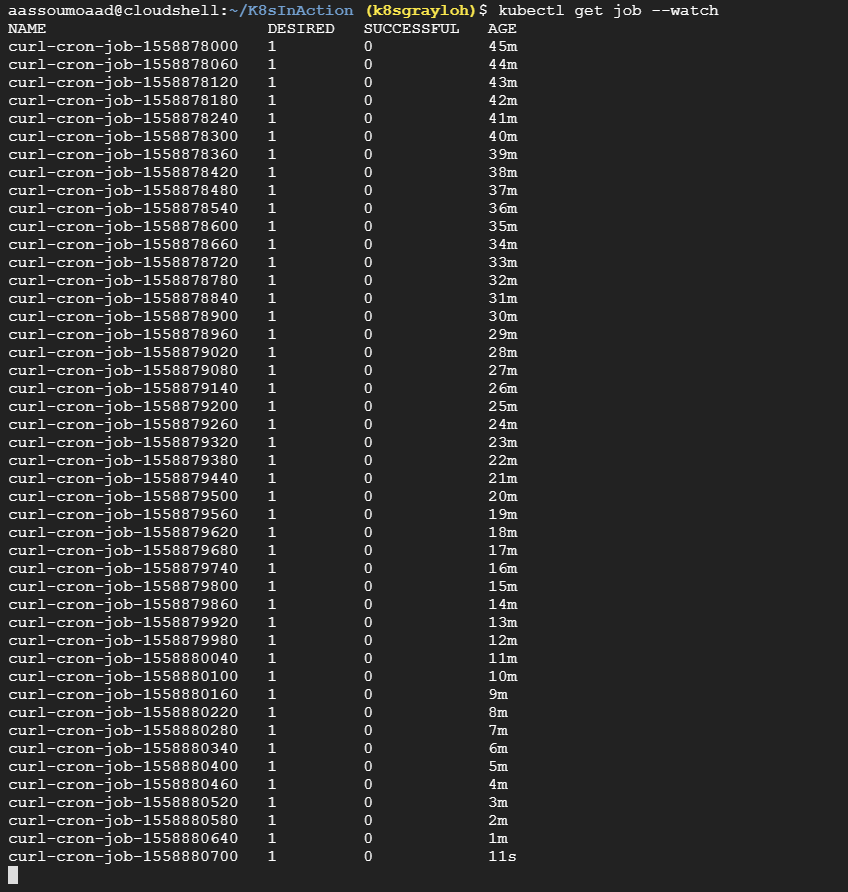
kubectl create -f cornJob.yamlTo display the cron job details use the following command:
kubectl get job --watch
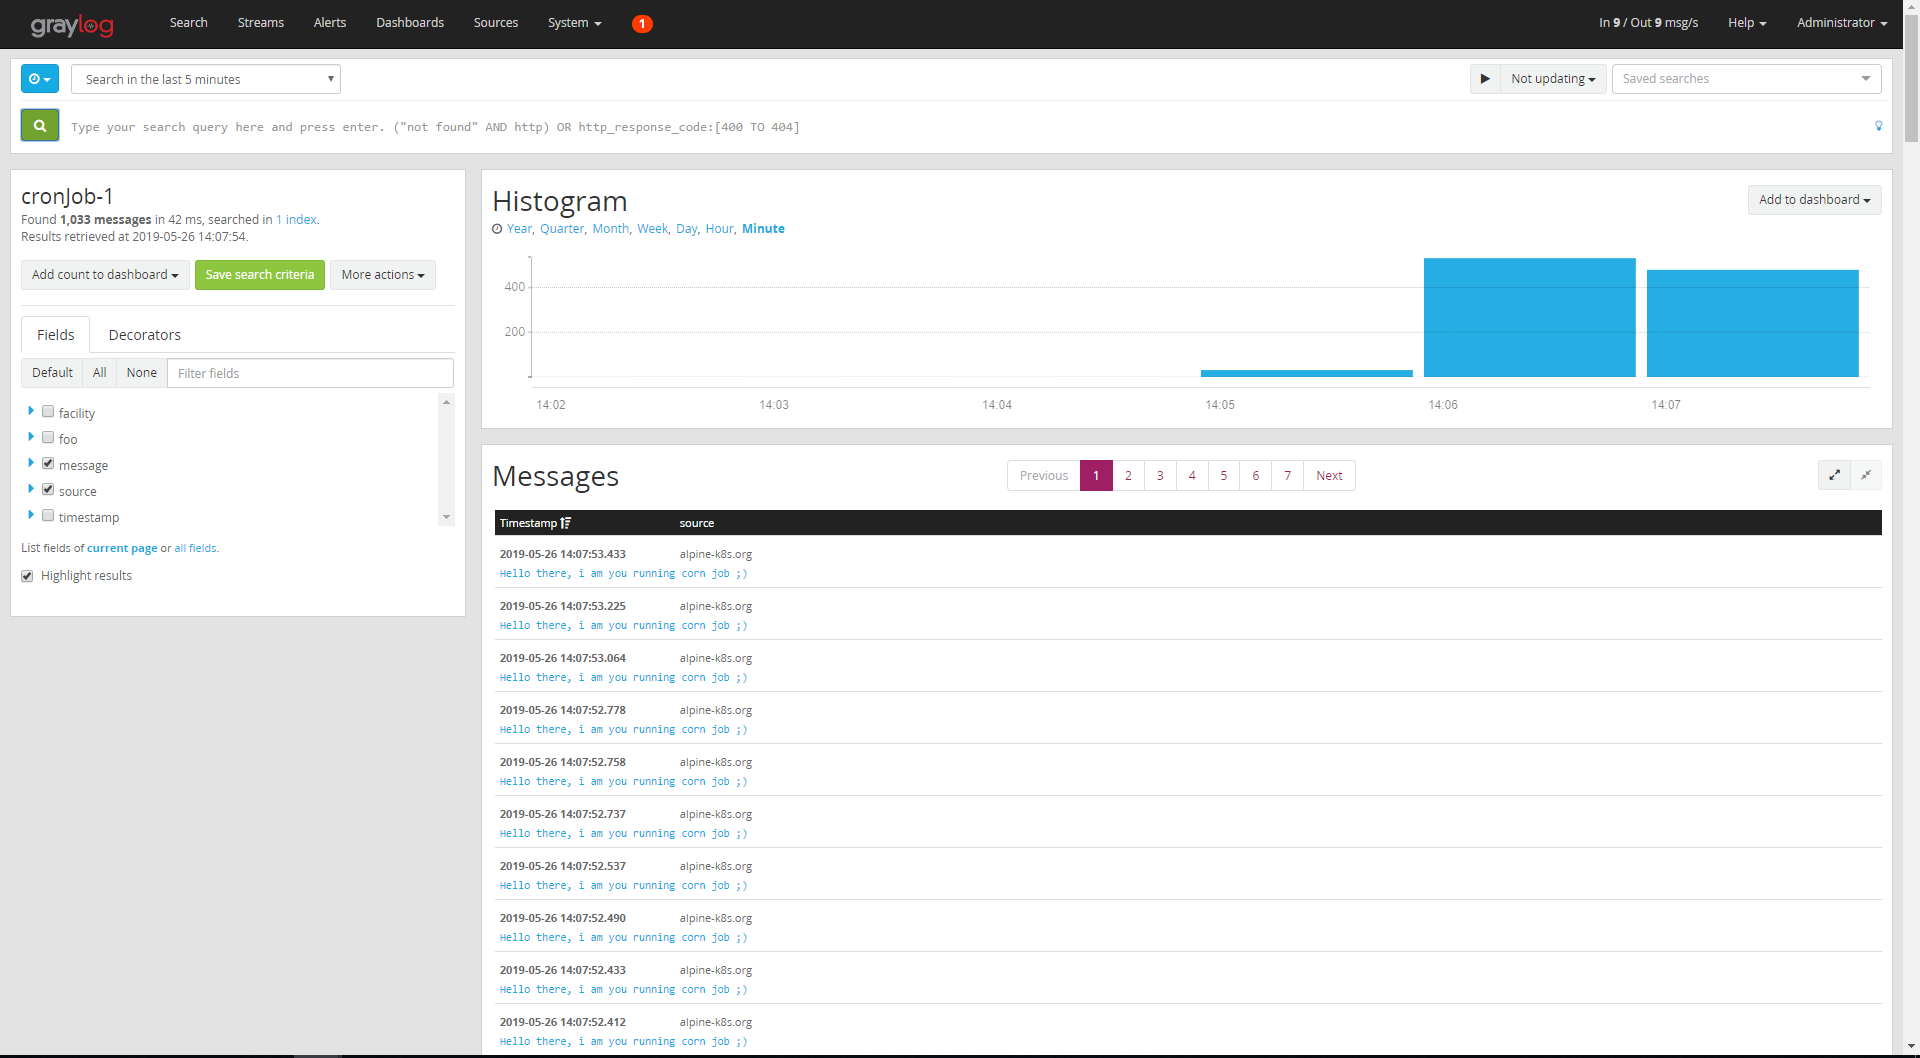
9) Checking the Received Logs from The Cron Job
Now everything should work fine. We have just to check the received messages by clicking on "Search":

10) Creating a Separate Stream for Our Cron Job
We've done a great job, and we have everything we need. But if we have multiple inputs, and all of them put the messages to All-Messages stream, we will get a mess, so it will be difficult to know which input has sent this message without filtering. Now think about creating your own stream.
To create a stream for that specific input, go to "Streams," click on "Create Stream" and fill in the form as follows:

Press "Save". In my case I named this stream "cronjob-1." After that we have to manage the rules — we should tell Graylog which messages should be in our stream.
Click "Manage Rules," then "Add stream rule," then complete the form as follows:

In my case, I am telling Graylog to put the message received by “source”=”alpine-k8s.org” in the created stream.
Press Save, and go to "Streams," it will list all the existing streams:

As you can see, our stream "cronjob-1" has been created, click on it, and you will see all the messages from the source alpine-k8s.org, which is our running cron job.
Graylog is very flexible, it supports different data source inputs, and you can create streams and attach them to a given input/output. After this article, you can start your own Graylog Stack and log data to it, for further information about Graylog, you can take a look at the Official Documentation.
In the next article, we will use Graylog with a Spring Boot application to demonstrate how to send our application logs to Graylog and how to create a dashboard for this specific application to visualize the metrics.
Opinions expressed by DZone contributors are their own.
Comments