Three Habits of Highly Effective Observability Teams
Learn how the most effective observability teams use SLOs, change tracking, and hypothesis-driven troubleshooting in microservices architectures.
Join the DZone community and get the full member experience.
Join For FreeAs organizations adopt microservices and containerized architectures, they often realize that they need to rethink their approach to basic operational tasks like security or observability. It makes sense: in a world where developers – rather than operations teams – are keeping applications up and running, and where systems are highly distributed, ephemeral, and interconnected, how can you take the same approach you have in the past? From a technology perspective, there has been a clear shift to open source standards, especially in the realm of observability. Protocols like OpenTelemetry and Prometheus, and agents like Fluent Bit, are now the norm – according to the 2023 CNCF survey, Prometheus usage increased to 57% adoption in production workloads, with OpenTelemetry and Fluent both at 32% adoption in production.
But open source tools alone can’t help organizations transform their observability practices. As I’ve had the opportunity to work with organizations who have solved the challenge of observability at scale, I’ve seen a few common trends in how these companies operate their observability practices. Let's dig in.
Measure Thyself — Set Smart Goals With Service Level Objectives
Service Level Objectives were first introduced by the Google SRE book in 2016 with great fanfare. But I’ve found that many organizations don’t truly understand them, and even fewer have implemented them. This is unfortunate because they are secretly one of the best ways to predict failures.
SLOs (Service Level Objectives) are specific goals that show how well a service should perform, like aiming for 99.9% uptime. SLIs (Service Level Indicators) are the actual measurements used to see if the SLOs are met — think about tracking the percentage of successful requests. Error budgeting is the process of allowing a certain amount of errors or downtime within the SLOs, which helps teams balance reliability and new features — this ensures they don’t push too hard at the risk of making things unstable. Having SLOs on your key services and using error budgeting allows you to identify impending problems and act on them.
One of the most mature organizations that I’ve seen practicing SLOs is Doordash. For them, the steaks are high (pun intended). If they have high SLO burn for a service, that could lead to a merchant not getting a food order on time, right, or at all. Or it could lead to a consumer not getting their meal on time or experiencing errors in the app.
Getting started with SLOs doesn’t need to be daunting. My colleague recently wrote up her tips on getting started with SLOs. She advises to keep SLOs practical and achievable, starting with the goals that truly delight customers.
Start small by setting an SLO for a key user journey. Collaborate with SREs and business users to define realistic targets. Be flexible and adjust SLOs as your system evolves.
Embrace Events — The Only Constant in your Cloud-Native Environment is Change
In DevOps, things are always changing. We're constantly shipping new code, turning features on and off, updating our infrastructure, and more. This is great for innovation and agility, but it also introduces change, which opens the door for errors. Plus, the world outside our systems is always shifting too, from what time of day it is to what's happening in the news. All of this can make it hard to keep everything running smoothly.
These everyday events that result in changes are the most common causes of issues in production systems. And the challenge is that these changes are initiated by many different types of systems, from feature flag management to CI/CD, cloud infrastructure, security, and more. Interestingly, 67% of organizations don’t have the ability to identify change(s) in their environments that caused performance issues according to the Digital Enterprise Journal. The only way to stay on top of all of these changes is to connect them into a central hub to track them. When people talk about “events” as a fourth type of telemetry, outside of metrics, logs, and traces, this is typically what they mean.
One organization I’ve seen do this really well is Dandy Dental. They’ve found that the ability to understand change in their system, and quickly correlate it to the changes in behavior, has made debugging a lot faster for developers. Making a habit of understanding what changed has allowed Dandy to improve their observability effectiveness.
Adopt Hypothesis-Driven Troubleshooting — Enable Any Developer to Fix Issues Faster
When a developer begins troubleshooting an issue, they start with a hypothesis. Their goal is to quickly prove or disprove that hypothesis. The more context they have about the issue, the faster they can form a good hypothesis to test. If they have multiple hypotheses, they will need to test each one in order of likelihood to determine which one is the culprit. The faster a developer can prove or disprove a hypothesis, the faster they can solve the problem.
Developers use observability tools to both form their initial hypotheses and to prove/disprove them. A good observability tool will give the developer the context they need to form a likely hypothesis. A great observability tool will make it as easy as possible for a developer with any level of expertise or familiarity with the service to quickly form a likely hypothesis and test it.
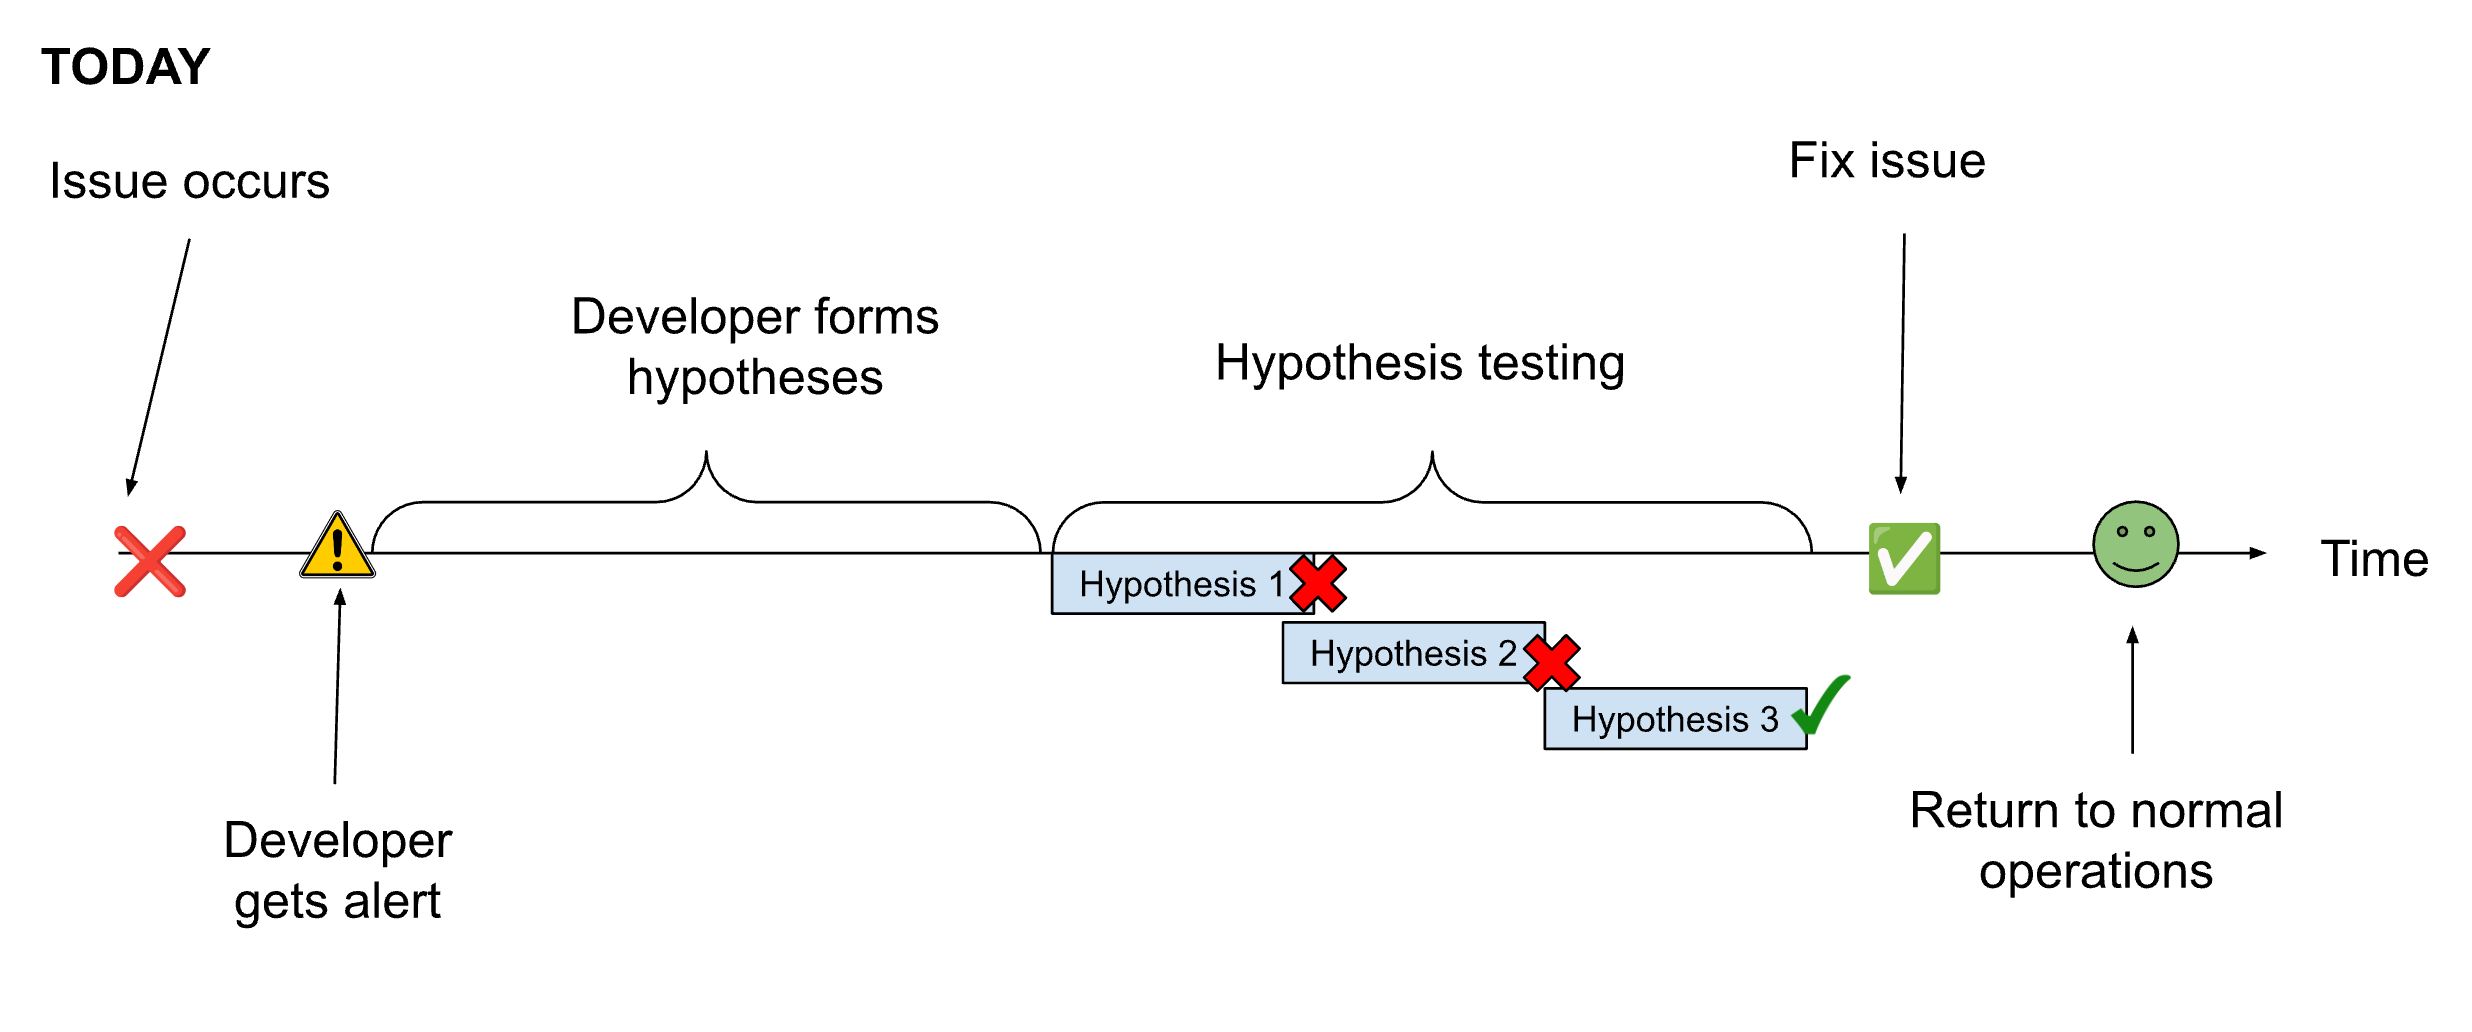
Organizations that want to improve their MTTR can start by shrinking the time to create a hypothesis. Tooling that provides the on-call developer with highly contextual alerts that immediately focus them on the relevant information can help shrink this time.
The other advantage of explicitly taking a hypothesis-driven troubleshooting approach is concurrency. If the issue is high severity, or has significant complexity, they may need to call in more developers to help them concurrently prove or disprove each hypothesis to speed up troubleshooting time.
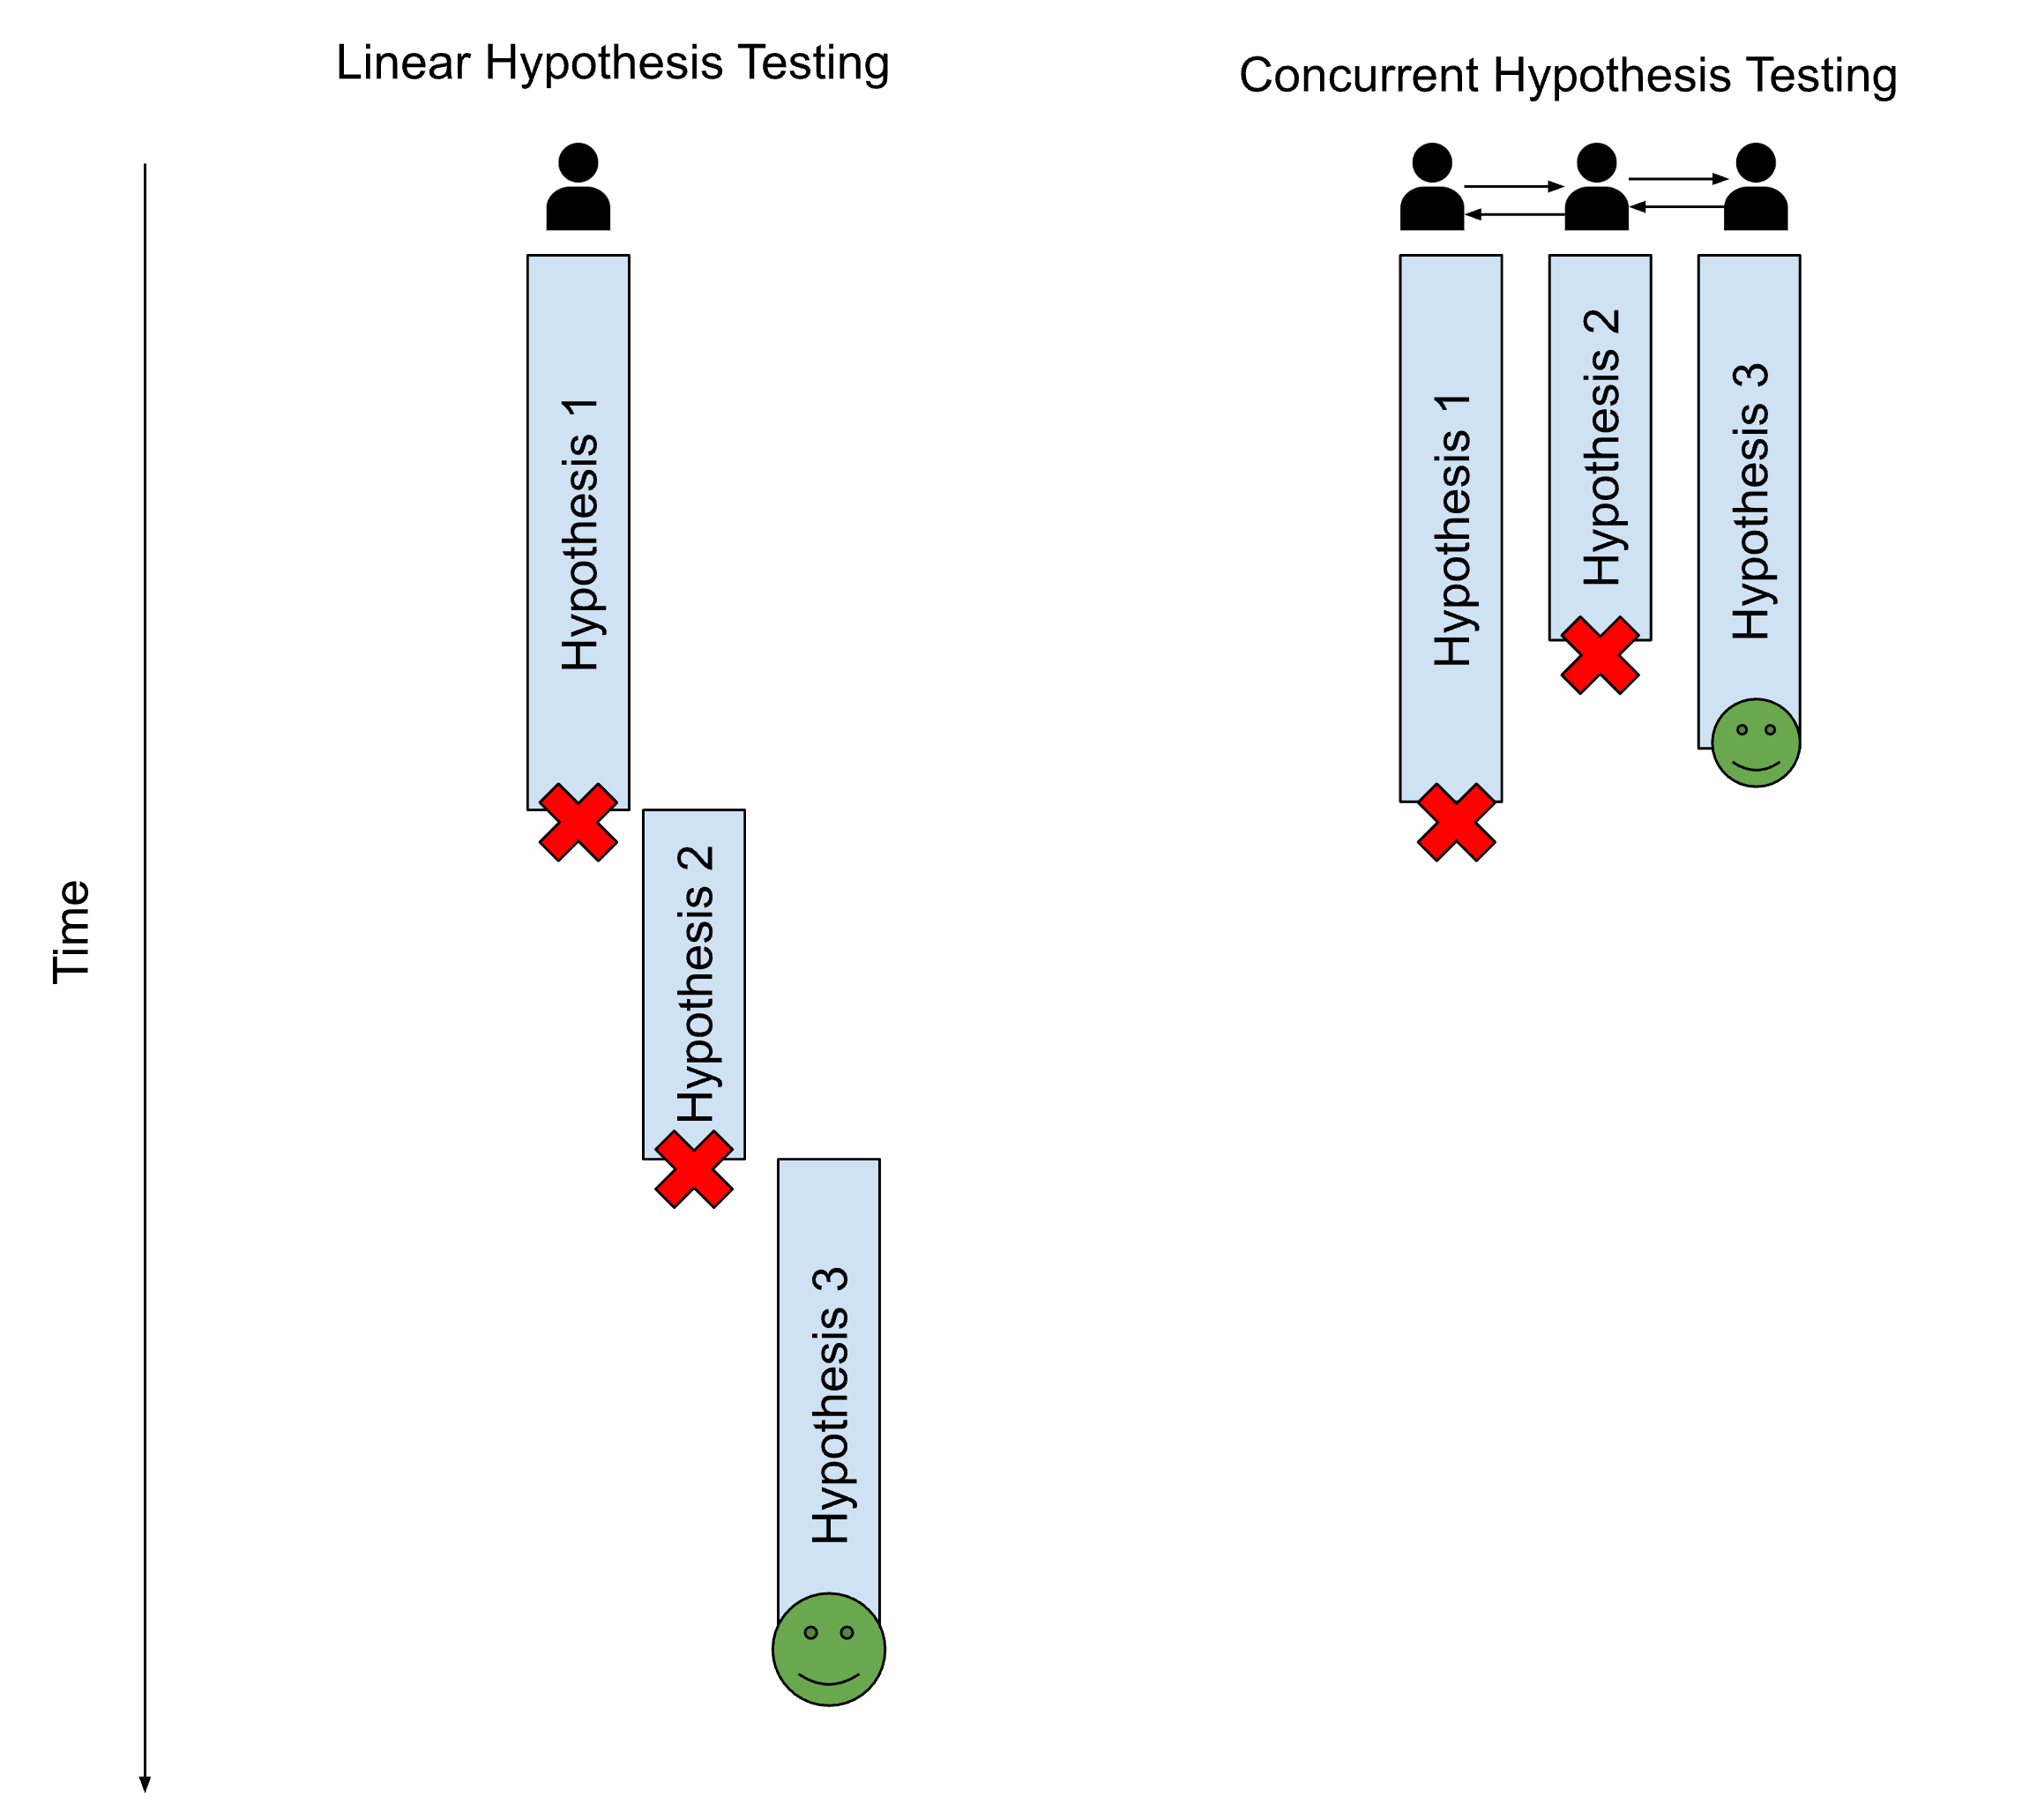
An AI software company we work with uses hypothesis-driven troubleshooting. I recently heard a story about how they were investigating a high error rate on a service, and used their observability tool to narrow it down to two hypotheses. Within 10 minutes they had proven their first hypothesis to be correct – that the errors were all occurring in a single region that had missed the most recent software deploy.
Taking the Next Step
If you're committed to taking your observability practice to the next level, these tried-and-true habits can help you take the initial steps forward. All three of these practices are areas that we’re passionate about. If you’ll be at KubeCon and want to discuss this more, please come say hello!
This article was shared as part of DZone's media partnership with KubeCon + CloudNativeCon.
View the Event
Opinions expressed by DZone contributors are their own.
Comments