From Code to Customer: Building Fault-Tolerant Microservices With Observability in Mind
Learn how to build resilient Kubernetes microservices with fault tolerance, SRE practices, and observability from code to customer.
Join the DZone community and get the full member experience.
Join For FreeMicroservices have become the go-to approach for building systems that need to scale efficiently and stay resilient under pressure. However, a microservices architecture comes with many potential points of failure—dozens or even hundreds of distributed components communicating over a network. To ensure your code makes it all the way to the customer without hiccups, you need to design for failure from the start. This is where fault tolerance and observability come in. By embracing Site Reliability Engineering (SRE) practices, developers can build microservices that not only survive failures but automatically detect and recover from them.
In this article, we’ll explore how to build fault-tolerant backend microservices on Kubernetes, integrating resilience patterns (retries, timeouts, circuit breakers, bulkheads, rate limiting, etc.) with robust observability, monitoring, and alerting. We’ll also compare these resilience strategies and provide practical examples—from Kubernetes health probes to alerting rules—to illustrate how to keep services reliable from code to customer.
Microservices, Kubernetes, and the Need for Resilience
Microservices offer benefits like scalability, elasticity, and agility, but their distributed nature means more things can go wrong . A single user request might traverse multiple services; if any one of them fails or slows down, the whole user experience suffers. In a monolithic system, failures are usually contained within a single process. But in a microservices architecture, if failures aren’t handled carefully, they can ripple across services and cause broader system issues. Running microservices on Kubernetes adds another layer: while Kubernetes provides self-healing (it can restart crashed containers) and horizontal scaling, it’s still up to us to ensure each service is resilient to partial failures.
Fault tolerance is a system’s ability to keep running—even if something goes wrong. It might not work perfectly, but it can still function, often in a limited or degraded mode, instead of crashing completely. This is different from just high availability. Fault tolerance expects that components will fail and designs the system to handle it gracefully (ideally without downtime). In practice, building fault-tolerant microservices means anticipating failures—timeouts, errors, crashes, network issues—and coding defensively against them.
Site Reliability Engineering (SRE), introduced by Google, bridges the gap between development and operations, with reliability at its core. An SRE approach encourages designing systems with reliability as a feature. Key SRE concepts include redundancy, automation of recovery, and setting Service Level Objectives (SLOs) (e.g. “99.9% of requests succeed within 200ms”). In a microservices context, SRE practices translate to using robust resilience patterns and strong observability so that we can meet our SLOs and catch issues early. The SRE mindset of “embracing failure” means designing systems with the expectation that things will go wrong. So instead of hoping everything always works, we build in ways to handle failures gracefully when they happen.
Observability is critical here—it’s the property of the system that allows us to understand its internal state from the outside. As the saying goes, “you can’t fix what you can’t see.” We need deep visibility into our microservices in production to detect failures and anomalous behavior. Traditional monitoring might not be enough for highly distributed systems, so modern observability focuses on collecting rich telemetry (logs, metrics, traces) and correlating it to get a clear picture of system health. Observability, combined with alerting, ensures that when something does go wrong (and eventually it will), we know about it immediately and can pinpoint the cause.
In summary, microservices demand resilience. By leveraging Kubernetes features and SRE best practices—designing for failure, implementing resilience patterns, and instrumenting everything for observability—we can build services that keep running smoothly from code to customer even when the unexpected happens.
Resilience Patterns for Fault-Tolerant Microservices
One of the best ways to build fault tolerance is to implement proven resilience design patterns in your microservices. These patterns, often used in combination, help the system handle errors gracefully and prevent failures from snowballing. Below we describe key resilience techniques—retries, circuit breakers, timeouts, rate limiting, bulkheads, and graceful degradation—and how they improve reliability.
Retries and Exponential Backoff
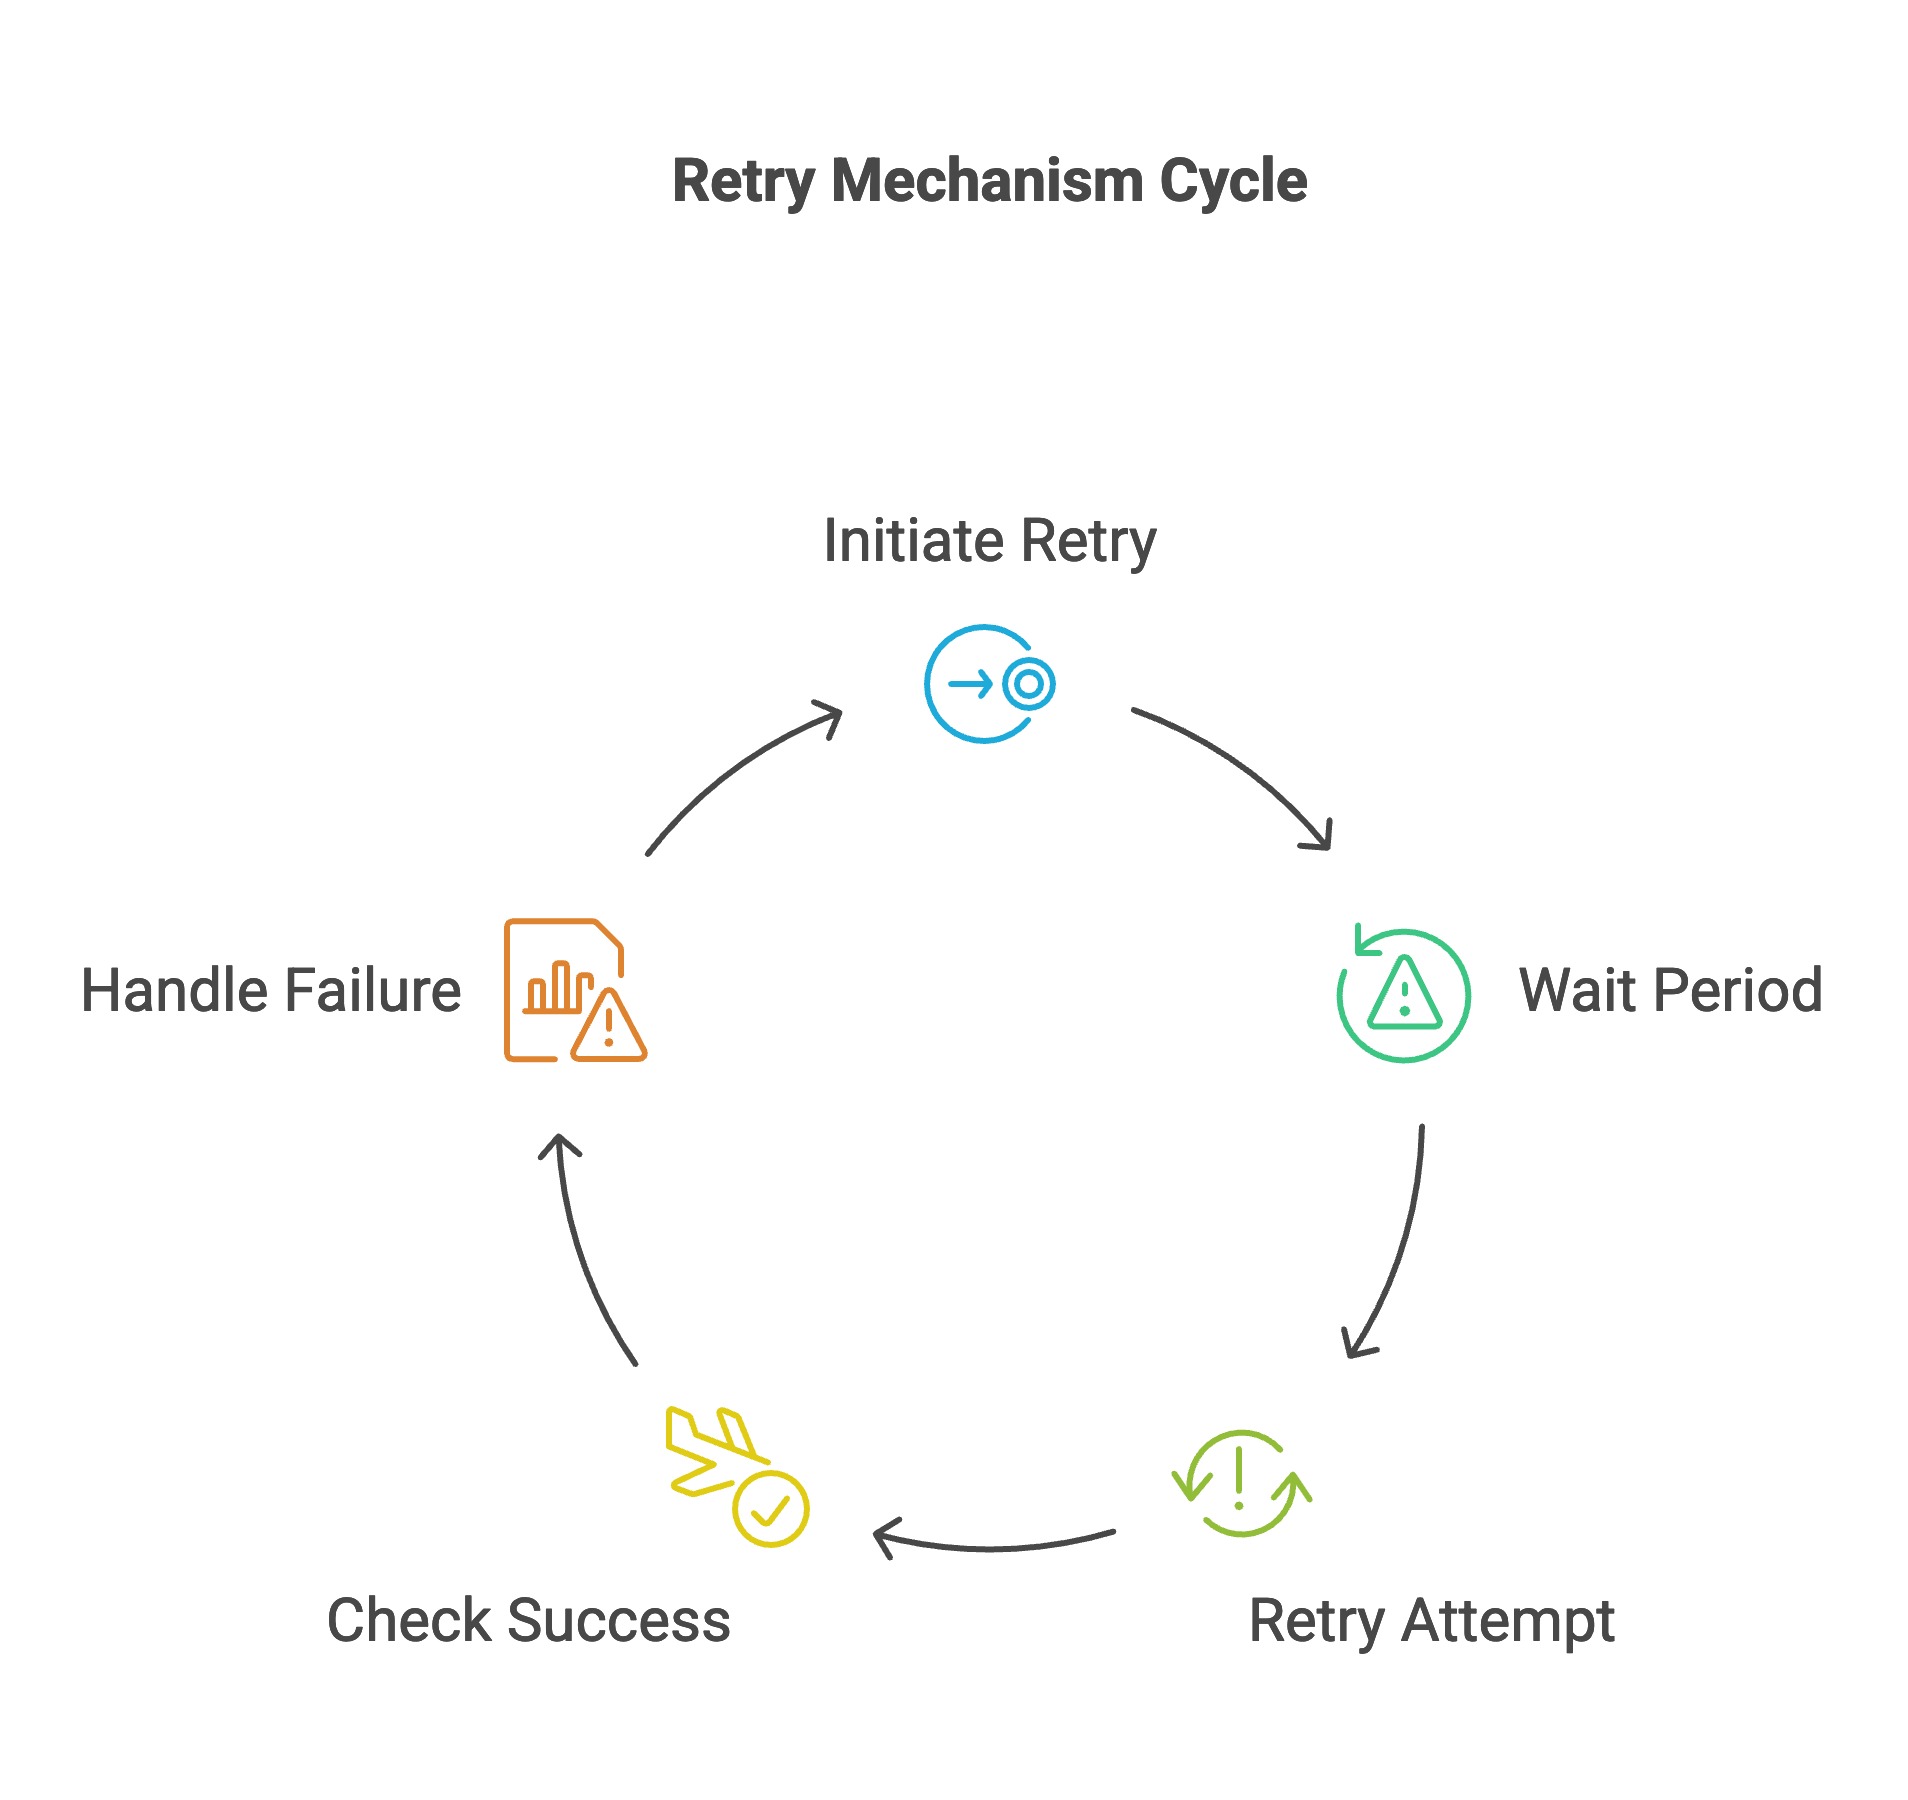
Retrying a failed operation is a simple but effective way to handle transient faults. If a request to a service times out or returns an error due to a temporary issue (like a brief network glitch or the service being momentarily overwhelmed), the calling service can wait a bit and try the request again. Often the second attempt will succeed if the issue was transient. This improves user experience by avoiding unnecessary errors for one-off hiccups.
However, retries must be used carefully. It’s crucial to limit the number of retries and use exponential backoff (increasing the wait time between attempts) to avoid a retry storm that might flood the network or the struggling service. For example, a service might retry after 1 second, then 2 seconds, then 4 seconds, and give up after 3 attempts. Backoff (plus a bit of random jitter) prevents all clients from retrying in sync and knocking a service down harder. It’s also important that the operation being retried is idempotent, meaning it can be repeated without side effects. If not, a retry might cause duplicate actions (like charging a customer twice). In practice, many frameworks support configurable retry policies. For instance, in Java you might use Resilience4j or Spring Retry to automatically retry calls, and in .NET the Polly library does similarly.
Pros: Retries are straightforward to implement and great for transient failures that are likely to succeed on a second try. They improve resiliency without much complex logic.
Cons: If not bounded, retries can pile on extra load to a service that's already having a hard time — which can just make the problem worse. They also can increase latency for the end user (while the caller keeps retrying). That’s why combining retries with the next pattern (timeouts) and with circuit breakers is critical to know when to stop retrying.
Timeouts to Prevent Hanging
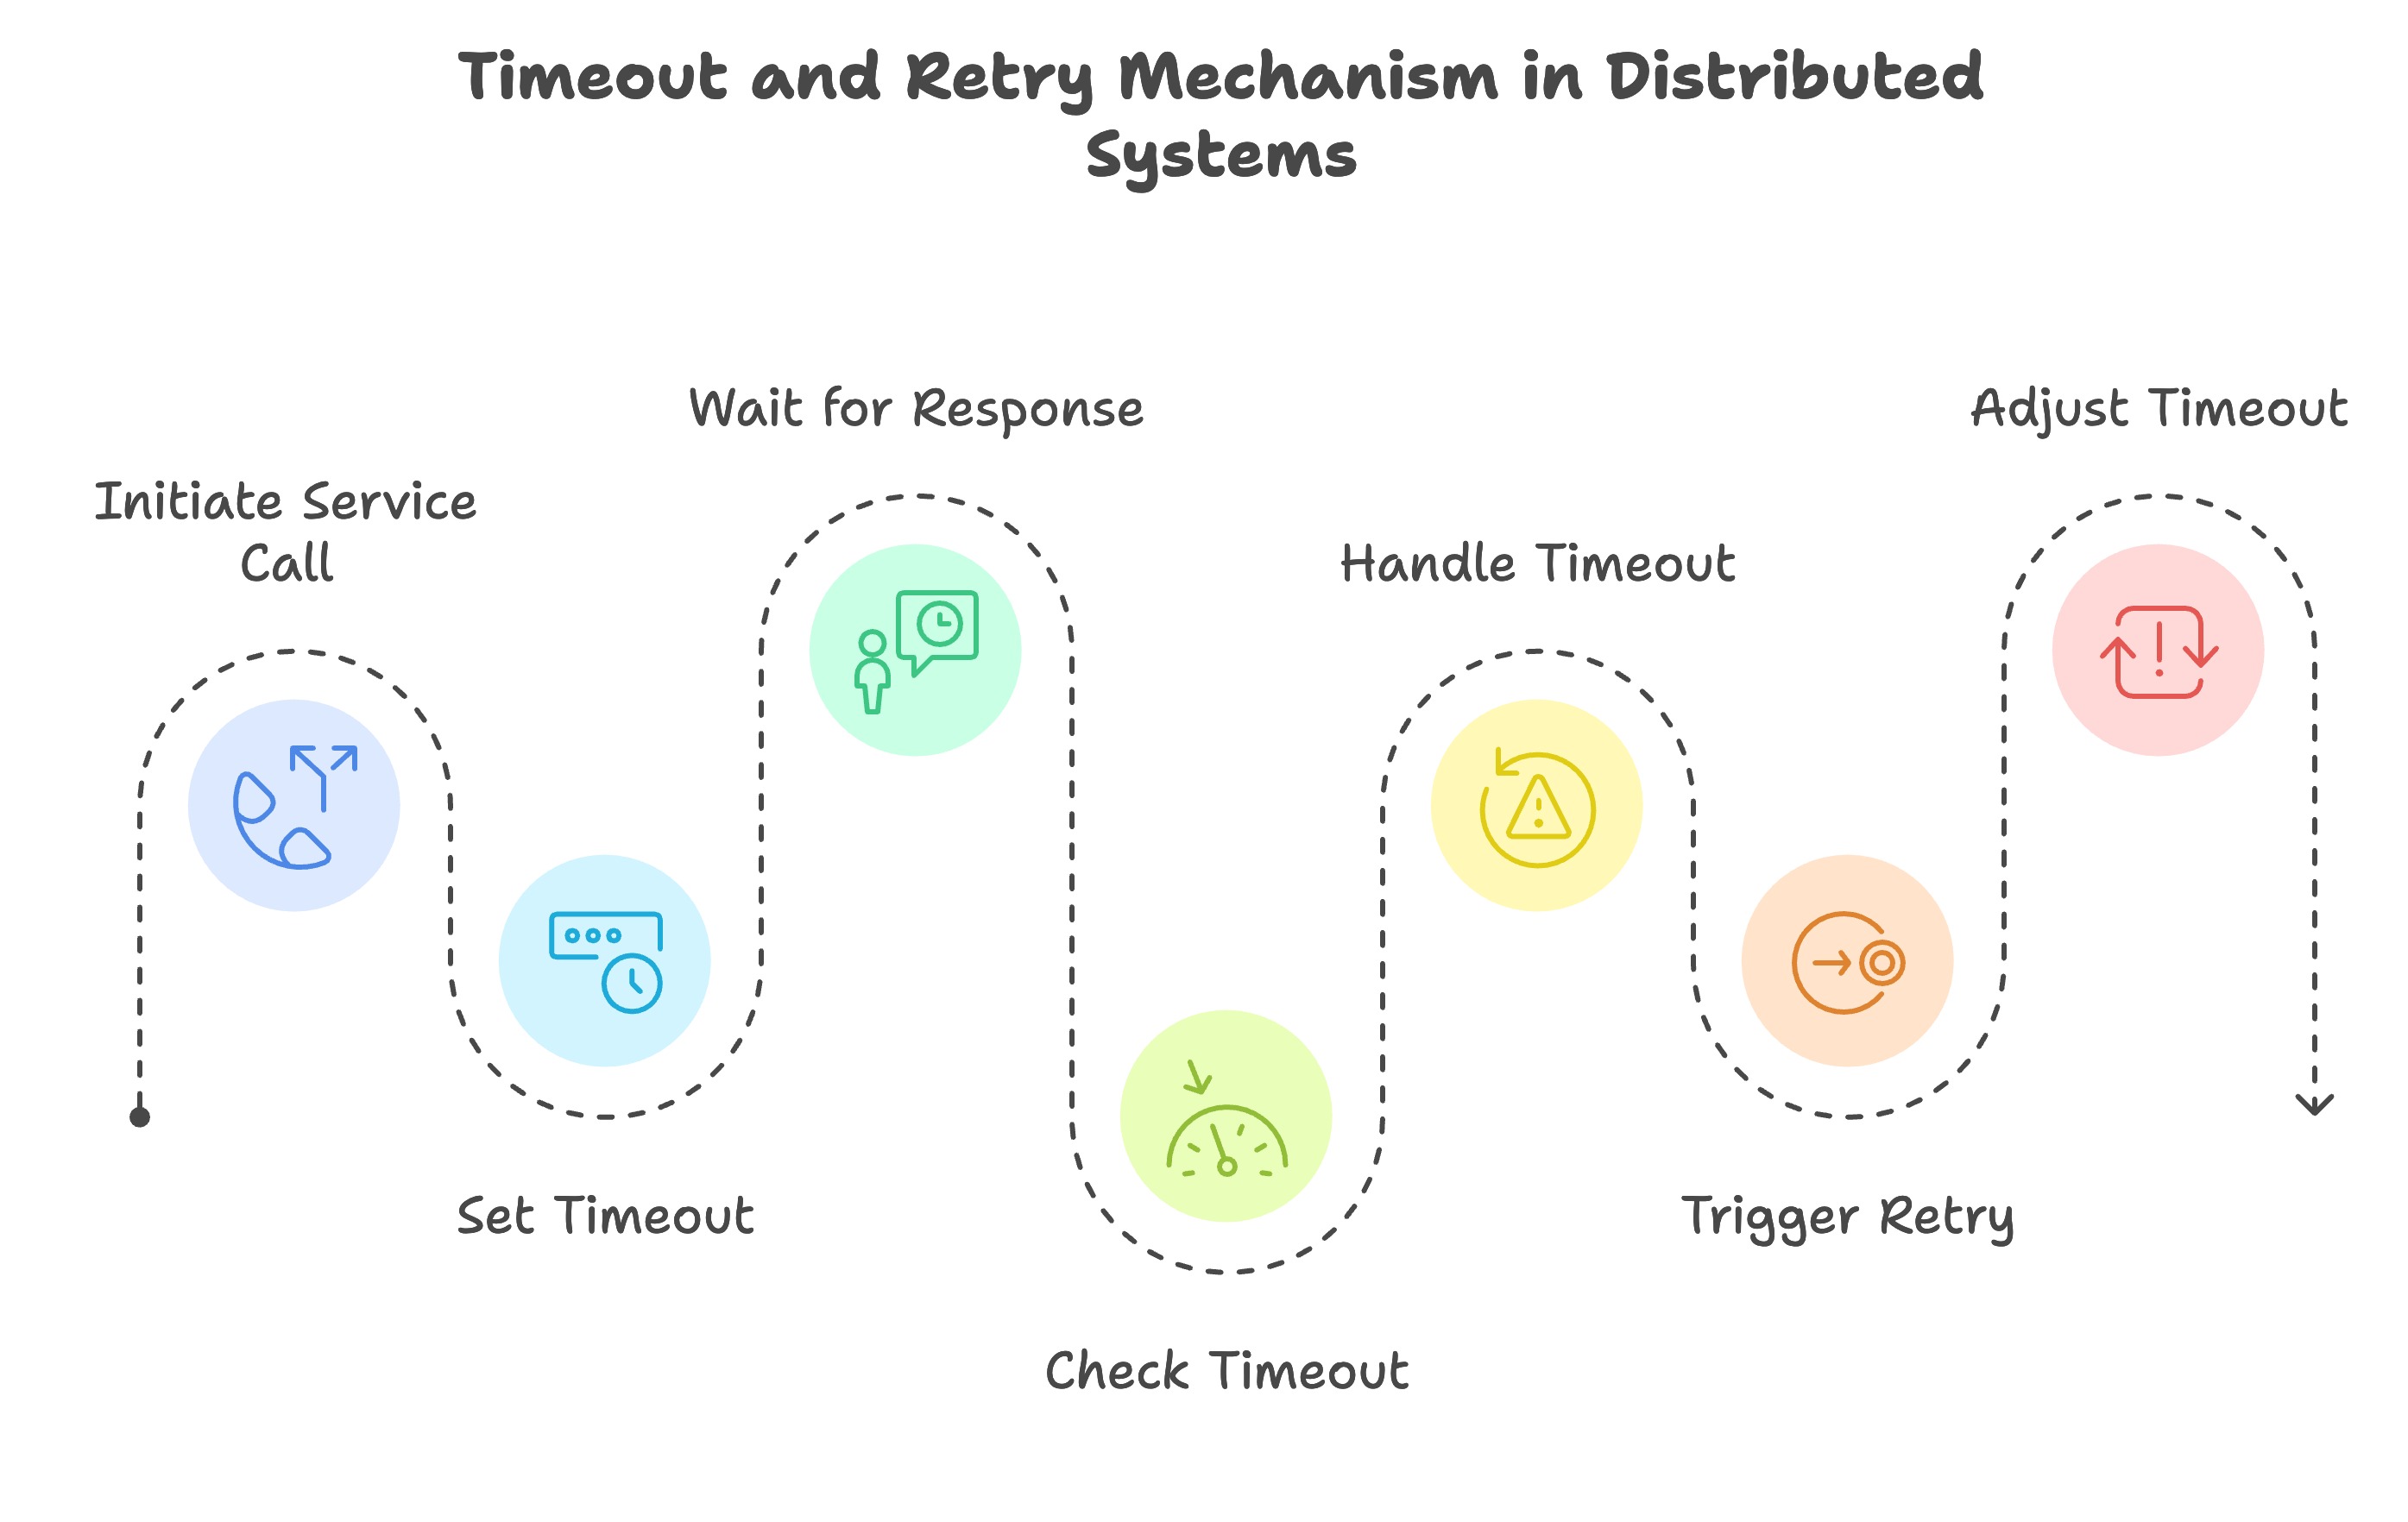
In any distributed system call, always apply a timeout. A timeout sets how long a service will wait for a response from another service or database before it decides to give up. Without timeouts, requests could get stuck waiting forever, tying up resources and blocking other requests from moving forward. Timeouts ensure that if a downstream service is unresponsive or slow, you fail fast and free up that thread or connection to do other work.
Setting the right timeout value requires balancing: too long a timeout and the user waits unnecessarily; too short and you might cut off a successful response. A common approach is to base timeouts on expected SLA of the service – e.g. if Service B usually responds in 100ms, maybe set a 300ms timeout for some buffer. If the timeout is exceeded, you can treat it as an error (often triggering a retry or a fallback). Timeouts work hand-in-hand with retries: for example, timeout after 300ms, then retry (with backoff). They also feed into circuit breakers (too many timeouts might trip the breaker, as repeated slow responses indicate a problem).
Pros: Timeouts prevent slow services from stalling the entire system . They release resources promptly and trigger your error-handling logic (retry or fallback) so that the user isn’t stuck waiting. This helps the system keep running smoothly.
Cons: Choosing timeout values can be tricky. If a timeout is set too low, you might cancel requests that would have succeeded (causing a failure that wouldn’t have happened). On the other hand, a too-high timeout just delays the inevitable. Also, a timeout by itself doesn’t solve the problem – you need a plan for what to do next (retry, return an error, etc.). It’s one piece of the puzzle, but an essential one.
Circuit Breakers
When a downstream service is consistently failing or unreachable, circuit breakers step in to protect your system. A circuit breaker is analogous to an electrical circuit breaker in your house: when too many faults happen, it “trips” and opens the circuit, preventing further attempts that are likely to fail. In microservices, a circuit breaker watches the interactions between services and stops calls to a service that is either down or severely struggling . This stops the system from wasting effort on calls that are unlikely to succeed and gives the downstream service some breathing room to recover.
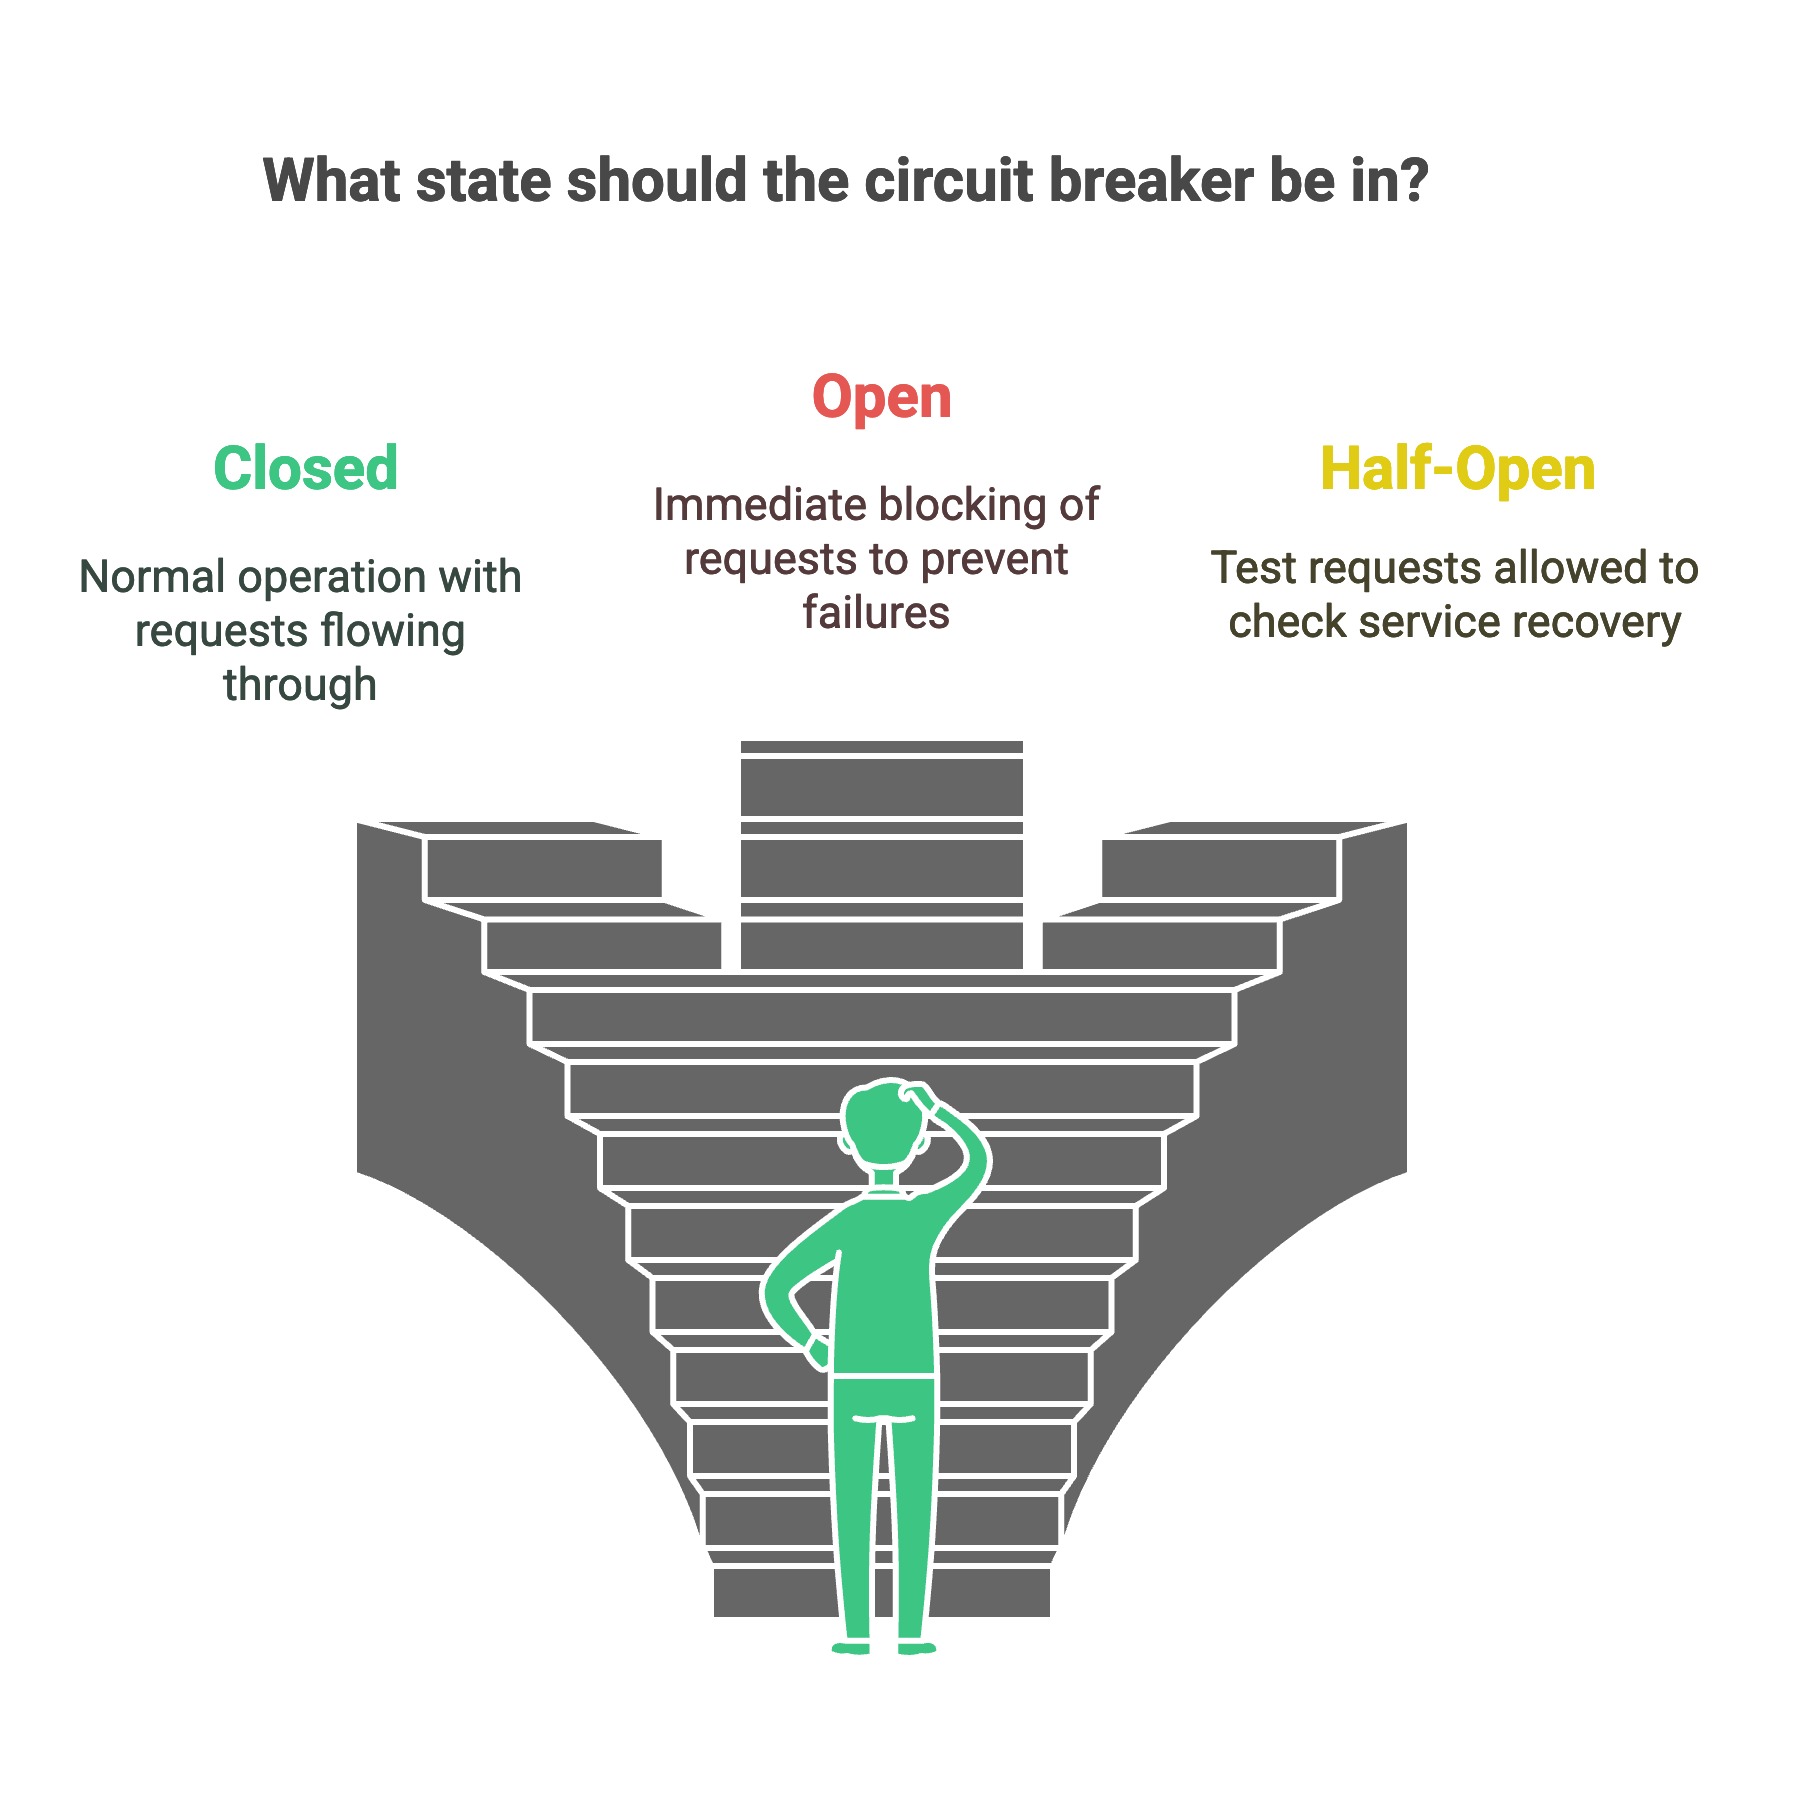
Circuit Breaker States: A circuit breaker usually cycles through three states—Closed, Open, and Half-Open. When it’s Closed, everything’s running smoothly, and requests pass through as normal. But if failures start piling up (like hitting 50% errors or too many timeouts in a short time), the breaker flips to Open. In the Open state, calls get blocked right away—instead of repeatedly trying a service that’s struggling, you immediately return an error or a fallback, saving time and resources.
After some cooldown period, the breaker enters Half-Open state, where it lets a small number of test requests through. If those calls go through successfully, it means the service has recovered, so the breaker closes and things go back to normal. If the test requests fail, the breaker goes back to Open for another wait period. This cycle prevents endless failures and tries to only resume calls when the service seems likely to be OK.
Circuit Breaker Pattern States – the breaker opens when failures exceed a threshold, then periodically allows test requests in half-open state to probe if the service has recovered.
Using circuit breakers, you can also provide fallback logic when the breaker is open – e.g., return cached data or a default response, so the user gets something useful (this is part of graceful degradation, discussed later). Libraries like Netflix Hystrix (now in maintenance) or newer ones like Resilience4j implement the circuit breaker pattern for you, tracking error rates and managing these state transitions automatically. Service meshes (like Istio) can even do circuit breaking at the network level for any service.
Pros: Circuit breakers help stop problems from spreading by isolating the service that’s failing. They also fail fast—a user gets an error or fallback immediately instead of waiting through retries to a down service. This improves overall system responsiveness and stability. Additionally, by shedding load to an unhealthy service, that service gets breathing room to recover rather than being hammered continuously.
Cons: Circuit breakers add complexity – there’s an extra component to configure and monitor. You need to tune the thresholds (how many failures trip it? how long to stay open? how many trial requests in half-open?) for your specific traffic patterns and failure modes. Misconfiguration can either make the breaker too sensitive (tripping too often) or not sensitive enough. Also, during the time a breaker is open, some functionality is unavailable (unless you have a good fallback), which might degrade the user experience – but arguably better a degraded experience than a total outage.
Rate Limiting and Throttling
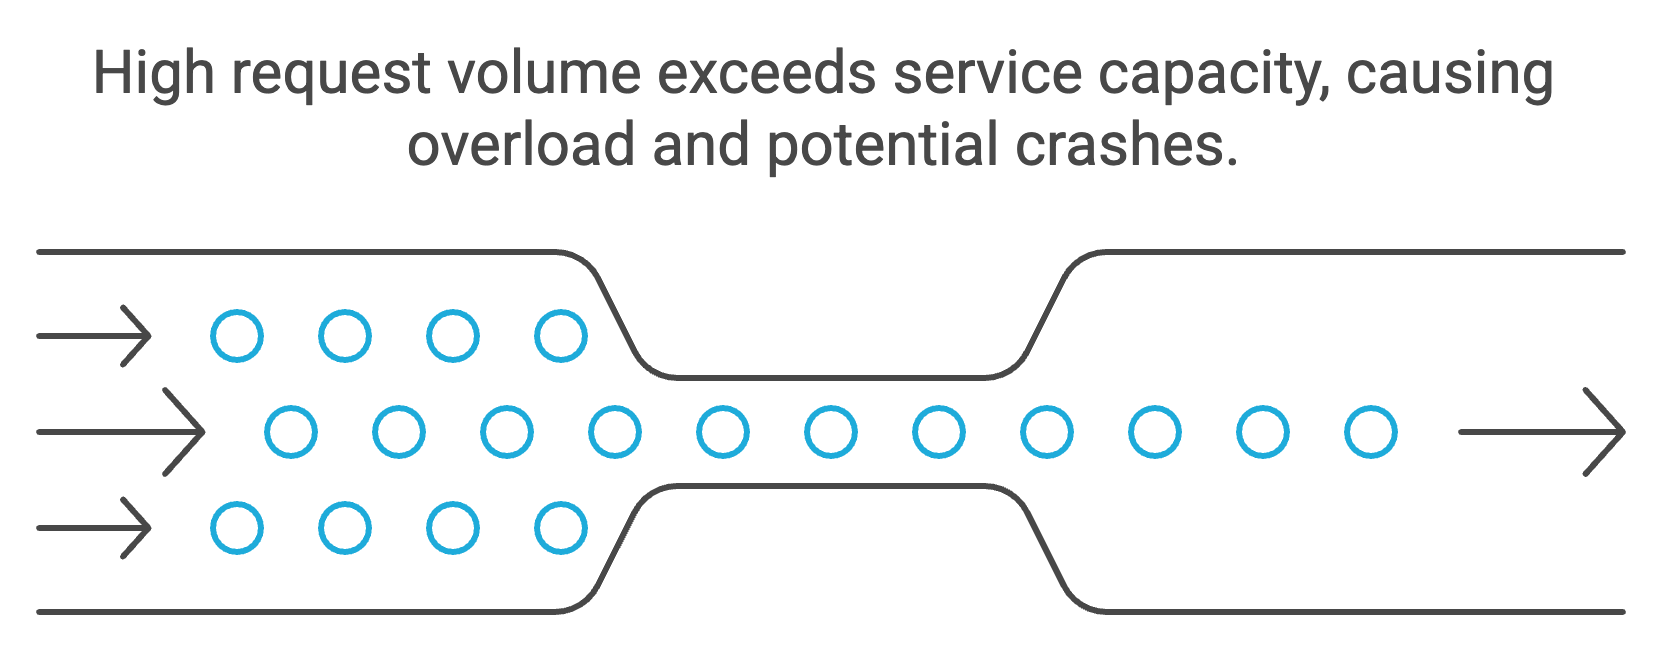
Sometimes the “failure” you need to handle is simply too much traffic. Services can become overwhelmed not just by internal failures, but by clients suddenly sending far more requests than the system can handle (whether due to a spike or a bug or malicious usage). Rate limiting is a strategy to curb the rate of incoming requests to a service, so that it doesn’t overload and crash. Essentially, you allow only a certain number of requests per second (or minute) and either queue or reject excess requests beyond that rate.
In practice, rate limiting often uses algorithms like token buckets or leaky buckets to smooth out bursts. You might implement it at an API gateway or load balancer in front of your service, or within the service code. For example, an API might enforce that each user can only make 100 requests per minute – ensuring fairness and protecting the backend from abuse. In a microservices context, you might also limit how quickly one service can bombard another.
By shedding excess load, the service can focus on handling a manageable volume of requests, thus maintaining overall system stability . This is sometimes called load shedding – under extreme load, prefer to serve fewer requests quickly and correctly, rather than trying to serve everything and failing across the board. It’s better for some users to get a “please try again later” than for all users to experience a crash.
Pros: Rate limiting helps keep important services from getting overloaded. It ensures graceful degradation under high load by dropping or deferring less important traffic . It also improves fairness (one noisy client can’t starve others) and can be used to enforce quotas or SLAs.
Cons: If not tuned, rate limiting can inadvertently reject legitimate traffic, hurting user experience. It also requires a strategy for what to do with excess requests (do you buffer them in a queue? Simply drop them?). In distributed systems, implementing a global rate limit is hard – you might have to coordinate counters across multiple instances. There’s also the question of which requests to shed first (some systems prioritize based on importance – e.g. drop reporting or analytics calls before user-facing ones).
Bulkhead Isolation
The term “bulkhead” comes from ship design – compartments in a ship ensure that if one section floods, it doesn’t sink the entire vessel. In microservices, the Bulkhead Pattern means isolating resources for each component or functionality so that a failure in one does not incapacitate others . Practically, this could mean allocating separate thread pools or connection pools for different downstream calls, or running certain services on dedicated hardware or Kubernetes nodes.
For example, imagine a service that calls two external APIs: one for payments and one for notifications. Without bulkheads, if the payment API hangs and all your service threads get stuck waiting on it, your service might exhaust its thread pool and be unable to even serve the (independent) notifications functionality. If you apply bulkheading, you could have one thread pool (or goroutine pool) for payment calls and a separate one for notification calls. Then a slowdown in payments will only exhaust the payment pool, while the notification pool is still free to process its tasks . In essence, you partition your system’s resources by concern, so that one failing part can’t exhaust everything.
Another example at the infrastructure level is running multiple instances of a microservice across different nodes or availability zones. That way, if one node has an issue, not all instances of the service are wiped out. Kubernetes can help here with anti-affinity rules (to not co-locate all replicas on one node) and PodDisruptionBudgets (to ensure a minimum number of pods remain up during maintenance). Bulkhead pattern can also mean having dedicated caches or databases per service, so one service’s DB overload doesn’t slow down another.
Pros: Bulkheads provide strong fault isolation . Each service or component gets its own sandbox of resources – if it fails or overloads, others continue running unaffected. This prevents cascade failures and increases overall system robustness. It’s especially useful to protect critical services from less critical ones (or from noisy neighbors in multi-tenant scenarios).
Cons: The downside is resource fragmentation. If you dedicate, say, 5 threads exclusively to payments and 5 to notifications, what if payments are idle but notifications have a huge backlog? You might be under-utilizing resources that could have been used elsewhere. Bulkheading requires you to forecast and allocate capacity per segment of your system, which isn’t always straightforward. It also adds configuration complexity – separate pools, separate deployments, etc. Still, in systems where reliability is paramount, accepting some inefficiency in exchange for isolation is usually worth it.
Graceful Degradation and Fallbacks
Despite all these protective measures, sometimes a part of your system will fail outright or become unavailable. Graceful degradation means designing your application to degrade gracefully when that happens, rather than catastrophically crashing or returning cryptic errors. In practice, this involves implementing fallbacks – alternative code paths or default behaviors that activate when a dependency is unavailable .
For example, if your personalized recommendations service is down, your e-commerce site could fall back to showing best-selling products (a generic list) instead of personal recommendations. Users still see product suggestions – not as tailored, but better than an error message or an empty section. Similarly, if an optional microservice like a user review service is slow, you might time out and simply display the page without reviews, perhaps with a note like “Reviews are unavailable at the moment.” The key is the core functionality continues to work, and users are informed subtly that a feature is degraded rather than the entire app failing.
Graceful degradation often goes hand-in-hand with the other patterns: circuit breakers trigger the fallback logic when tripped, and bulkheads ensure other parts can still function. Feature toggles can also help – you can automatically disable certain non-critical features in an outage to reduce load. Caching can also help with graceful degradation—by serving stored data when the live source isn’t available.
Pros: This pattern maintains partial functionality for the user . Rather than an all-or-nothing system, you prioritize what’s most important and ensure that remains available. It improves user experience by at least providing a meaningful response or page, even if some features are absent. It also buys you time – if users can still do the primary tasks, your team can work on the outage for the secondary service without fire-fighting a total production outage.
Cons: Implementing fallbacks increases development effort – you basically need to handle double logic (the primary path and the secondary path). Not everything has an obvious fallback; some features might just have to be offline. And if you rely too much on degraded mode, you might miss that a dependency is down (so make sure to still alert on it!). But overall, the cons are minimal compared to the reliability gained by thoughtful graceful degradation.
To summarize these patterns: each one addresses a specific failure mode, and they are even more powerful when combined. For instance, you might set a timeout on a request, retry a couple times with backoff, then if still failing trigger the circuit breaker which cuts off calls and uses a fallback – all while other parts of the system remain safe thanks to bulkheads and rate limits. Next, we’ll compare these strategies side-by-side and then dive into observability and how to monitor all this in Kubernetes.
Comparing Resilience Strategies
The following table compares the key resilience strategies – retries, circuit breakers, timeouts, rate limiting, and bulkheads – highlighting their benefits, drawbacks, and best-fit scenarios:
|
Resilience Strategy |
Pros |
Cons |
Best Use Cases |
|
Retries (with backoff) |
– Simple to implement; addresses transient faults effectively– Increases success rate for momentary glitches (network blips, etc.) |
– Can increase load if overused (risk of retry storms)– Adds latency if many retries; requires idempotent operations |
– Handling intermittent failures (e.g. brief network timeouts)– Use in combination with timeouts and only for operations safe to repeat |
|
Circuit Breakers |
– Prevent cascade failures by halting calls to bad components – Fail-fast improves user experience during outages (no long hangs)– Allows downstream service time to recover |
– Introduces complexity (must manage states and thresholds)– Misconfiguration can trigger too often or not enough– While open, some functionality is unavailable (need fallbacks) |
– Calling external or unstable services where failures can spike– Protecting critical pathways from repeated failures in dependencies– Use when you can provide a reasonable default response on failure |
|
Timeouts |
– Prevent system hanging on slow responses – Frees resources promptly, enabling quicker recovery or retries– Essential for keeping threads from blocking indefinitely |
– Choosing the right timeout is hard (too low = false fail, too high = slow)– A timeout still results in an error unless paired with retry/fallback– If misused, can cut off genuinely slow but needed responses |
– All external calls should have a timeout (baseline best practice)– Use shorter timeouts on interactive user requests, slightly longer for background tasks– Tune based on observed response times and SLOs (e.g. 95th percentile latency) |
|
Rate Limiting |
– Shields services from overload by shedding excess load – Ensures fair usage (no single client can hog resources)– Can maintain overall system responsiveness under high load |
– Legitimate traffic might be dropped if limits are too strict– Needs coordination in distributed systems (to enforce global limits)– Users may see errors or throttling responses if hitting the limit |
– Public APIs or multi-tenant systems to enforce quotas– Protecting downstream services that have fixed capacity or costly operations– As a form of “load shedding” during traffic spikes (serve most users normally, shed the rest) |
|
Bulkheads |
– Strong fault isolation: one service’s failure can’t take down others – Preserves resources for critical functions even if others fail– Improves stability in complex systems by containing failures |
– Can lead to under-utilization (static partitioning of resources)– More configuration (managing separate pools, deployments, etc.)– Hard to predict optimal resource split among components |
– Separating critical vs non-critical workloads (e.g. dedicate capacity for core features)– Any scenario where one bad actor or heavy load could starve others (thread pools per client or function)– Deploying redundant instances across different nodes/zones to avoid single points of failure |
As the table suggests, each strategy has a role to play. Often, you will combine several of them to cover different failure scenarios. For example, a well-designed microservice might include timeouts for all outbound calls, retries to handle temporary failures, a circuit breaker to prevent cascading issues during persistent outages, bulkhead isolation to keep one part of the system from overwhelming the rest, and rate limiting on incoming requests to protect against overload. These patterns complement each other. The end goal is a service that remains responsive and correct, delivering at least a baseline service to the customer even when dependencies misbehave or the system is under stress.
Now that we’ve covered how to build fault tolerance into the code and architecture, let’s turn to observability – how do we ensure we can monitor and alert on all these moving parts?
Observability and Monitoring in Practice
Building a fault-tolerant system is not just about writing resilient code; it’s also about having excellent visibility into the system’s behavior at runtime. Observability is about instrumenting the system so that you can answer the question “what’s going on inside?” by examining its outputs (logs, metrics, traces). In the context of SRE practices, observability and monitoring are what enable us to enforce reliability targets and catch issues before they impact customers. Let’s discuss how to integrate observability into your microservices and Kubernetes deployments.
Health Checks and Kubernetes Probes
One of the simplest but most effective observability mechanisms is the health check. A health check is an endpoint or function that reports whether a service is healthy (e.g., can connect to its database, has its necessary conditions met, etc.). Health checks are used by Kubernetes through liveness and readiness probes to automate self-healing and rolling updates:
-
Liveness Probe: Tells Kubernetes if the container is still alive and working. If the liveness check fails (for example, your app’s health endpoint is unresponsive or returns an unhealthy status), Kubernetes will assume the container is deadlocked or crashed and will restart it . This is great for automatically recovering from certain failures – your app will be restarted without human intervention, improving uptime.
-
Readiness Probe: This tells Kubernetes whether your application is ready to serve requests. If the probe fails, the pod isn’t shut down—instead, Kubernetes simply stops routing traffic to it by removing it from the service endpoints. The container keeps running in the background, giving it time to recover and become ready again without being restarted. This allows an app to signal “I’m not OK to serve right now” (e.g., during startup, or if it lost connection to a dependency) so that no requests are routed to it until it’s ready again. This prevents sending traffic to a broken instance.
You can implement probes as simple HTTP endpoints (like /healthz for liveness, /ready for readiness) or even just a TCP socket check. Here’s an example of how to configure liveness and readiness probes in a Kubernetes Deployment YAML:
containers:

- name: my-service

  image: my-service:latest

  ports:

  - containerPort: 8080

  livenessProbe:

    httpGet:

      path: /healthz    # health endpoint for liveness

      port: 8080

    initialDelaySeconds: 30

    periodSeconds: 15

    timeoutSeconds: 5

  readinessProbe:

    httpGet:

      path: /ready      # ready endpoint for readiness

      port: 8080

    initialDelaySeconds: 5

    periodSeconds: 10

    timeoutSeconds: 3
In this snippet, Kubernetes will start checking the liveness of the pod 30 seconds after it starts, hitting /healthz. If that endpoint fails too many times, Kubernetes will kill and restart the container. The readiness check begins 5 seconds after the pod starts. Until the /ready endpoint responds successfully, the pod won’t receive any traffic from the service. These probes implement automatic self-healing and load balancing control—a cornerstone of SRE’s autonomous recovery principle (systems that fix themselves) .
Beyond Kubernetes-level health checks, you should also consider application-level health. Many microservices include a health check that also verifies connections to crucial dependencies (database, message queue, etc.) and perhaps the status of recent operations. This can feed into readiness status – e.g., if DB is down, mark the app as not ready. Fail fast and stop taking requests if you know you can’t handle them properly.
Metrics, Logging, and Tracing (The Three Pillars)
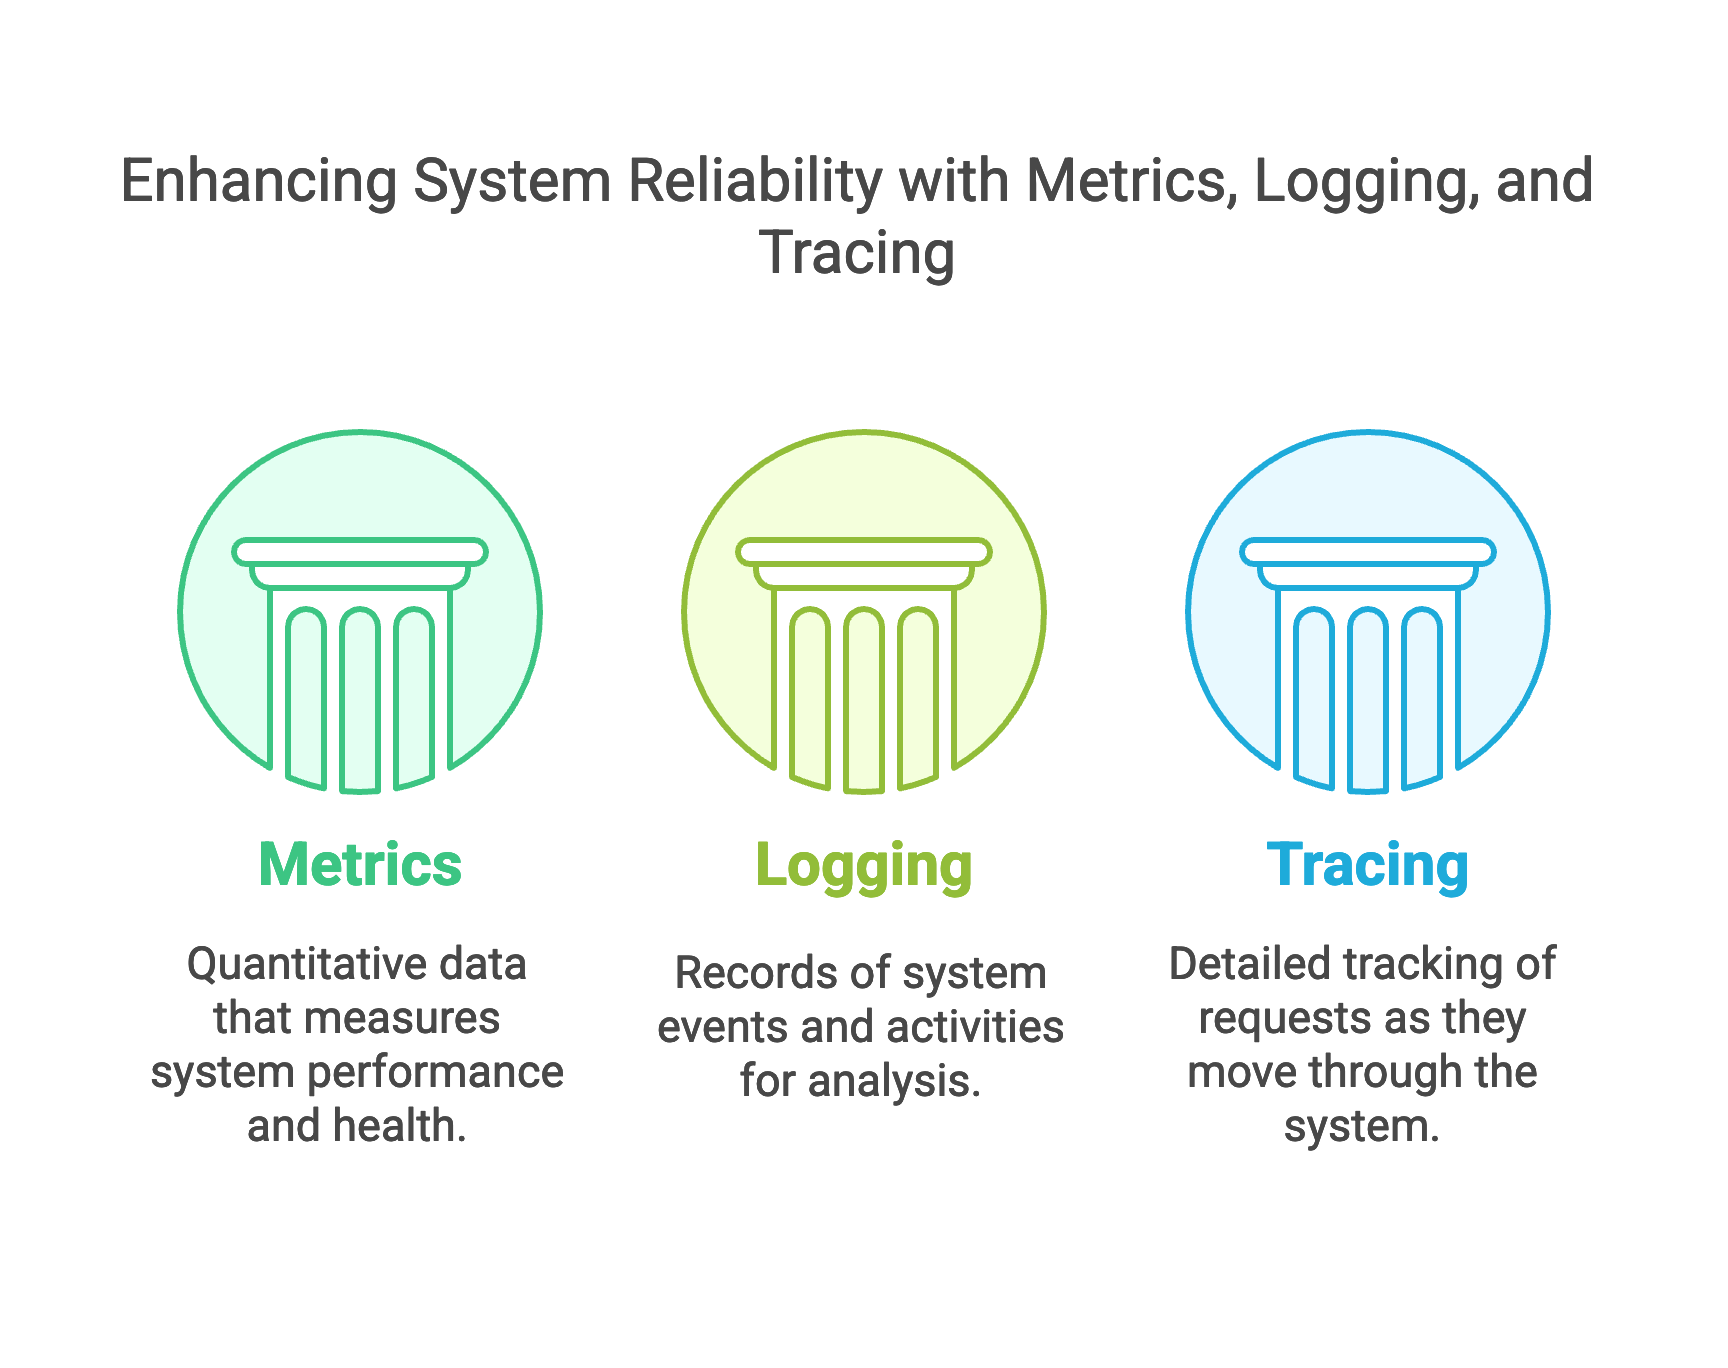
A robust observability setup typically stands on three pillars: metrics, logs, and traces. Each provides a different view:
-
Metrics are numeric measurements over time – things like request rates, error counts, latency percentiles, CPU usage, memory, etc. Metrics are key for monitoring trends and triggering alerts. For microservices, important metrics include HTTP request throughput, response times, error rates (e.g. number of 5xx responses), database query durations, queue lengths, and so on. SRE often focuses on the “four golden signals” of latency, traffic, errors, and saturation—for each service, you’d want to measure how long requests take, how many are coming through, how many are failing, and resource usage like CPU/memory or backlog. By instrumenting your code to record metrics (for instance, using Prometheus client libraries or OpenTelemetry metrics), you gain the ability to see how the system is performing internally.
-
Logs are the sequence of events and messages that your services produce. They are indispensable for debugging. When something goes wrong (e.g., a circuit breaker trips or a request fails after all retries), the logs will contain the details of what happened. Aggregating logs from all microservices (using a centralized logging system like the ELK stack – Elasticsearch/Kibana – or cloud log solutions) is important so you can search across services. With microservices, a single user transaction might produce logs in multiple services – having them indexed with timestamps and maybe a trace ID (more on that next) will help reconstruct the story when investigating incidents.
-
Distributed Tracing ties everything together by tracking the path of a request as it flows through multiple services. Each request gets a unique trace ID, and each service records spans (with timing) for its part of the work. This allows you to see, for example, that a user request to endpoint /checkout touched Service A (200ms), then called Service B (150ms of which 50ms was waiting on Service C), etc., and ultimately one component had a 500ms delay that slowed down the whole request. Tracing is extremely useful for pinpointing where in a complex chain a slowdown or error occurred. Tools like Zipkin, Jaeger, or OpenTelemetry’s tracing can be integrated into your microservices. Many frameworks will automatically propagate trace IDs (often via headers like X-Trace-ID) so that all logs and metrics can also be tagged with the trace, giving you a correlated view. Distributed tracing brings insight into cross-service interactions that metrics and logs alone might miss .
Implementing these in Kubernetes: you might deploy a Prometheus server to scrape metrics from all services (each service exposes an HTTP /metrics endpoint). You’d set up a Grafana dashboard to visualize metrics and look at trends (e.g., request rate vs error rate over time). For logs, you could use Fluentd/Fluent Bit as a DaemonSet to collect container logs and send to Elasticsearch or a hosted logging service. For tracing, running a Jaeger agent or OpenTelemetry Collector on the cluster can gather spans from services and store them for analysis. Modern service meshes also often collect metrics and traces automatically for all traffic, which can be a shortcut to instrumenting every service.
Conclusion
Delivering reliable microservices from code to customer requires a blend of smart design, engineering discipline, and operational awareness. By implementing resilience patterns such as retries, circuit breakers, timeouts, rate limiting, and bulkheads, we can make our microservices robust against many types of failures. Techniques like graceful degradation ensure that even when something does break, users experience a degraded service rather than a total outage. Running these services on Kubernetes, we leverage features like liveness/readiness probes and auto-scaling for self-healing and responsiveness. At the same time, observability and SRE practices tie it all together—with thorough monitoring, logging, tracing, and alerting, we catch issues early and meet our reliability targets. As one author put it, building fault-tolerant microservices requires a combination of “redundancy, isolation, graceful degradation, monitoring, automated recovery, and rigorous testing,” all working in unison .
By investing in these patterns and practices, you ensure that your microservices can withstand failures and still serve your customers. The road from code to customer is fraught with unexpected bumps—but with a fault-tolerant architecture and observability-driven operations, you can navigate it, delivering a smooth and reliable experience to users. In the end, resilience is not just a technical feature, but a customer feature: it keeps your service trustworthy and responsive, which is what ultimately keeps your users happy.
Opinions expressed by DZone contributors are their own.
Comments