HDFS Offline Analysis of FsImage Metadata
We take a look at how to analyze and visualize metadata stored in XML files using some open source big data tools, such as HDFS, Hive, and GnuPlot.
Join the DZone community and get the full member experience.
Join For FreeOverview
HDFS, which is a part of Hadoop, has a command to download a current namenode snapshot. We can load image via Spark or perform data ingestion on it to get it into Hive to analyze the data and verify how it uses HDFS.
The HDFS file system metadata is stored in a file called 'FsImage.' Contained in this snapshot we have:
- The entire file system namespace.
- Maps, blocks, and file replication.
- Properties such as quotas, ACLS, etc.
The problem I had to solve is the following:
- Run the command to download the image and generate an XML file.
- Implement a Spark job to process and save the data in a Hive table.
- Analyze some data using Hive SQL and plot the data with GnuPlot.
1. Generating an HDFS FsImage
The FSImage can generate an image in CSV, XML, or a distributed format, in my case I had to evaluate the blocks and ACLS; as they are fields of type array, they do not work in the CSV format. You can see more details here:
To generate an image, check where it is in the name node:
hdfs getconf -confKey dfs.namenode.name.dirNow let’s download the image to /tmp. In my case, the file that was being analyzed is 35 GB in size:
hdfs dfsadmin -fetchImage /tmpIt is now necessary to convert this to a readable format, in this case, XML:
hdfs oiv -p XML -i /tmp/fsimage_0000000000000103292 -o fsimage.xml1.1 Loading the File Into Spark and Saving it to a Hive Table
I used the Databricks library for XML, and it is very easy to load because it already transforms the data into a data frame. You can see all the details here: https://github.com/databricks/spark-xml.
The structure of my Hive table is as follows:
USE analyze;
CREATE EXTERNAL TABLE IF NOT EXISTS analyze.fsimage_hdfs
(
  id string COMMENT 'Unique identification number.',
  type string COMMENT 'Type of data: directory or file, link, etc...',
  name string COMMENT 'Name of the directory or file..',
  replication string COMMENT 'Replication number.',
  mtime string COMMENT 'The date of modification.',
  atime string COMMENT 'Date of last access.',
  preferredblocksize string COMMENT 'The size of the block used.',
  permission string COMMENT 'Permissions used, user, group (Unix permission).',
  acls string COMMENT 'Access Permissions: Users and Groups.',
  blocks string COMMENT 'Size blocks',
  storagepolicyid string COMMENT 'ID number of the access policies.',
  nsquota string COMMENT 'Quota name, if -1 is disabled.',
  dsquota string COMMENT 'Space available and evaluated for user/group, if -1 is disabled.',
  fileunderconstruction string COMMENT 'File or directory still under construction/replication.',
  path string COMMENT 'Path of the file or directory.'
)
PARTITIONED BY (odate string, cluster string)
ROW FORMAT SERDE 'parquet.hive.serde.ParquetHiveSerDe'
STORED AS INPUTFORMAT 'parquet.hive.DeprecatedParquetInputFormat'
OUTPUTFORMAT 'parquet.hive.DeprecatedParquetOutputFormat'
LOCATION '/powerhorse/bicudo/analyze/fsimage_hdfs';
In this scenario, because there are other clusters to be analyzed, a partition was created with the ISO standard ingestion day and the cluster name.
Using the spark-xml library, ut is very easy to make the parser in the file, read, modify, and save the data. Here's a simple example of loaded XML data:
val df = sparkSession.sqlContext.read
  .format("com.databricks.spark.xml")
  .option("rowTag", "inode")
  .option("nullValue", "")
  .load(pathFsImage)
I also created some sample code that you can run and test with your image: https://github.com/edersoncorbari/scala-lab
1.2 Analyzing Information and Plotting With GnuPlot
In these analyses, I used SQL and the GnuPlot to view the data. Some other interesting tools are:
Continuing with our job batch data, we can now do some analysis. Generating a histogram with the most commonly used replication values in the cluster:
SELECT cast(hist.x AS int) AS x,
       cast(hist.y AS bigint) y
FROM
  (SELECT histogram_numeric(cast(replication AS DOUBLE), 40) AS T0
   FROM analyze.fsimage_hdfs
   WHERE dataingestao='2019-01-27'
     AND CLUSTER='SEMANTIX_NORTH'
     AND preferredblocksize <> '')
   T1 LATERAL VIEW explode(T0) exploded_table AS hist;
There are several types of graphics you can make using GnuPlot, please look here for more examples: GnuPlot Demos. It is necessary that you copy the output in the histogram and place it in the example file replication.dat:
Replication_XReplication_Y
129
13
277975
212602
247204
2139973
217612
224402
3170164
37461229
311038655
31443494
31910188
109267
106492
101719
101207
101318
Now copy the code below and run:
#!/usr/bin/gnuplot
reset
clear

set datafile separator "\t"
set terminal png size 1024,768
set output "histogram-replication.png"

set title "Replication Cluster - Semantix North"
set xlabel "(X)"
set ylabel "(Y)"
set key top left outside horizontal autotitle columnhead

plot 'replication.dat' u 1:2 w impulses lw 10
The generated data will look like this:

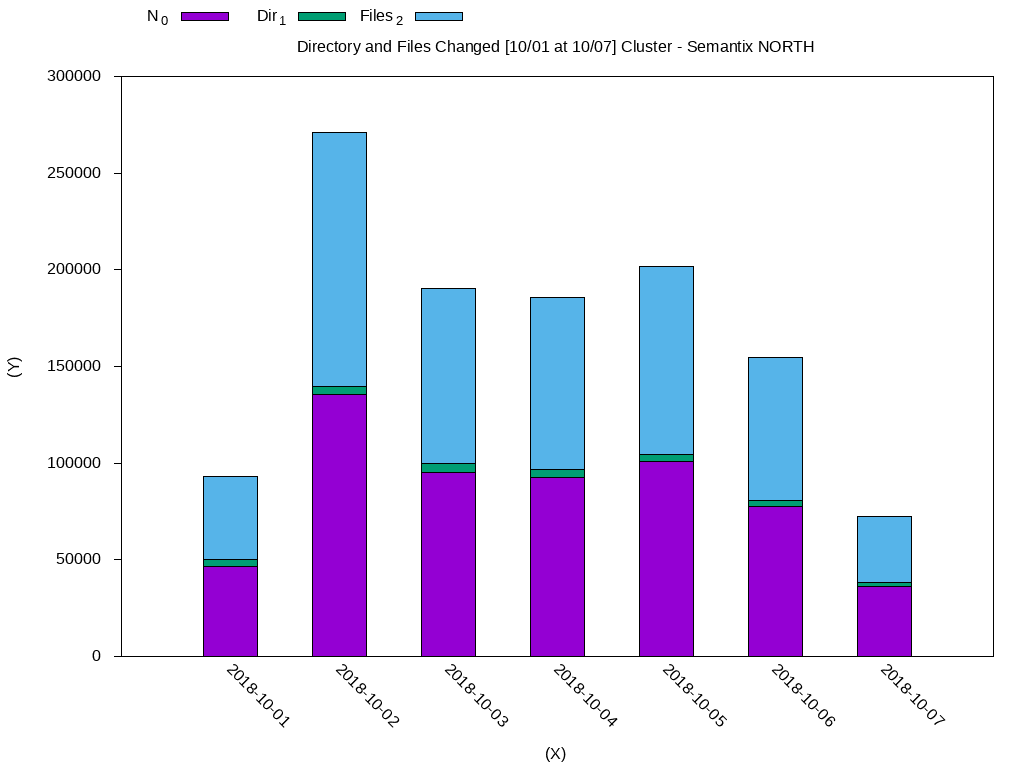
In this case, most data is using replication block 3. We can do another analysis, to check the files that were modified in the period of one week. Below, I have standardized the output of the histogram with the weekly-changes.dat file:
DateN_0Dir_1Files_2
2018-10-0146588.03579.043009.0
2018-10-02135548.04230.0131318.0
2018-10-0395226.04600.090626.0
2018-10-0492728.04128.088600.0
2018-10-05100969.03527.097442.0
2018-10-0677346.03455.073891.0
2018-10-0736326.01711.034615.0
Using GnuPlot:
#!/usr/bin/gnuplot
reset
clear

set datafile separator "\t"
set terminal png size 1024,768
set output "histogram-weekly-changes.png"

set title "Directory and Files Changed [10/01 at 10/07] Cluster - Semantix NORTH"
set xlabel "(X)"
set ylabel "(Y)"

set key top left outside horizontal autotitle columnhead
set xtic rotate by -45 scale 0
set ytics out nomirror
set style fill solid border -1
set boxwidth 0.5 relative

set style data histograms
set style histogram rowstacked

plot 'weekly-changes.dat' using 2:xtic(1) ti col, '' u 3 ti col, '' u 4 ti col
The generated data will look like this:
I will leave some other queries that may be useful:
-- Convert Unix timestamp to ISO.
SELECT date_format(from_unixtime(cast(mtime/1000 AS bigint)), 'yyyy-MM-dd')
FROM fsimage_hdfs LIMIT 10;

-- Checking the size of the blocks used and converting bytes to GB.
SELECT permission,
  count(1) AS totalfiles,
  round(sum(cast(preferredblocksize AS DOUBLE))/1024/1024/1024, 2) AS sizegb
FROM fsimage_hdfs
WHERE odate='2019-01-22'
  AND `cluster`='SEMANTIX_NORTH'
GROUP BY permission LIMIT 10;

-- Files modified on a specific date.
SELECT count(*) FROM fsimage_hdfs WHERE odate='2018-12-22'
  AND `cluster`='SEMANTIX_NORTH'
  AND date_format(from_unixtime(cast(mtime/1000 AS bigint)),
'yyyy-MM-dd')='2019-01-22';
1.4 References
Documents that helped in the writing of this article:
Thanks!
Opinions expressed by DZone contributors are their own.
Comments