How to Benchmark PostgreSQL for Optimal Performance
Learn to benchmark PostgreSQL with pgbench, track metrics like transactions per second (TPS) and latency, and optimize for read, write, and mixed workloads.
Join the DZone community and get the full member experience.
Join For FreeAs PostgreSQL adoption grows, database administrators (DBAs) and developers often need to assess its performance to ensure their applications run efficiently under different workloads. Performance benchmarking is a critical process that measures how well PostgreSQL handles varying loads, helping identify bottlenecks and areas for optimization. This article explores tools, metrics, and test scenarios to help you benchmark PostgreSQL like a pro.
Why Benchmark PostgreSQL?
Benchmarking allows you to:
- Measure the throughput and latency of your database under specific workloads.
- Identify hardware or configuration bottlenecks.
- Compare the impact of optimizations like index changes or query rewrites.
- Simulate real-world scenarios such as high concurrent user activity or bulk data writes.
Key Metrics to Track
While benchmarking PostgreSQL, focus on these metrics:
- TPS (Transactions Per Second): Measures how many transactions the database completes in a second.
- IOPS (Input/Output Operations Per Second): Tracks disk activity.
- Latency: Measures the time taken to execute queries, which impacts user experience.
- Resource Utilization: Tracks CPU, memory, and disk usage during the benchmark.
Tools for PostgreSQL Benchmarking
1. pgbench
What is pgbench?
pgbench is PostgreSQL's built-in benchmarking tool. It simulates concurrent clients executing transactions and measures the database’s performance.
Installation
It is bundled with PostgreSQL installations. To verify, run:
bash
pgbench --version
Getting Started
1. Initialize a benchmark database:
bash
pgbench -i -s 50 mydb
Here, -s sets the scaling factor, which determines the size of the dataset.
2. Run a simple benchmark:
bash
pgbench -c 10 -j 2 -T 60 mydb
-c 10: Number of client connections.-j 2: Number of threads.-T 60: Benchmark duration in seconds.
Sample output:
transaction type: TPC-B (sort of)
scaling factor: 50
number of clients: 10
number of threads: 2
duration: 60 s
tps = 1420.123 (excluding connections establishing)
2. Sysbench
Why Use Sysbench?
Sysbench is a versatile benchmarking tool for databases and systems. It offers more flexibility than pgbench for custom workloads.
Installation
Install Sysbench using the following command:
bash
sudo apt-get install sysbench
Getting Started
1. Prepare the benchmark:
bash
sysbench --db-driver=pgsql --pgsql-db=mydb \
  --pgsql-user=postgres --tables=10 --table-size=1000000 \
  oltp_read_write prepare
2. Run the benchmark:
bash
sysbench --db-driver=pgsql --pgsql-db=mydb \
  --pgsql-user=postgres --threads=4 \
  --time=60 oltp_read_write run
3. pg_stat_statements
What is pg_stat_statements?
A PostgreSQL extension that tracks query performance and execution statistics. While it doesn’t simulate workloads, it helps analyze slow queries during benchmarks.
Setup
1. Enable the extension in postgresql.conf:
shared_preload_libraries = 'pg_stat_statements'2. Reload the configuration and create the extension:
CREATE EXTENSION pg_stat_statements;Usage
Run the following query to identify long-running statements:
SELECT query, total_exec_time, calls
FROM pg_stat_statements
ORDER BY total_exec_time DESC;
Benchmarking Scenarios
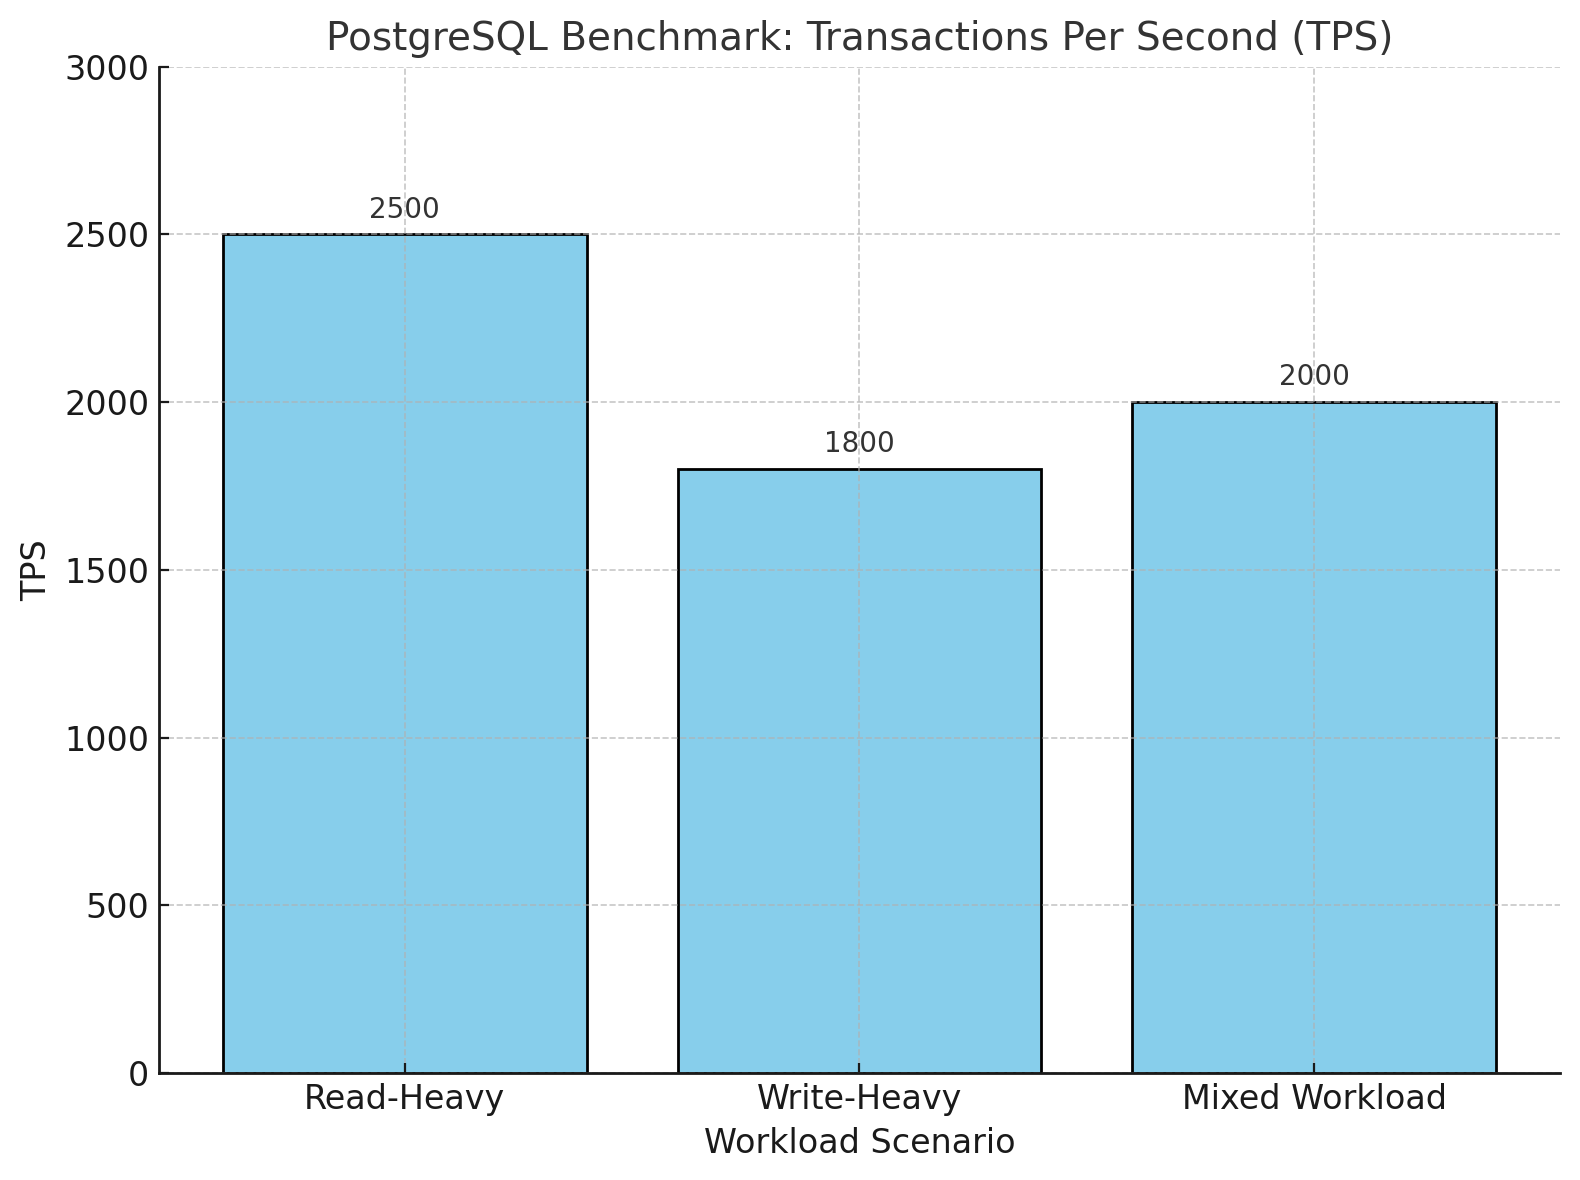
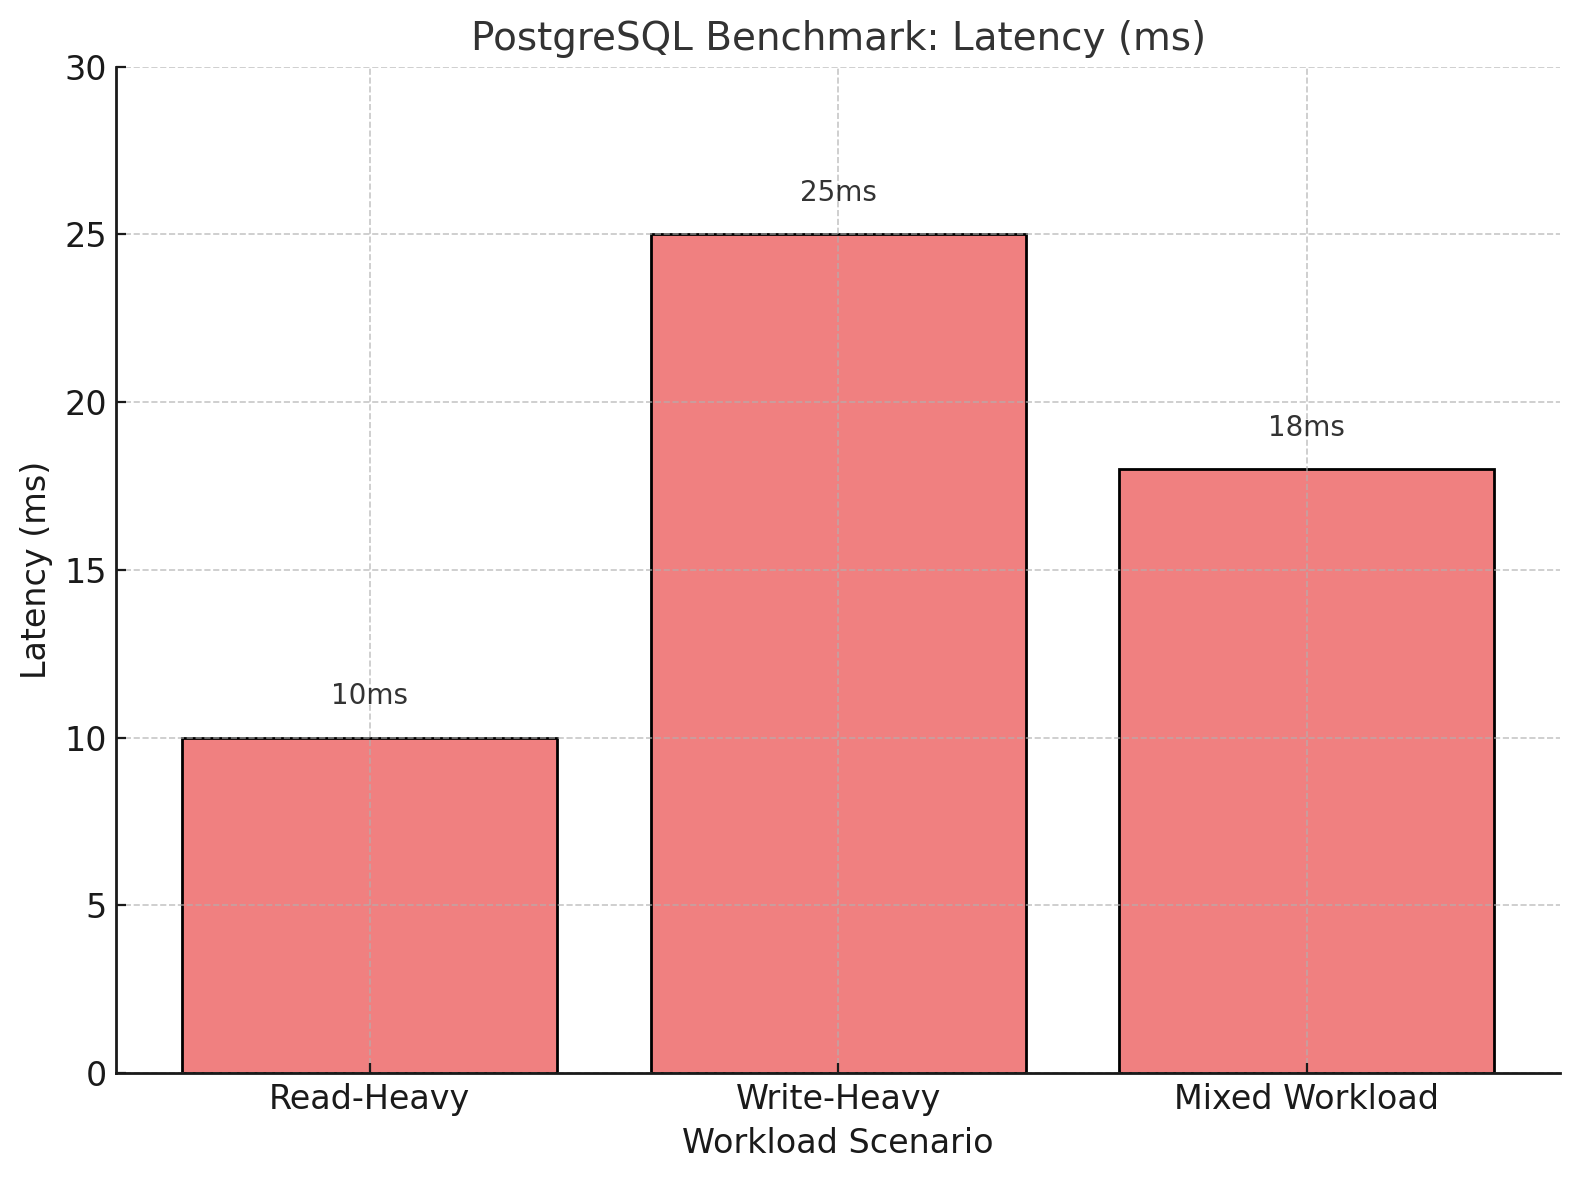
Below is a visual representation of the benchmark results for three scenarios: read-heavy, write-heavy, and mixed workloads. The transactions per second (TPS) diagram demonstrates PostgreSQL's ability to handle concurrent transactions efficiently, while the latency diagram illustrates the time taken for query execution in milliseconds.
PostgreSQL Transactions Per Second (TPS)
PostgreSQL Query Latency
Types of Workloads
1. Read-Heavy Workloads
Objective: Test database performance under high read activity.
Setup: Use pgbenchwith default read-only transactions:
bash
pgbench -c 50 -T 120 -S mydb-S: Execute only SELECT queries.-c 50: Simulate 50 concurrent clients.
2. Write-Heavy Workloads
Objective: Measure database performance with frequent inserts or updates.
Setup: Modify the benchmark to include writes:
bash
pgbench -c 20 -j 4 -T 120 -N mydb-N: Execute non-SELECT queries.
3. Mixed Read/Write Workloads
Objective: Simulate a real-world workload that mixes reads and writes.
Setup: Use a balanced configuration:
bash
pgbench -c 30 -j 4 -T 180 mydb
Optimizing PostgreSQL for Better Benchmark Results
Tune Memory Settings
Adjust these parameters in postgresql.conf:
shared_buffers = 25% of system memory
work_mem = 4MB
maintenance_work_mem = 64MB
Enable Parallel Query Execution
Adjust these parameters in postgresql.conf:
max_parallel_workers_per_gather = 4Optimize Disk I/O
Use SSDs for WAL files and tune these settings:
wal_buffers = 16MB
synchronous_commit = off
Example Results and Interpretation
Scenario: 50 concurrent clients running a read-heavy workload for 60 seconds.
Output:
tps = 2500.456 (excluding connections establishing)Interpretation: The database is capable of handling 2500 transactions per second under this workload.
If TPS is lower than expected, analyze query plans using EXPLAIN ANALYZE to identify performance bottlenecks.
Conclusion
Benchmarking PostgreSQL is a powerful way to identify performance limitations and optimize your database for various workloads. Tools like pgbench and sysbench, combined with insights from pg_stat_statements, enable you to simulate real-world scenarios and fine-tune PostgreSQL configurations.
By mastering these tools and techniques, you can ensure your PostgreSQL instance delivers high performance for both read-intensive and write-heavy applications.
Opinions expressed by DZone contributors are their own.
Comments