How to Debug Websites Using Safari Developer Tools
It's crucial to debugging websites for Safari before pushing them live. In this article, we look at how to debug websites using Safari Developer tools.
Join the DZone community and get the full member experience.
Join For FreeSafari is the default browser on iPads, Macbooks, and iPhones. It lies second on browser preferences, right after Chrome. Its 250+ features offer users striking benefits that set it apart from other most popular browsers like Chrome and Firefox. Building on that, iPhone’s popularity has resulted in a global smartphone market share of 53.6% for Safari.

Last year, Apple’s number of active devices witnessed a significant increase to 1.5 billion. Since the user base keeps rising, Apple constantly ensures a near-perfect user experience and optimized performance across all its devices.
Thanks to its good usability and the massive popularity of Apple devices, Safari has gained a broad user base. If that’s the case, it’s vital to offer them an ideal browsing experience across various browser versions. But once you go ahead and launch a website, debugging it after encountering a bug becomes almost impossible.
That’s why it’s crucial to debugging websites for Safari before they go out there. In this article, we look at how to debug websites using Safari Developer tools.
But before that, let’s check out why it’s vital to debug websites on Safari.
Let’s dive in.
Why Debug Websites on Safari?
Safari has been a part of the most popular browsers since 2003. Its first version was released the same year with Mac OS X Panther. Since the iPhone launched in 2007, a mobile version of Safari has been included in all iOS devices. If a user doesn’t change it, it’s the default browser on Apple devices.
Considering the number of Apple devices and their never-ending versions, the combinations of different features and screen resolutions are enormous. But when you debug websites on Safari before launch, your users can hop on to the Window that quickly takes them to your services and products.
Web developers must validate website appearance across different screen sizes to maintain cross-browser compatibility. This ensures the correct rendering of web pages across various browsers. It also provides a comparatively superior user experience with consistency. It’s also essential to consider how a particular version of Safari might interact with a device’s hardware specifications. This adds to another form of verification that is crucial for the web development pipeline.
Since Safari is the second most popular browser, businesses shouldn’t risk losing out on potential customers because of website bugs. After all, vulnerability, compromised navigation, and other incompetencies can turn a simple user interface into a screaming nightmare!
On the upside, device functionality and operating system are more superficial than Android devices. According to QA, deciding on a testbed is straightforward too.
Different Methods to Debug Websites Using Safari Developer Tools
Before debugging websites using Safari Developer tools, it’s essential to have a device that runs on iOS or macOS. This section will explore three different techniques to debug websites using Safari Developer tools.
- Debug Using Responsive Design Mode in Safari Developer tools.
- Debug Websites on Safari using Web inspector on iPhones and iPads.
- Debug Websites using Safari Developer tools on the LambdaTest platform.
- Remote debugging for iOS Safari on OS X.
Let’s take a look at different methods one by one!
Debugging Websites With Responsive Design Mode
In this section of the article on Developer tools for Safari, we will look at how you can debug the mobile view of a website using Safari Developer tools. Remember that you need to enable the Developer menu before accessing the responsive design mode since it’s disabled by default for Safari.
- After launching the Safari browser, select Preferences > Advanced.
- Check the box and click the Show Develop menu in menu bar.
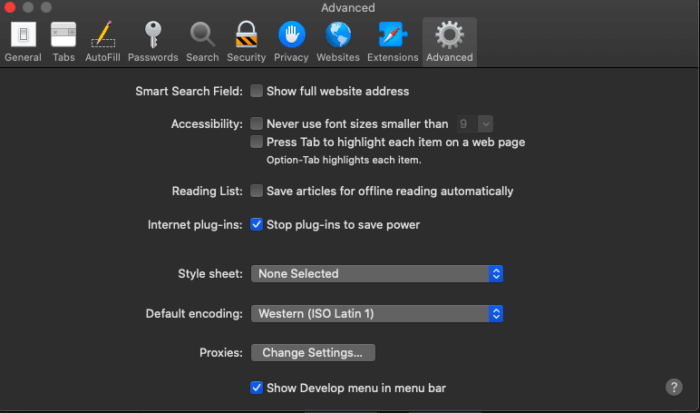
Here is how it looks.
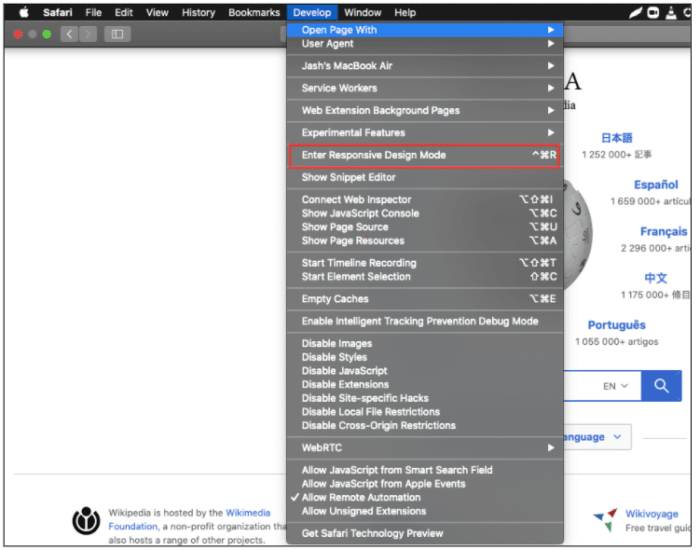
Below are the steps for viewing a website’s mobile version with the help of Safari Developers tools;
- Launch Safari and visit the URL of your choice.
- Go to Develop > Enter Responsive Design Mode from the menu bar.
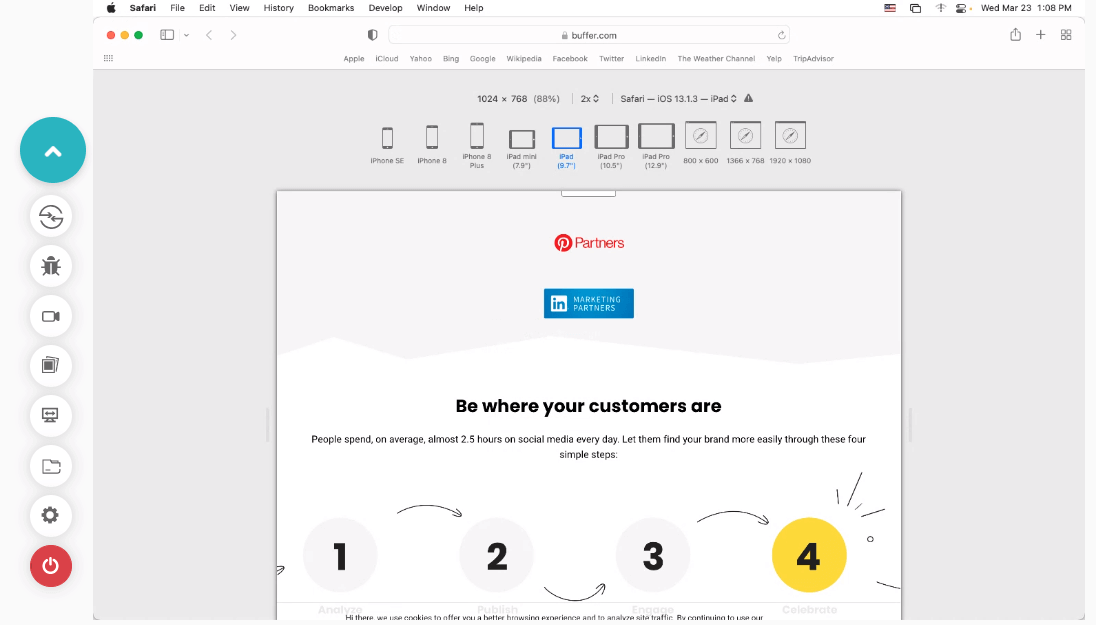
- After that, you can view the desired website by selecting the Apple mobile device.
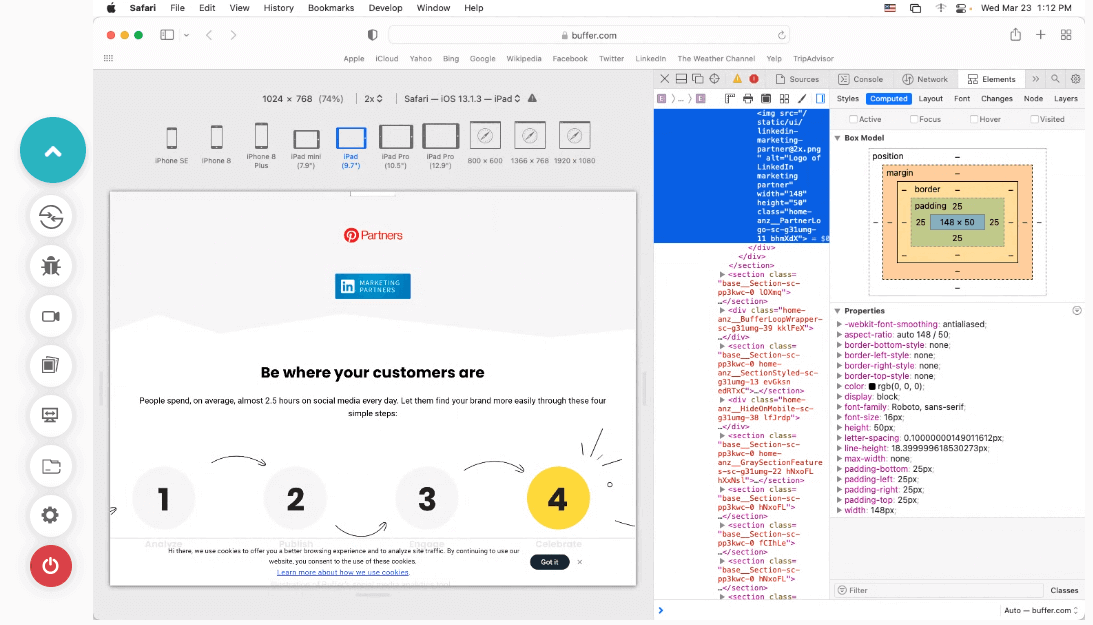
5. If you wish to debug a particular issue for a specific viewport or screen size or inspect a particular element, Web Inspector is the key to doing it. Developers can find it in the development view and use the element selector to inspect specific elements after activating the inspector.
Debugging Websites on Safari Using Web Inspector
As mentioned in the above method, here is how you can easily debug websites on iPhones and iPads on Safari using Web Inspector.
Let’s take a look.
- Connect your iPad or iPhone to the machine.
- Navigate to Settings > Safari > Advanced and enable the Web Inspector toggle button.

You can now preview the desired web page on your Safari browser on mobile or start debugging using Safari Developer tools.
Remote Debugging for iOS Safari on OS X
Remote debugging iOS Safari on OS X can be a challenging task. But it’s simpler than you might think. First, install the Safari browser version on your computer.
- Connect an iPhone or iPad to a Mac computer with the help of a USB.
- Enable Web Inspector on your device by selecting Settings > Safari > Advanced and switching on the Web Inspector toggle. This will switch it on in case that wasn’t in the default mode.
- After successfully enabling Web Inspector, do the same with the develop menu by selecting Safari > Preferences > Advanced and checking the box in the menu bar. Don’t do anything if it’s enabled already by default.
- Ensure that your devices are plugged in on your computer before opening your desired web page. Select Develop > iOS device name and select the page you wish to debug.
- Now, you can view and update the DOM (Document Object Model) and have access to the JavaScript console and some other features and options.
Summing Up!
You won’t automatically gain a billion users by designing a feature-filled website. Even if you manage to acquire people to browse your website with compromised features, they will encounter bugs and leave your platform forever. Remember that retention is vital to ensure consistent conversions and high ROI besides gaining users. Every bug in your interface takes your customers closer to your competitors.
The methods mentioned above are helpful for QA teams to debug websites using Safari Developer tools. Interface bugs can lie on the spectrum of simply being annoying and causing major user experience disruptions. Debugging on Safari browsers is necessary to launch web applications that work well under all conditions.
Some developers and testers might find website debugging for Safari a bit challenging. But it’s important to remember how crucial it is to offer a satisfying and seamless user experience for better customer acquisition and retention.
Do you have any questions about debugging a website using Safari Developer tools? Let us know in the comments below.
Published at DZone with permission of Veethee Dixit. See the original article here.
Opinions expressed by DZone contributors are their own.
Comments