How to Install the ELK Stack on Azure
Want to switch to the ELK Stack for your logging? Even better, want to get it running on your Azure cloud? This guide will walk you through setting up each component.
Join the DZone community and get the full member experience.
Join For FreeWhile there are many players in the cloud market, there are few that can attain the heights of Microsoft Azure. With 34 deployment regions worldwide and the power of Microsoft and its armies of developers, it’s easy to see why RightScale’s 2017 State of the Cloud Report found the percentage of respondents running applications on Azure has risen from 20% to 34% in the past year.
And when it comes to the cloud, there’s no better place for setting up the ELK Stack. To gain the full benefit of ELK, it’s important to find a cloud provider with enough power and flexibility such as Azure, Amazon Web Services, or the Google Cloud Platform to take advantage of all the features ELK has to offer.
The ELK Stack, made up of Elasticsearch, Logstash, and Kibana, is the world’s most popular open source log management platform. Leveraging the cloud gives users of the ELK Stack better computing, more scalability, and the flexibility to work with logs in the same way that they work with deploying their main applications.
For the purposes of this post — showing how to install the ELK Stack on Microsoft Azure — we will be deploying the latest available ELK Stack — version 5.4. For information on this version’s new features, please refer to the documentation.
Initial Setup on Azure
Once you have set up an account and logged in, it’s easy to see the convenient UI of the Azure dashboard. With the straightforward ways to create resources and virtual machines, it’s easy to get started on our deployment.
While the dashboard is pretty convenient, we’ll be doing the set up via the Azure CLI. To install the CLI, follow the instructions in the Azure documentation. Once it is installed, log in using the az login command. You will be prompted to open a browser and enter a code to verify your account.
Leaving the CLI for a moment, we need to create what Azure calls a “resource.” We log into the Azure portal and in the Dashboard menu on the left, click on Resource Group.
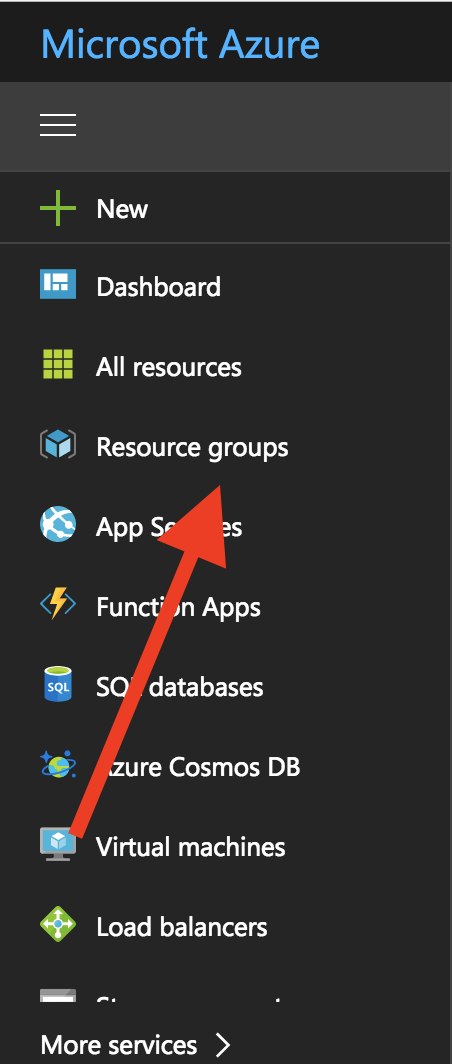
In our Resource group, we click the “Add” button, then choose a name and a region, and then click “Create” and our resource is ready to be used. For our purposes, the Resource group is named “ELK_Stack.”
With our resource setup, we begin by creating a virtual machine on which to deploy the ELK Stack. To do this, run the following command (note that the VM name can contain the characters 0-9, A-Z, or a-z — no spaces or special characters are allowed):
$ az vm create --resource-group ELK_Stack --name ELKVM --image UbuntuLTS --generate-ssh-keysThe output in your terminal should look similar to this:
{
    "fqdns": "",
    "id": "/subscriptions/958f7a93-4dX6-47ed-92Xf-5cf25f0e16X4/resourceGroups/ELK_Stack/providers/Microsoft.Compute/virtualMachines/ELKVM",
    "location": "centralus",
    "macAddress": "00-0D-XX-90-E0-XX",
    "powerState": "VM running",
    "privateIpAddress": "10.0.0.X",
    "publicIpAddress": "52.176.60.10",
    "resourceGroup": "ELK_Stack"
}
Configuration
Once the VM is created, we need to open port 80 to traffic. A simple command in Terminal will allow this:
$ az vm open-port --port 80 --resource-group ELK_Stack --name ELKVMIn addition, we will need to create a couple of firewall rules to allow Elasticsearch and Kibana to communicate. We will set these up via the Azure dashboard.
While logged in, click on “All resources”:
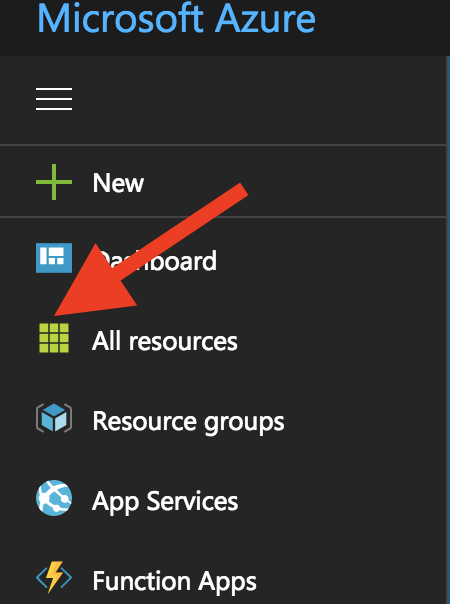
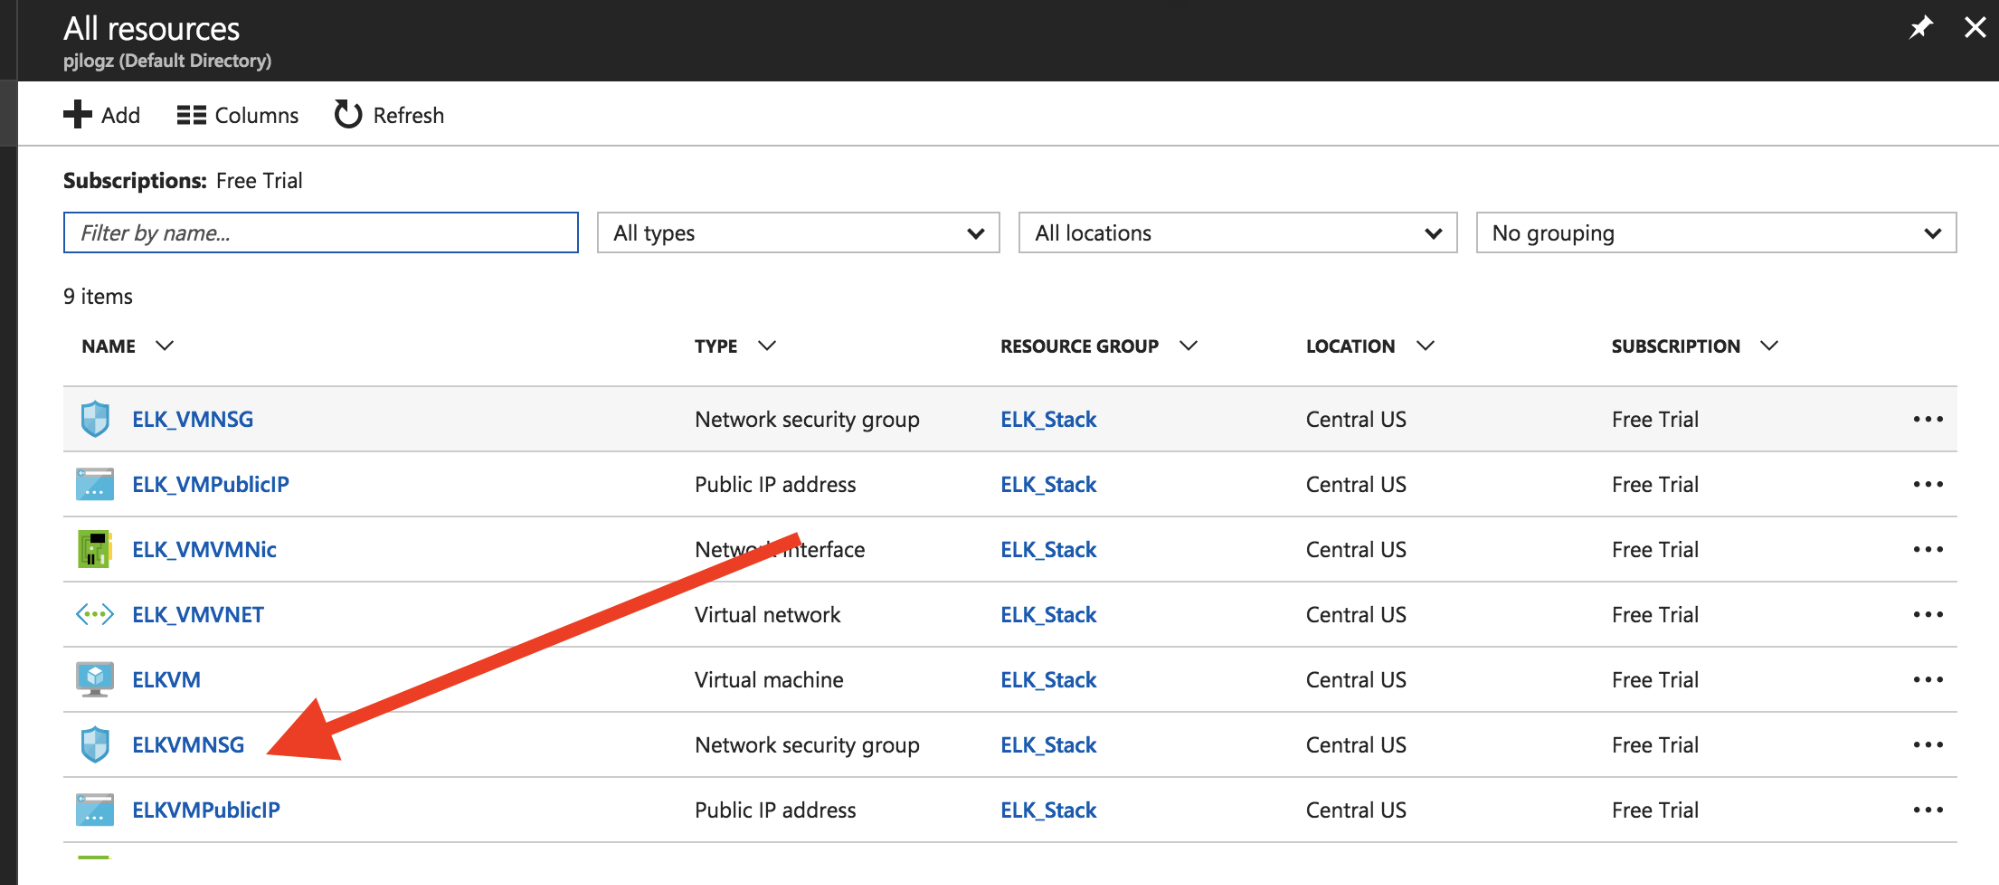
From this screen, we can see our resources as set up by Azure when we created the VM in the CLI. We want to click on ELKVMNSG (the “NSG” refers to the name of our VM, Network Security Groups):
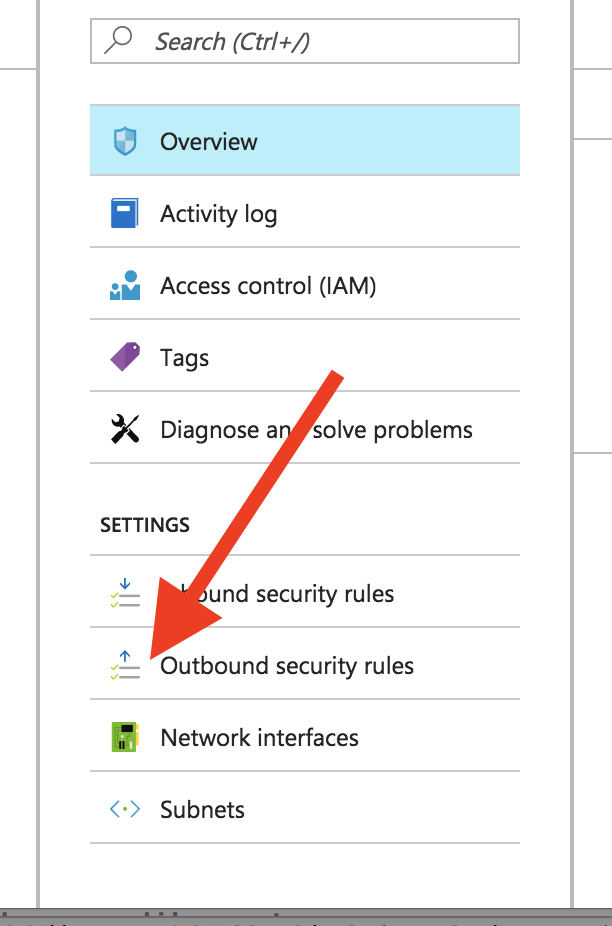
Next, we will need to focus on creating the rules we need. Since the ELK Stack focuses on outbound communication, click on “Outbound security rules”:
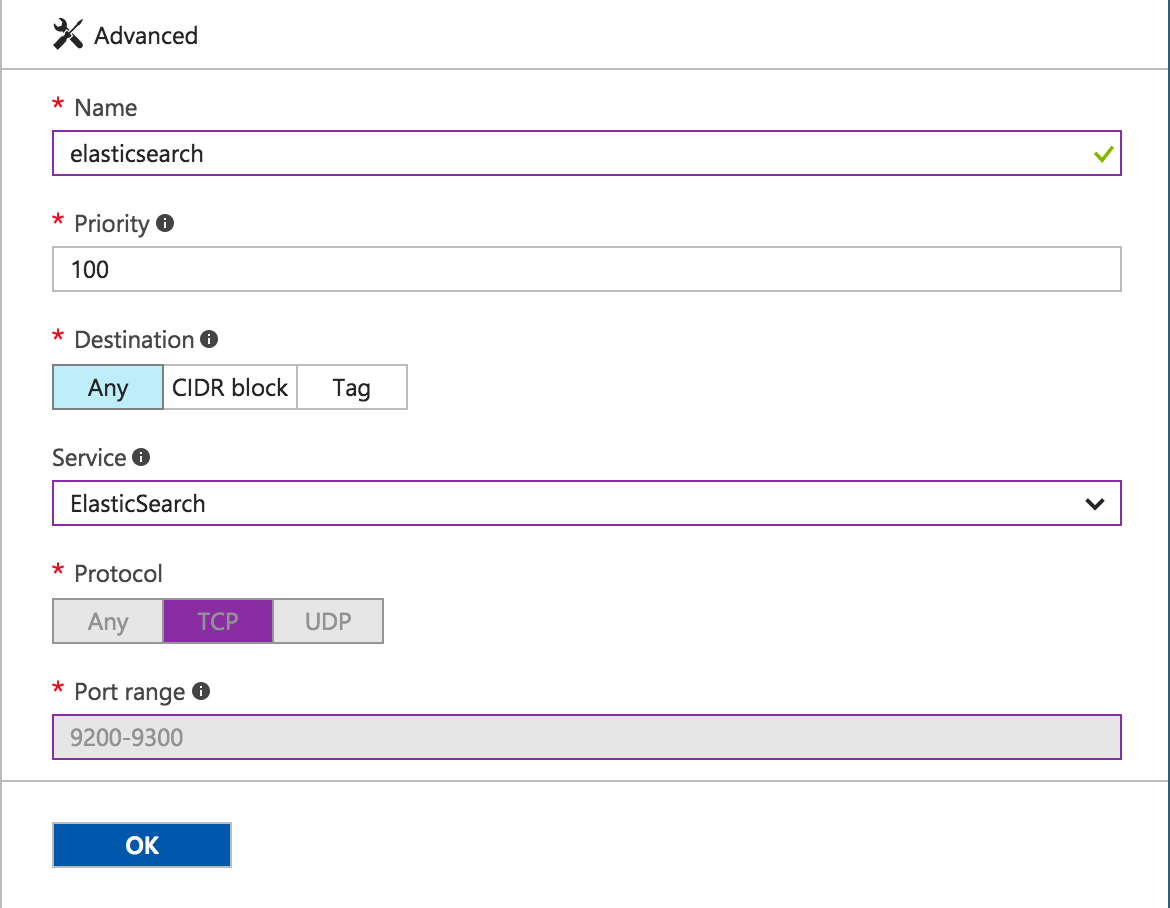
Click “Add +” at the top of the screen to add a new rule. For Elasticsearch, we will need Port 9200 available via TCP. Luckily, Azure is aware of Elasticsearch, so we simply need to name our rule then select “Elasticsearch” from the Services dropdown list.
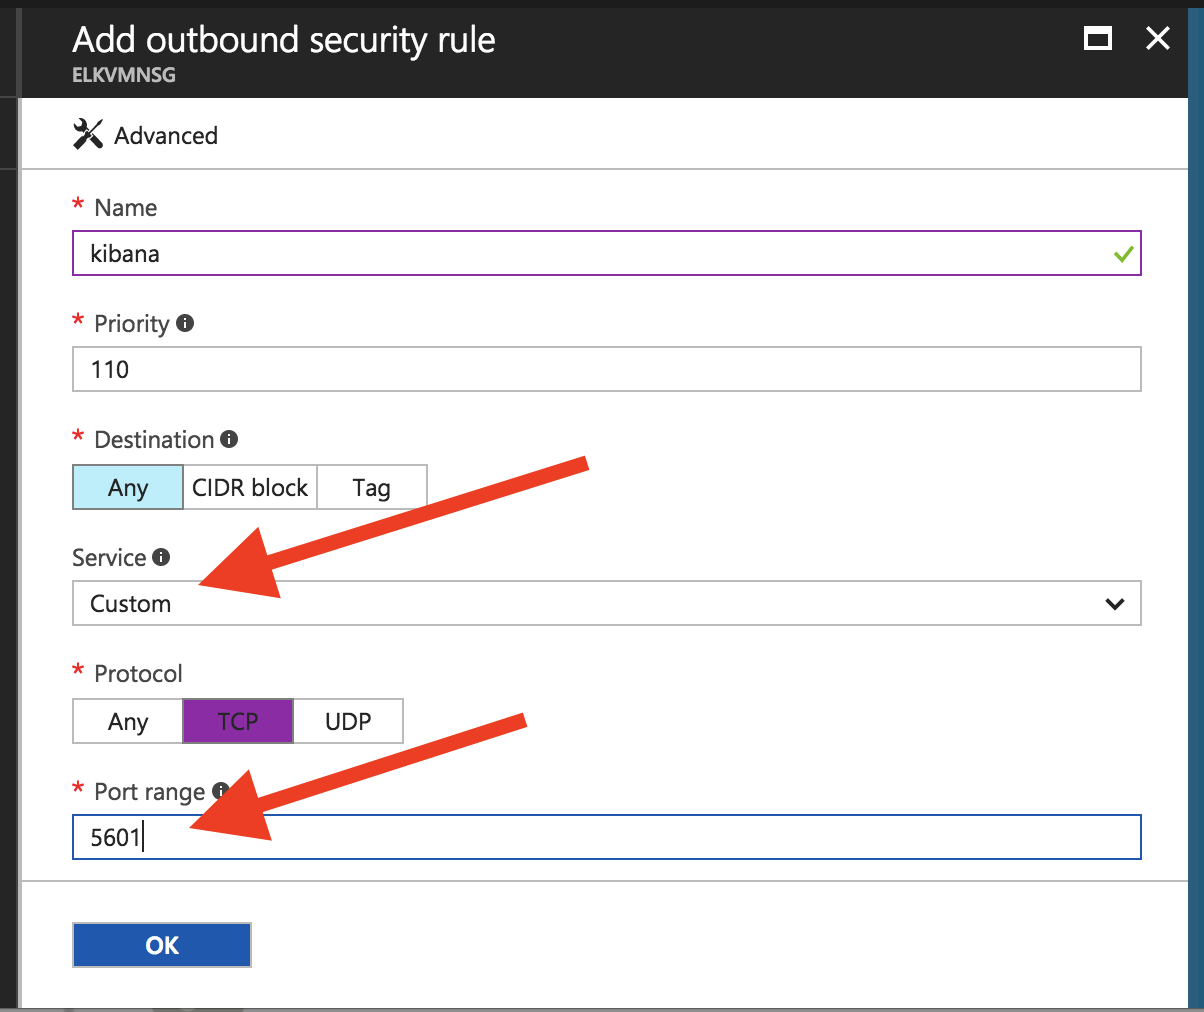
Unfortunately, there is no preset Service rule for Kibana. Therefore, we need to create a custom rule. Therefore, once we name our rule, we leave “Service” set as “Custom,” set “Protocol” to “TCP,” and type “5601” into “Port range.” It should look like this:
Once the ports have been configured and our rules are in place, we will be able to start the ELK Stack installation. To do this, we first SSH into the virtual machine using the public IP address provided when we set it up:
$ ssh 52.176.60.10Installing Java
Since the ELK Stack runs on the Java ecosystem, our first step will be to ensure that Java is installed. To do this, run the Java installation command.
$ sudo apt-get install default-jreInstalling Elasticsearch
As with all ELK Stack installations, the next step is to install our “E” — Elasticsearch. While SSH’ed into your virtual machine, run the following command (note that for this post, we are installing Elasticsearch version 5.4):
$ wget -qO - https://packages.elastic.co/GPG-KEY-Elasticsearch | sudo apt-key add -This command fetches the most recent, stable version of Elasticsearch — it but does not install it. For that, we need a separate command:
$ sudo apt-get install ElasticsearchNow, we need to configure Elasticsearch so that once we have the other portions of the ELK Stack installed, we can communicate with them properly. We will make these changes in this Elasticsearch.yml file:
$ sudo vi /etc/Elasticsearch/Elasticsearch.ymlFind the line referring to the network.host portion. It will be commented out. Uncomment the file and make it read network.host “0.0.0.0”. Be sure to save the file before exiting. Restart Elasticsearch to make sure that everything is up to date:
$ sudo service Elasticsearch restartInstalling Logstash
Logstash is our data collection pipeline and is basically the tunnel between Elasticsearch and Kibana. Similar to Elasticsearch, there are a couple of steps to install Logstash on a Azure virtual machine.
$ sudo apt-get install apt-transport-https

# This setups installs for logstash in your system

$ echo "deb https://artifacts.elastic.co/packages/5.x/apt stable main" | sudo tee -a /etc/apt/sources.list.d/elastic-5.x.list

# This will establish the source for Logstash

$ sudo apt-get update

$ sudo apt-get install logstash

# Setting up for Logstash installation

$ sudo service logstash start

# Start the logstash service so we can start shipping logs
Installing Kibana
The final part of the ELK Stack is Kibana, the part that gives us the great visualizations we are looking for. To install it, run the following commands.
$ echo "deb http://packages.elastic.co/kibana/5.3/debian stable main" | sudo tee -a /etc/apt/sources.list.d/kibana-5.3.x.list
# This will establish the source for Kibana

$ sudo apt-get update
$ sudo apt-get install kibana
# Setting up for Kibana installation
Similar to Elasticsearch, Kibana will need some configuration adjustments to work. Take a look at kibana.yml to make these changes:
$ sudo vi /etc/kibana/kibana.ymlFind the lines referring to server.port and ensure they say server.port: 5601 and server.host: “0.0.0.0”. It should only be necessary to uncomment these lines. It may also be necessary to adjust the SSL verify line elasticsearch.ssl.verificationMode: none if you are seeing problems once everything is up and running. Once this is done, you can start the Kibana service:
$ sudo service kibana startGetting the Logs Flowing
If everything has been installed properly and without incident, you should be able to enter your public IP address with Port 5601 on the end and see that Kibana is up and running.
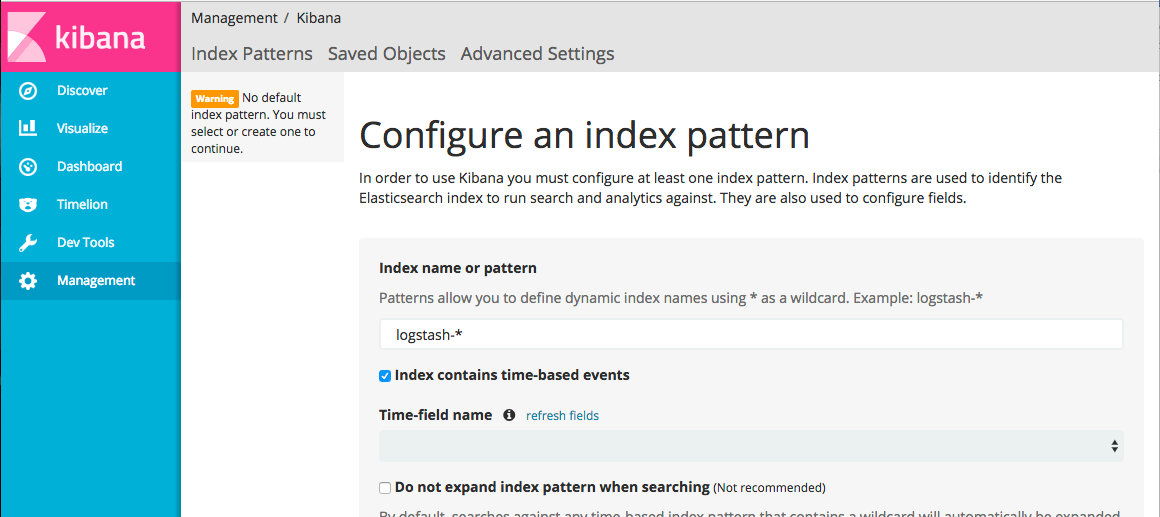
Kibana first asks us to define an index pattern. Since we have no pipeline in place, there is no existing index in our vanilla Elasticsearch installation.
To get things rolling, we are going to install MetricBeat to snag system metrics. The installation steps are as follows:
$ sudo apt-get install metricbeat
# Similar installation to the other features of the ELK stack

$ sudo service metricbeat start
Once MetricBeat is up and running, set it as an index pattern in the Kibana management screen as metricbeat-*. This will begin the shipping of logs, and ELK Stack will start to show results:

There are other beats that can deliver other logs, and you can stack various beats. But just for our purposes here, we have showed you how to successfully run logs on the Microsoft Azure with the ELK Stack.
Published at DZone with permission of PJ Hagerty, DZone MVB. See the original article here.
Opinions expressed by DZone contributors are their own.

Comments