How to Make a Chart in JavaScript With Chart.js
This article is a detailed tutorial on making a chart in JavaScript with chart.js.
Join the DZone community and get the full member experience.
Join For FreeThere are many JavaScript libraries for drawing different charts, from line charts, bars, graphs, and much more.
If you're trying to learn how to show data dynamically on your website using JavaScript, Chart.js is one of the libraries you can test.
React is one of the best JavaScript frameworks and also offers a cool set of React chart libraries by which you can create a cool interface of the web and hybrid applications.
What are the steps to begin developing data visualizations using Chart.js?
Find out how to do it in this article.
What Is Chart.js?
Chart.js is an open-source visualization of data JavaScript library that can plot HTML-based charts.
It is currently able to support eight kinds of interactive charts that can be animated. To create a graph based on HTML using chart.js, you will require an HTML canvas in order to display it.
The library can be used with a range of data sets and additional customization parameters like the border color, background color, and much more.
A dataset that is one of them is called that of the label, which is the values of the X-axis. The other is a collection of numbers, which usually fall along the Y-axis.
It is also necessary to define the graph type inside the chart object to ensure that the library can determine what graph to draw.
Create Charts in JavaScript With Chart.js
As we've previously mentioned that you can make a variety of kinds of charts using chart.js.
In this tutorial, we'll begin with bar and line graphs. Once you understand the concepts of these graph chart types, you'll have the information and tools you require to draw the other charts available.
To begin by using chart.js, create the required files. In this guide, the names of the files will be chart.html, plot.js, and index.css. You are able to use any naming convention to name your files.
Then, copy and paste the following code into your heading area of the HTML document. This will create provide a link to the Chart.js Content Delivery Network (CDN).
On chart.html:
<head>
 <script
src="https://cdnjs.cloudflare.com/ajax/libs/Chart.js/2.8.0/Chart.min.js">
 </script>
 </head>
Create the HTML canvas to display your chart. Give your chart its Id. Additionally, connect with the CSS (index.css) document located in the head section and link to the JavaScript (plot.js) files within the body section.
The format of the HTML file is as follows:
<!DOCTYPE HTML>
<html>
 <head>
 <title>
 Chart
 </title>
 <link rel="stylesheet" href="index.css">
 <script src="https://cdnjs.cloudflare.com/ajax/libs/Chart.js/2.8.0/Chart.min.js"></script>
 </head>
 <body>
 <header>
 <h1>
 Charts
 </h1>
 </header>
 <canvas id="plots" style="width:100%;max-width:700px"></canvas>
<script src="plot.js">
</script>
</body>
</htm/>
In Your CSS:
body{
 background-color:#383735;
}
h1{
 color:#e9f0e9;
 margin-left:43%;
}
#plots{
 margin:auto;
 background-color: #2e2d2d;
}
The CSS styling shown above isn't standard. You can style it according to your preference, based on the structure of your DOM. When you have your HTML or CSS files finished, and you're ready to create your charts using JavaScript.
The Line Chart
For a line chart to be created using chart.js, you'll change your chart type to the line. This tells the library how to draw the line chart.
To show this, within the JavaScript file:
// Get the HTML canvas by its id
plots = document.getElementById("plots");
<strong>// Example datasets for X and Y-axesstrong>
var months = ["Jan", "Feb", "Mar", "Apr", "May", "Jun", "Jul"]; <strong>//Stays on the X-axisstrong>
var traffic = [65, 59, 80, 81, 56, 55, 60] //Stays on the Y-axis
// Create an instance of Chart object:
new Chart(plots, {
 type: 'line', <strong>//Declare the chart typestrong>
 data: {
 labels: months, <strong>//X-axis datastrong>
 datasets: [{
 data: traffic, <strong>//Y-axis datastrong>
 backgroundColor: '#5e440f',
 borderColor: 'white',
 fill: false, //Fills the curve under the line with the background color. It's true by default
 }]
 },
});
Output:
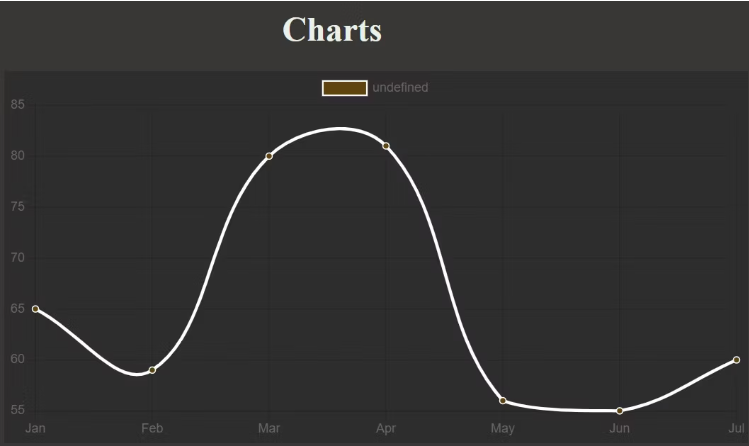
Feel free to alter your fill values to be true, use additional data, or modify the color to observe what happens.
As you can see, there's an extra legend box near the very top. You can take it out of an option parameter.
Its option parameter can also be used to make other adjustments other than removing or adding the legend. For instance, you can apply it to make an axis begin at zero.
To define the options parameter. This is what the chart section will look like within the JavaScript file:
// Create an instance of Chart object:
new Chart(plots, {
 type: 'line', <strong>//Declare the chart typestrong>
 data: {
 labels: months, <strong>//X-axis datastrong>
 datasets: [{
 data: traffic, <strong>//Y-axis datastrong>
 backgroundColor: '#5e440f', <strong>//Color of the dotsstrong>
 borderColor: 'white', <strong>//Line colorstrong>
 fill: false, //Fills the curve under the line with the background color. It's true by default
 }]
 },
<strong> //Specify custom options:strong>
 options:{
 legend: {display: false}, //Remove the legend box by setting it to false. It's true by default.
 //Specify settings for the scales. To make the Y-axis start from zero, for instance:
 scales:{
 yAxes: [{ticks: {min: 0}}] //You can repeat the same for X-axis if it contains integers.
 }
 }
});
Output:
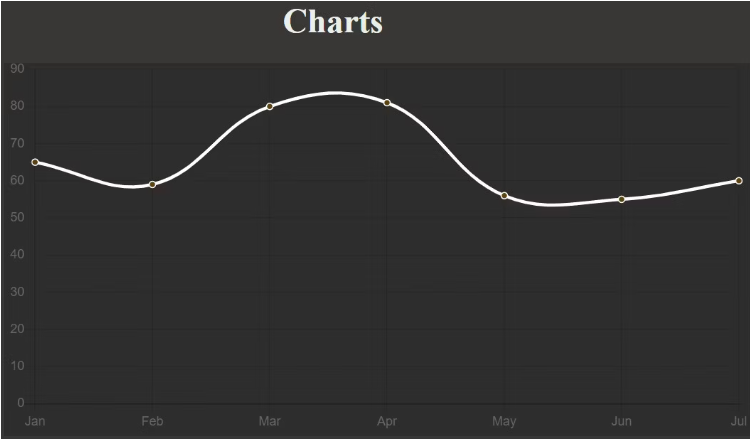
You may also choose different colors for the background of every dot. Variation in background colors this way is typically better for bar graphs, however.
Create A Bar Graph Using ChartJS
This is the only time you have to make the change from the type of chart to bars. It is not necessary to change an option for the color option as the bars will inherit their background colors automatically:
// Create an instance of Chart object:
new Chart(plots, {
 type: 'bar', <strong>//Declare the chart typestrong>
 data: {
 labels: months, <strong>//X-axis datastrong>
 datasets: [{
 data: traffic, <strong>//Y-axis datastrong>
 backgroundColor: '#3bf70c', <strong>//Color of the barsstrong>
 }]
 },
 options:{
 legend: {display: false}, //Remove the legend box by setting it to false. It's true by default.
 }
});
Output:
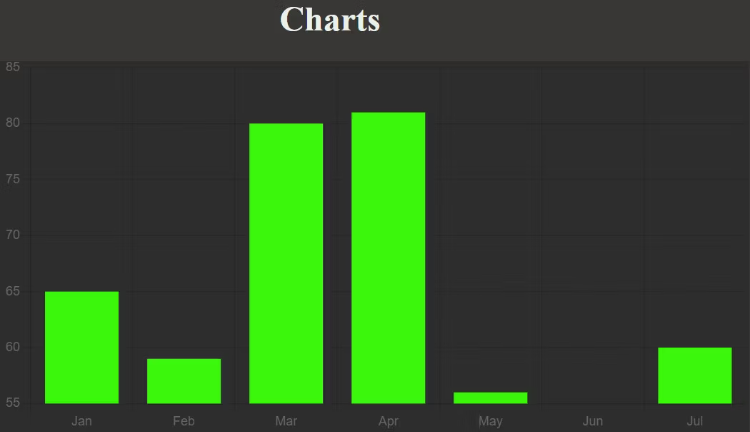
Feel free to set the Y-axis to begin from zero or any other value, as you did with your line graph.
For different colors to be used for each of your bars, you must pass an array of colors that are compatible with the amount of items you have in your data to the backgroundColor parameter:
// Create an instance of Chart object:
new Chart(plots, {
 type: 'bar', <strong>//Declare the chart typestrong>
 data: {
 labels: months, <strong>//X-axis datastrong>
 datasets: [{
 data: traffic, <strong>//Y-axis datastrong>
 <strong>//Color of each barstrong>:
 backgroundColor: [
 "rgba(196, 190, 183)",
 "rgba(21, 227, 235)",
 "rgba(7, 150, 245)",
 "rgba(240, 5, 252)",
 "rgba(252, 5, 79)",
 "rgb(0,12,255)",
 "rgb(17, 252, 5)"],
 }]
 },
 options:{
 legend: {display: false}, //Remove the legend box by setting it to false. It's true by default.
 }
});
Output:
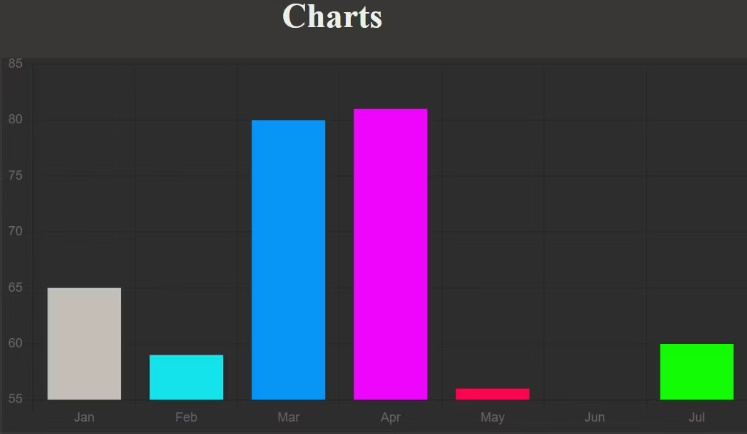
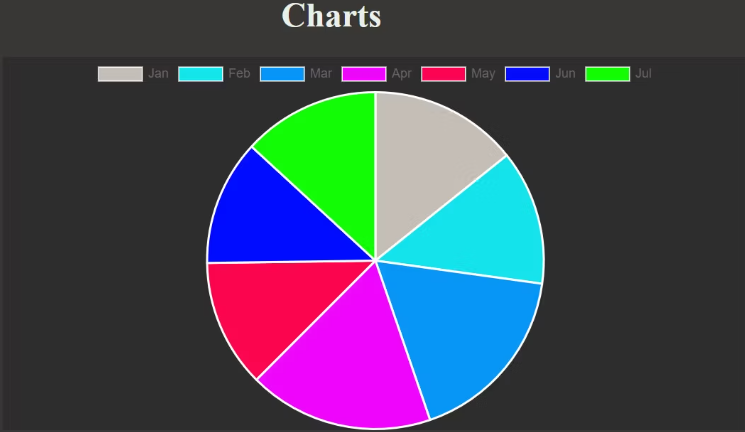
Create A Pie Chart Using Chart.js
To create a pie chart, switch the type of chart to pie. It is also possible to make the legend's display true to determine what each part of the pie is:
// Create an instance of Chart object:
new Chart(plots, {
 type: 'pie', //Declare the chart type
 data: {
 labels: months, //Defines each segment
 datasets: [{
 data: traffic, //Determines segment size
 //Color of each segment
 backgroundColor: [
 "rgba(196, 190, 183)",
 "rgba(21, 227, 235)",
 "rgba(7, 150, 245)",
 "rgba(240, 5, 252)",
 "rgba(252, 5, 79)",
 "rgb(0,12,255)",
 "rgb(17, 252, 5)"],
 }]
 },
 options:{
 legend: {display: true}, //This is true by default.

 }

});
Output:
Like you did in the previous examples, Try different charts by altering the kind of chart.
However, there are a few chart.js chart types that are supported. chart.js chart types that you can use the code conventions above:
- Bar
- radar
- Line
- doughnut
- Pie
- bubble
- scatter
- polarArea
Moving Forward
Even though you've only laid familiar with pie, line, and bar graphs with this tutorial, the code pattern to plot other charts using chart.js is based on the same principle. You are free to experiment with other charts, too.
Opinions expressed by DZone contributors are their own.
Comments