How To Use SingleStore Pipelines With Kafka, Part 1 of 3
This series of articles looks at a compelling feature of SingleStore called Pipelines. Here in Part 1, learn how to load some sensor data into SingleStore.
Join the DZone community and get the full member experience.
Join For FreeAbstract
In this article series, we'll look at a compelling feature of SingleStore called Pipelines. This enables vast quantities of data to be ingested, in parallel, into a SingleStore database. We'll also see an example of how we can use this feature in conjunction with Apache Kafka™. This first article will focus on uploading some data into SingleStore using Spark. In a previous article, we noted that Spark was great for ETL with SingleStore. We'll also perform some analysis of the data. In the example application, we will simulate some sensors distributed globally that generate temperature readings, and these readings will be ingested into SingleStore through the Confluent Cloud. We'll implement a Producer-Consumer model using Java and JDBC, and then simplify this using SingleStore Pipelines.
The SQL scripts, Java code, and notebook files used in this article series are available on GitHub. The notebook files are available in DBC, HTML, and iPython formats.
Introduction
A common use case today is the need to manage streaming data. The data may originate from many different sources, such as sensors, wearable devices, and more. Let's implement a system to ingest data into a SingleStore database for further analysis. We'll develop mainly in the Cloud using the SingleStore Managed Service, Databricks Community Edition (CE), and Confluent Cloud for ease of use.
To begin with, we need to create a free Managed Service account on the SingleStore website, a free Community Edition (CE) account on the Databricks website, and an account on the Confluent Cloud website. At the time of writing:
- The Managed Service account from SingleStore comes with $500 of Credits. This is more than adequate for the case study described in this article.
- Databricks offers a free CE account. We'll use this rather than the trial version.
- Confluent is offering new signups up to $200 off each of their first three Confluent Cloud monthly bills. This is more than adequate to meet our needs.
This is a three-part article series, and it is structured as follows:
- Load the Sensor data into SingleStore.
- Demonstrate Producer-Consumer using Java and JDBC.
- Demonstrate SingleStore Pipelines.
This first article covers Part 1, Load the Sensor data into SingleStore.
Create the Database Tables
In our SingleStore Managed Service account, let's use the SQL Editor to create a new database. Call this sensor_readings, as follows:
CREATE DATABASE IF NOT EXISTS sensor_readings;We'll also create some tables, as follows:
USE sensor_readings;

CREATE ROWSTORE TABLE IF NOT EXISTS sensors (
     id INT PRIMARY KEY,
     name VARCHAR (50),
     latitude DOUBLE,
     longitude DOUBLE,
     location AS GEOGRAPHY_POINT(longitude, latitude) PERSISTED GEOGRAPHYPOINT,
     INDEX(location)
);

CREATE TABLE IF NOT EXISTS temperatures (
     sensorid INT,
     temp DOUBLE,
     ts TIMESTAMP,
     PRIMARY KEY(sensorid, ts)
);

CREATE ROWSTORE TABLE IF NOT EXISTS continents (
     name TEXT,
     geo GEOGRAPHY
);

INSERT INTO continents VALUES
('ANTARCTICA', 'POLYGON((-162.19902 -77.84078, -43.569701 -65.849245, 64.55879 -60.87363, 167.91816 -72.07235, -162.19902 -77.84078))'),
('AUSTRALIA', 'POLYGON((113.89146 -21.35488, 134.45787 -12.02214, 154.05748 -26.17911, 145.70787 -38.8089, 130.85435 -32.68008, 115.91295 -34.87152, 113.89146 -21.35488))'),
('ASIA', 'POLYGON((104.92202 77.74504, -170.3514 65.90311, 138.32046 55.6176, 121.97281 29.28951, 105.37845 8.02803, 62.13626 25.29568, 44.55814 12.5238, 30.602502 33.204218, 71.10111 55.26116, 79.08218 72.83659, 104.92202 77.74504))'),
('OCEANIA','POLYGON((129.471587 0.940675, 138.556212 19.004802, -153.863039 24.730010, -104.547565 -27.214452, 166.871208 -47.995426, 151.949829 -13.084397, 142.210665 -9.851017, 131.411593 -2.258725, 129.471587 0.940675))'),
('EUROPE', 'POLYGON((25.77289 71.10053,  72.17914 68.36452, 62.51118 54.00413, 35.0893 46.25156, 23.48774 37.78319, -6.92241 37.0853, -16.82418 48.06068, -12.02006 57.74777, 25.77289 71.10053))'),
('AFRICA', 'POLYGON((-6.74729 36.25797, 33.15505 32.0411, 36.67418 17.57988, 53.01833 11.10883, 42.47145 -14.67344, 19.26833 -34.79985, 9.2488 2.56495, -16.76682 9.37911, -6.74729 36.25797))'),
('NORTH AMERICA', 'POLYGON((-159.78515 71.41317, -127.79296 70.95969, -102.83203 79.93591, -27.94921 83.6381, -18.10546 71.07405, -54.66796 50.73645, -75.03382 34.27744, -92.98828 26.43122, -97.91015 14.94478, -125.50511 36.24427, -133.76953 57.32652, -166.46484 58.99531, -159.78515 71.41317))'),
('SOUTH AMERICA','POLYGON((-77.18724 9.75868, -61.76243 11.35708, -47.69993 1.58823, -33.81321 -7.3561, -40.4862 -22.876, -47.34837 -28.76203, -65.98118 -55.97021, -77.93431 -50.621, -70.90306 -19.96732, -82.50462 -1.04821, -77.18724 9.75868))');
This first article will upload data for 1,000 sensors into the sensors table. A ROWSTORE would be a good choice in this case since the dataset is very small. The sensors are globally distributed, and our dataset contains four columns consisting of a unique identifier, a name, latitude, and longitude. As we upload the data into the sensors table, SingleStore will create a fifth column called location. This is a geospatial point consisting of latitude and longitude. We'll make use of this feature later in this article series.
We'll stream data into the temperatures table. This table consists of three columns: a unique identifier, a temperature reading, and a timestamp.
Finally, the continents table uses latitude and longitude coordinates to represent the approximate shapes of the major earth landmasses. This will allow us to query the system and ask how many sensors are in each continent. A ROWSTORE would be a good choice in this case since the dataset is very small.
Configure Databricks CE
A previous article provides detailed instructions on how to Configure Databricks CE for use with SingleStore. We can use those exact instructions for this use case.
Upload CSV File
A sensor.csv file is available on GitHub. To use the CSV file, we need to upload it into the Databricks CE environment. The aforementioned previous article provides detailed instructions on how to upload a CSV file. We can use those exact instructions for this use case.
Fill Out the Notebook
Let's now create a new notebook. We'll call it Data Loader for Sensors. We'll attach our new notebook to our Spark cluster.
In a new code cell, let's add the following code:
df = spark.read.csv("/FileStore/sensor.csv",
                    header = True,
                    inferSchema = True)
This reads the CSV file and creates a DataFrame called df. We also tell Spark that there is a header row and ask it to determine the data types for each column.
In the next code cell, we'll count the number of rows, as follows:
df.count()Executing this, we obtain the value of 1000.
In the next code cell, to show the DataFrame, we can use:
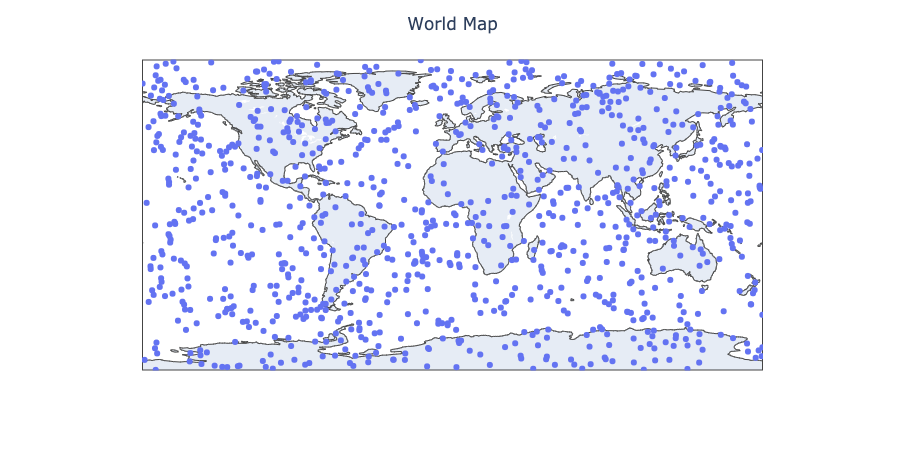
display(df)It would be nice to plot these sensors on a world map to see the global distribution. We can do this by first converting the Spark DataFrame to a Pandas DataFrame, as follows:
pandas_df = df.toPandas()Then, use Plotly to show the sensors, as follows:
import plotly.express as px

fig = px.scatter_geo(pandas_df,
                     lat = "latitude",
                     lon = "longitude",
                     hover_name = "id")

fig.update_layout(title = "World Map", title_x = 0.5)
fig.show()
The output should appear as shown in Figure 1.
We are now ready to write the DataFrame to SingleStore. In the next code cell, we can add the following:
%run ./SetupIn the Setup notebook, we need to ensure that the server address and password are added for our SingleStore Managed Service cluster.
In the next code cell, we'll set some parameters for the SingleStore Spark Connector, as follows:
spark.conf.set("spark.datasource.singlestore.ddlEndpoint", cluster)
spark.conf.set("spark.datasource.singlestore.user", "admin")
spark.conf.set("spark.datasource.singlestore.password", password)
spark.conf.set("spark.datasource.singlestore.disablePushdown", "false")
Finally, we are ready to write the DataFrame to SingleStore using the Spark Connector:
(df.write
   .format("singlestore")
   .option("loadDataCompression", "LZ4")
   .mode("ignore")
   .save("sensor_readings.sensors"))
This will write the DataFrame to the sensors table in the sensor_readings database. We can check that this table was successfully populated from SingleStore. After reviewing the table, we should see the extra column, called location, that SingleStore has populated for us.
Summary
In this first article in this Pipelines series, we have successfully loaded our sensor data into a Spark DataFrame, checked the number of rows, created a visualization of the data, and have written the Dataframe to SingleStore using the SingleStore Spark Connector.
Published at DZone with permission of Akmal Chaudhri. See the original article here.
Opinions expressed by DZone contributors are their own.
Comments