IBM AIX: Java process Size Monitoring
By
 ·
·
Interview
·
·
Interview
Likes
(0)
Likes
There are no likes...yet! 👀
Be the first to like this post!
It looks like you're not logged in.
Sign in to see who liked this post!
Comment
Save
14.5K Views
Join the DZone community and get the full member experience.
Join For FreeThis article will provide you with a quick reference guide on how to calculate the Java process size memory footprint for Java VM processes running on IBM AIX 5.3+ OS.
This is a
complementary post to my original article on this subject: how to monitor the Java native memory on AIX. I highly recommend this article to any individual
involved in production support or development of Java applications deployed on AIX.
Why is this knowledge important?
From my perspective, basic knowledge on how the OS is managing the
memory allocation of your JVM processes is very important. We often overlook
this monitoring aspect and only focus on the Java heap itself.
From my experience, most Java memory related problems are observed from
the Java heap itself such as garbage collection problems, leaks etc. However, I’m
confident that you will face situations in the future involving native memory
problems or OS memory challenges. Proper knowledge of your OS and virtual
memory management is crucial for proper root causes analysis, recommendations
and solutions.
AIX memory vs. pages
As you may
have seen from my earlier post, the AIX Virtual Memory Manager (VMM) is
responsible to manage memory requests from the system and its applications.
The actual
physical memory is converted and partitioned in units called pages;
allocated either in physical RAM or stored on disk until it is needed. Each
page can have a size of 4 KB (small page), 64 KB (medium page) or 16 MB (large
page). Typically for a 64-bit Java process you will see a mix of all of the
above.
What about the topas command?
The
typical reflex when supporting applications on AIX is to run the topas command, similar
to Solaris top. Find
below an example of output from AIX 5.3:

As you can see, the topas command is not very helpful to get a clear view on the memory utilization since it is not providing the breakdown view that we need for our analysis. It is still useful to get a rough idea of the paging space utilization which can give you a quick idea of your top "paging space" consumer processes. Same can be achieved via the ps aux command.
AIX OS command to the rescue:
svmon
The AIX svmon command
is by far my preferred command to deep dive into the Java process memory
utilization. This is a very powerful command, similar to Solaris pmap. It
allows you to monitor the current memory “pages” allocation along with each
segment e.g. Java Heap vs. native heap segments. Analyzing the svmon output
will allow you to calculate the memory footprint for each page type (4 KB, 64
KB, and 16 MB).
Now find
below a real example which will allow you to understand how the calculation is
done:
# 64-bit
JVM with -Xms2048m & -Xmx2048m (2 GB Java Heap)
# Command: svmon –P <Java PID>
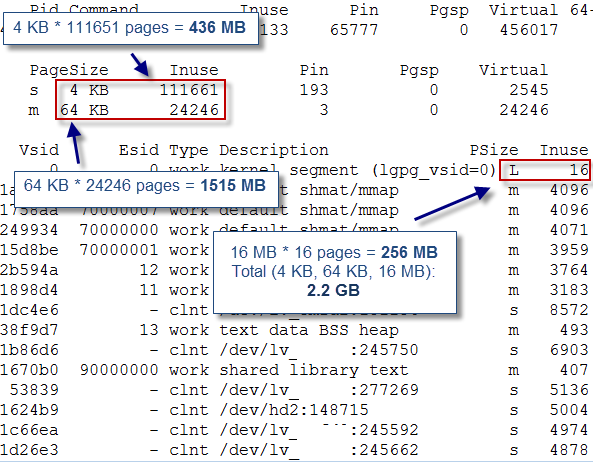
As you can see, the total footprint of our Java process size was found at 2.2 GB which is aligned with current Java heap settings. You should be able to easily perform the same memory footprint analysis from your AIX environment.
As you can see, the total footprint of our Java process size was found at 2.2 GB which is aligned with current Java heap settings. You should be able to easily perform the same memory footprint analysis from your AIX environment.
I hope
this article has helped you to understand how to calculate the Java process
size on AIX OS. Please feel free to post any comment or question.
AIX
Java (programming language)
Memory (storage engine)
IBM AIX (operating system)
Command (computing)
Published at DZone with permission of Pierre - Hugues Charbonneau. See the original article here.
Opinions expressed by DZone contributors are their own.
Comments