In Which Region Are Intern Strings Stored?
Learn more on which region Intern strings are stored in.
Join the DZone community and get the full member experience.
Join For Freeintern() is an interesting function in java.lang.String object. intern() function eliminates duplicate string objects from the application and has the potential to reduce the overall memory consumption of your application.
 To understand how the string
 intern() function works you may refer to this interesting blog. Intern strings are stored in a string pool in the JVM memory. JVM Memory has the following regions:
- Heap region (i.e. Young & Old generation)
- Metaspace
- Others region
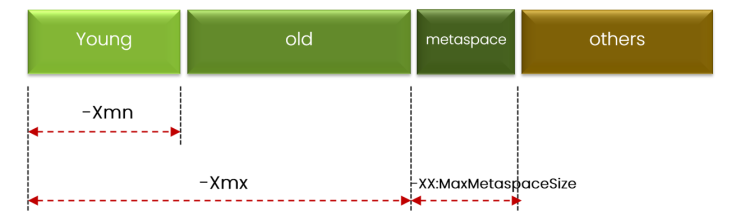
Fig: JVM memory regions
To learn more about what gets stored in each of the JVM memory regions, you may refer to this video clip. In this post let’s learn through practical examples, in which region is the intern string pool stored.
Intern Strings stored in JVM heap memory
In earlier java versions from 1 to 6, intern strings are stored in the Perm Generation region of the Memory. However, starting from Java 7 intern strings are stored in the Heap region (i.e. which is basically the young & old generation). To confirm this theory, we conducted a simple experiment.
String intern() sample program
To facilitate our study, we wrote this simple java program. The intent of this program is to create a very large intern string pool.
public class InternRegionDemo {

    private static List<String> datas = new ArrayList<>(10_000_000);

    public static void main(String args[]) throws Exception {

      BufferedReader reader = new BufferedReader(new FileReader("C:\\workspace\\fully-random-data.txt"));
      String data = reader.readLine();
      while (data != null) {

        data = reader.readLine().intern();
        datas.add(data);
     }
     reader.close();
   }
}
I request you to review the above source code, before reading further. It’s a simple program. If you notice ‘InternRegionDemo’ program reads each line at a time from the ‘fully-random-data.txt’ & then invokes intern() operation on the read data. ‘fully-random-data.txt’ basically contains 10 million unique UUID (Universally Unique Identifier) strings in this file. String returned by the intern() function is then added to the ‘datas’ ArrayList. Since intern() operation is invoked on the 10 million unique strings, the string intern pool will contain 10 million string objects.
Garbage Collection Study
We enabled Garbage collection on the above program and ran it. Because the Garbage collection log will give a clear indication of which region intern string objects are stored.
You may consider enabling Garbage collection logs on all your production instances by passing the JVM arguments mentioned here. Enabling garbage collection log doesn't add noticeable overhead to your application, thus it’s recommended to keep it ON all the production JVM instances, because of its great benefits.
Once program execution was completed, we uploaded the generated Garbage collection log file into the GCeasy tool, an online garbage collection log analysis tool. Here is the Garbage Collection log analysis report generated by this tool.
Here are the key observations from the report:
a. Below is the Heap usage graph from the report generated by GCeasy. You can notice that the heap region’s memory is continuously growing all the way till 950MB until the program terminates. Basically, the Heap usage graph in the report indicates the JVM’s heap region’s memory utilization.
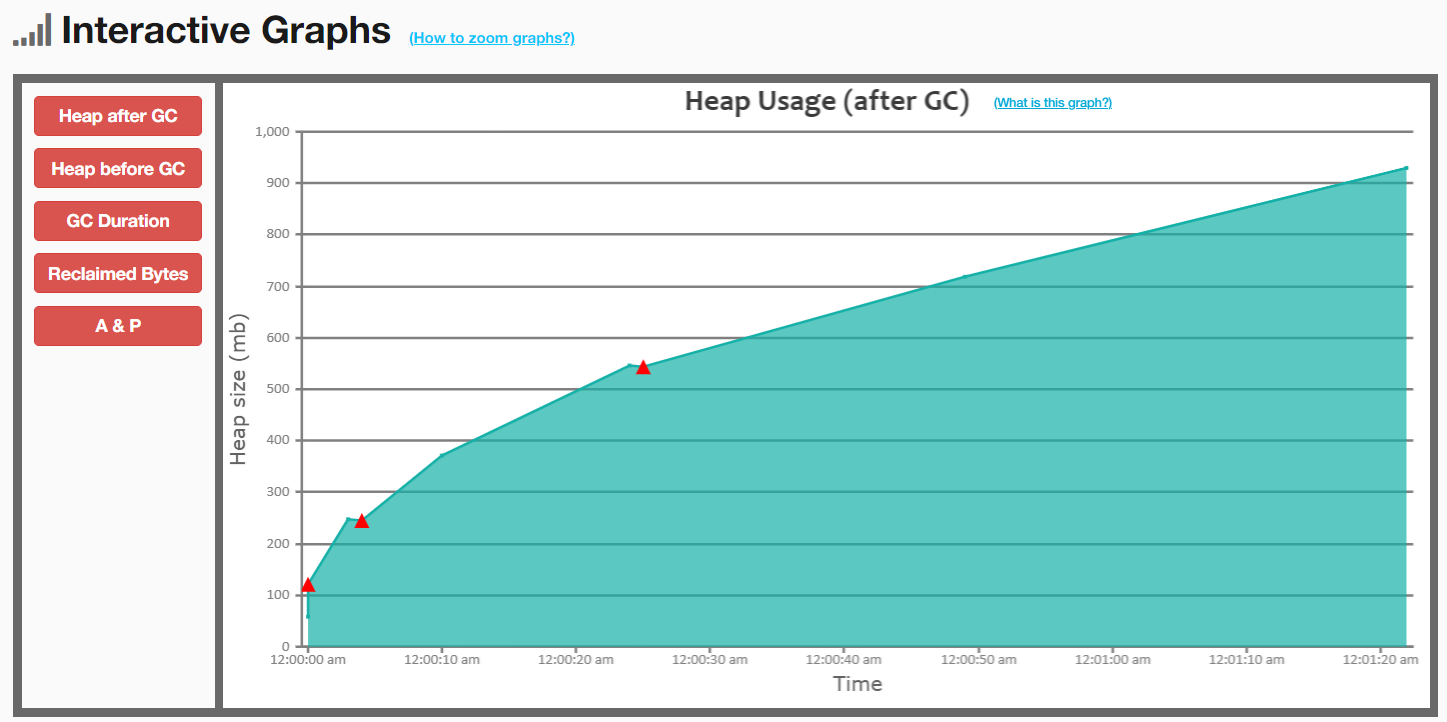
Fig: Heap region memory graph from above application generated by GCeasy
b. If you notice, there is no Metaspace usage graph in the report. It indicates there was no change in the Metaspace region. If there would have been changes in the Metaspace region, the Metaspace graph would be present in the report. Here is a GC log analysis report of an application, where there was heavy churn in the Metaspace region. When there is a churn in the Metaspace region, the tool will report the Metaspace graph.
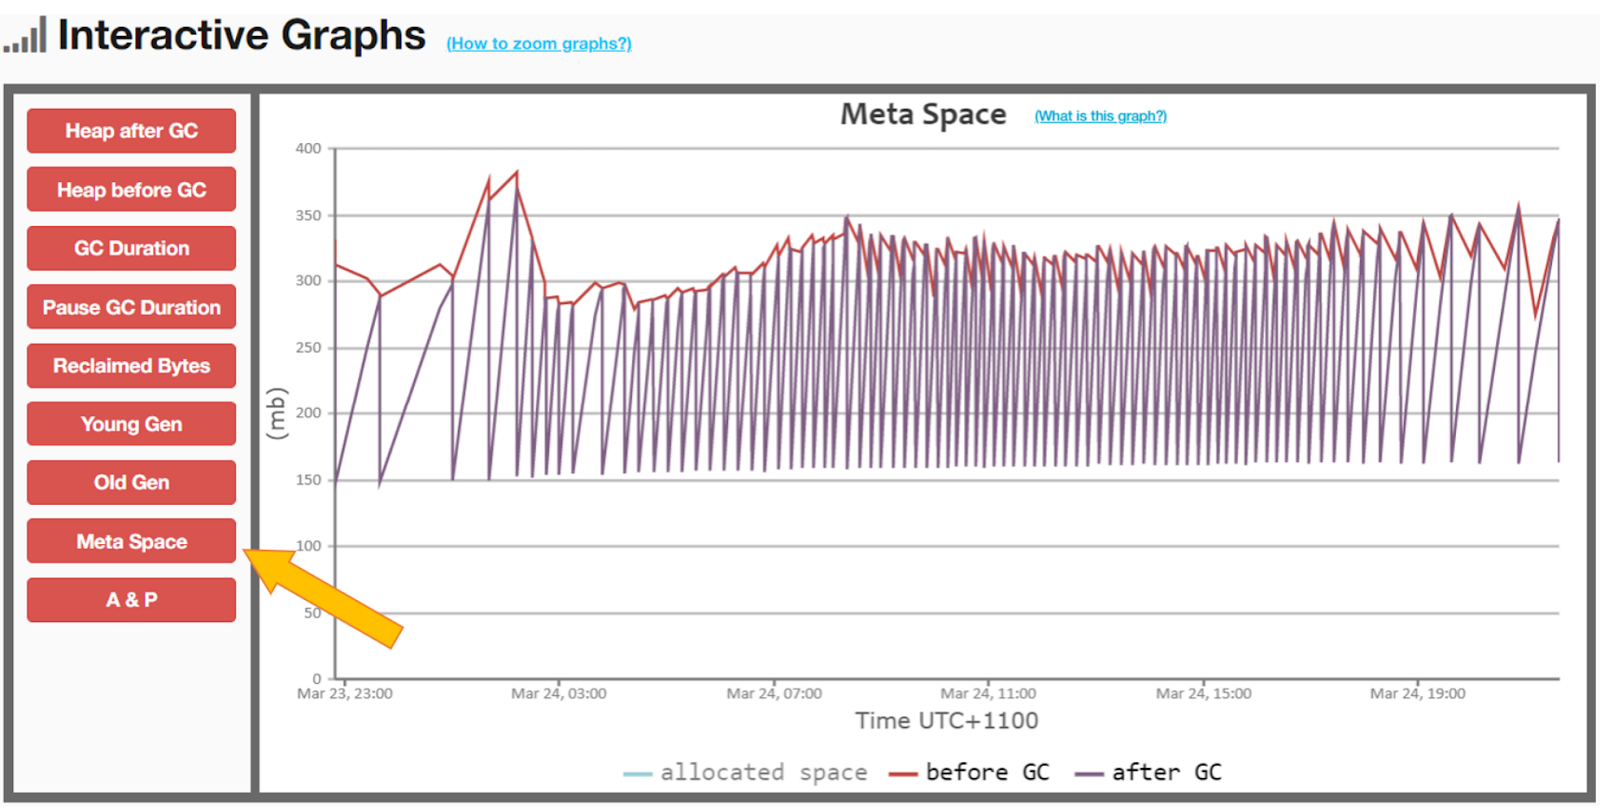
Fig: Metaspace region memory graph from a different application generated by GCeasy
c. ‘Others’ region in the JVM memory contains only threads, code cache, socket buffers, GC stats and JNI. They don’t store any of the objects created by the application.
Conclusion
Based on this simple study we can conclude that intern string pools are stored in the JVM’s heap region of the memory, and they are NOT stored in the ‘Metaspace’ or the ‘Others’ region.
Opinions expressed by DZone contributors are their own.
Comments