Integration of Highcharts With React (JavaScript Library )
Look at the integration of highcharts with react, which is a JavaScript Library.
Join the DZone community and get the full member experience.
Join For Freehighcharts is a front-end javascript library which is made to design the charts on web pages. reactjs is also a javascript library for ui design. now if we need to create a chart in reactjs, there is a good news that several libraries (like recharts, victory, vx, react-jsx-highcharts, react-vis etc.) are available, which can be used for this purpose. we can use any library but i will recommend you to use react-jsx-highcharts because it supports almost every type of chart like simple line charts, spline charts, bar charts, inverted charts, pie charts, and many more.
to use react-jsx-highcharts first we need to install this library in our node module by using 'npm install react-jsx-highcharts --save' command. we need to install highcharts library also for some internal dependencies by using ' npm install highcharts --save ' command.
configurations
all the configurations of a chart can be done in json format or by using components and attributes of react-jsx-highcharts.
in the following example, we are configuring the title.
by using component
<title>time</title>by using json
title : {
   text : 'time'
}
both are same. see the another one..
<splineseries
   name="london"
   data={[3.9, 4.2, 5.7, 8.5, 11.9, 15.2, 17.0, 16.6, 14.2, 10.3, 6.6, 4.8]}
   marker={marker}
/>
and
series : [{
 type: 'spline',
 name: 'london',
 data: [3.9, 4.2, 5.7, 8.5, 11.9, 15.2, 17.0, 16.6, 14.2, 10.3, 6.6, 4.8],
 marker: { symbol: 'circle' }
}]
both are also same.
important: in most cases, the name of configuration options and the name of components and their props are same.
now the point is how we will find the name of configuration options. well for that we will use highcharts documentation https://api.highcharts.com/highcharts/ .
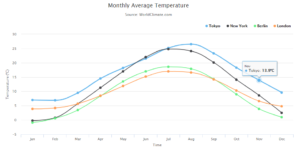
here is an example of a spline chart.
import react from 'react';
import highcharts from 'highcharts';
import {
  highchartschart, chart, withhighcharts, xaxis, yaxis, title, subtitle, legend, splineseries
} from 'react-jsx-highcharts';

// we need to study highcharts docs for cofiguration in json formate..
// click on this link (ctrl +  left click)  https://api.highcharts.com/highcharts/

  const plotoptions = {
    series: {
      animation:{
        duration: 5000
      }
    }
  };
  const categories= ['jan', 'feb', 'mar', 'apr', 'may', 'jun', 'jul', 'aug', 'sep', 'oct', 'nov', 'dec'];
 const labels= {
    style: {
        fontsize:'20px'
    }
  }

const marker= {
  symbol: 'circle',
}

var tooltip = {
  valuesuffix: '\xb0c'
}
const app = () => (
  <div classname="app" style={{marginleft: '200px', marginright: '200px', fontsize:'20px' }}>
      <highchartschart
        plotoptions={plotoptions}
        tooltip={tooltip}
        marginleft={300}
      >
      <chart height={500}/>

      <title
        align='center'>
        monthly average temperature
      </title>

      <subtitle>source: worldclimate.com</subtitle>

      <xaxis categories={categories} lable = {labels}>
        <xaxis.title >time</xaxis.title>
      </xaxis>

      <legend
        layout="horizontal"
        align="right"
        verticalalign='top'
        borderwidth={0}
        symbolradius={0}
        symbolwidth={5}
      />
      <yaxis>
        <yaxis.title >{'temperature (\xb0c)'}</yaxis.title>
        <splineseries
          name= 'tokyo'
          data= {[7.0, 6.9, 9.5, 14.5, 18.2, 21.5, 25.2,26.5, 23.3, 18.3, 13.9, 9.6]}
          marker= {marker}
        />
        <splineseries
          name= 'new york'
          data= {[-0.2, 0.8, 5.7, 11.3, 17.0, 22.0, 24.8, 24.1, 20.1, 14.1, 8.6, 2.5]}
          marker= {marker}
        />
        <splineseries
          name="berlin"
          data={[-0.9, 0.6, 3.5, 8.4, 13.5, 17.0, 18.6, 17.9, 14.3, 9.0, 3.9, 1.0]}
          marker={marker}
        />
        <splineseries
          name= 'london'
          data= {[3.9, 4.2, 5.7, 8.5, 11.9, 15.2, 17.0, 16.6, 14.2, 10.3, 6.6, 4.8]}
          marker= {marker}
        />
      </yaxis>
    </highchartschart>
  </div>
);

export default withhighcharts(app, highcharts);
output
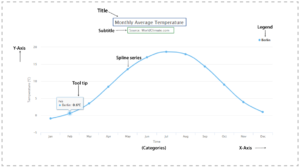
following image shows the chart with configuration headings...
Published at DZone with permission of Ajit Shrivastava. See the original article here.
Opinions expressed by DZone contributors are their own.
Comments