Java Memory and CPU Monitoring Tools and Techniques
This comprehensive look at Java monitoring tools and commands will make sure you get the data you need to make your apps a success while protecting your prod environment.
Join the DZone community and get the full member experience.
Join For FreeThis article talks about the basic commands, tools, and techniques to monitor JVM’s Memory and CPU. I will be providing details about the nuances of these tools and when and how they could be used. I believe, a Java developer should leverage some of these techniques to fine-tune the code and set the right JVM parameters, while taking the code, all the way from development to production.
We will be using JVisualVM extensively to demo memory and CPU monitoring.
Note: Since this article will be touching base on most of the monitoring techniques, we will try to be precise in illustrating them. Still, we'll provide appropriate links to documentation and articles, which will have more information about a particular topic. I would want to keep this article as simple and unique as possible and do not want to duplicate the work and effort of my fellow technical comrades.
1. Basic Linux Commands to Monitor Memory and CPU
a) free –m
This command provides the total free and used memory information of your VM/node.
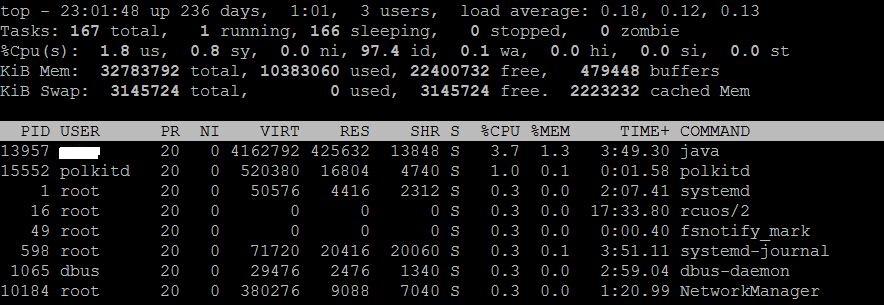
b) top
This command provides CPU and memory utilization.
Hitting “1” on the Keyboard, when top is running will show all the available CPUs and the utilization of each CPU.
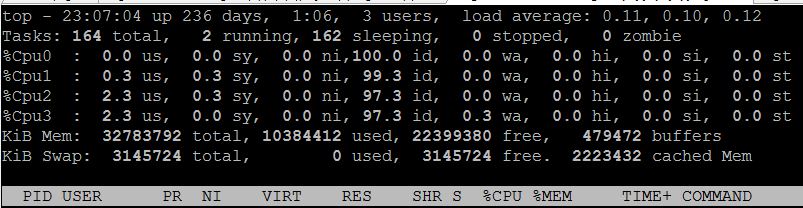 The above screenshot shows that there are four CPUs (Cpu0, Cpu1, Cpu2, Cpu3) and their utilization statistics.
c) meminfo and cpuinfo.
The following commands provide detailed information about the VM/node’s memory and processors.
$cat /proc/cpuinfo
$cat /proc/meminfo
d) CPU and Memory utilization of a particular process.
$ps -p [pid] -o %cpu,%mem,cmd

This command provides the CPU and memory utilization of a process (in our case, the Java application). It also shows which command has started this process.
e) Thread statistics of the Java process.
$ps uH –p [pid]
This command provides the number of threads in a process and their statistics.
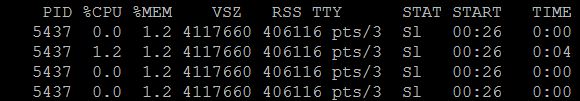
It provides insight into how much memory and CPU each thread utilizes and how long have they been running.
Note: When an application is experiencing slowness or is unresponsive, these commands would be very handy to perform preliminary investigations before jumping into memory and thread dumps. Some of the important commands for preliminary investigation apart from memory and CPU statistics are as follows.
- df –k --> to check disk space
- lsof -i :<port> --> To check, whether a particular port is open
- lsof –i: tcp --> All the ESTABLISHED and LISTENING TCP connections.
- netstat -plunt --> Network connectivity
2. Enabling JMX Ports
We can enable the JMX Remote ports by adding the following system parameters while starting the java application.
-Dcom.sun.management.jmxremote
-Dcom.sun.management.jmxremote.port=<Port>
-Dcom.sun.management.jmxremote.
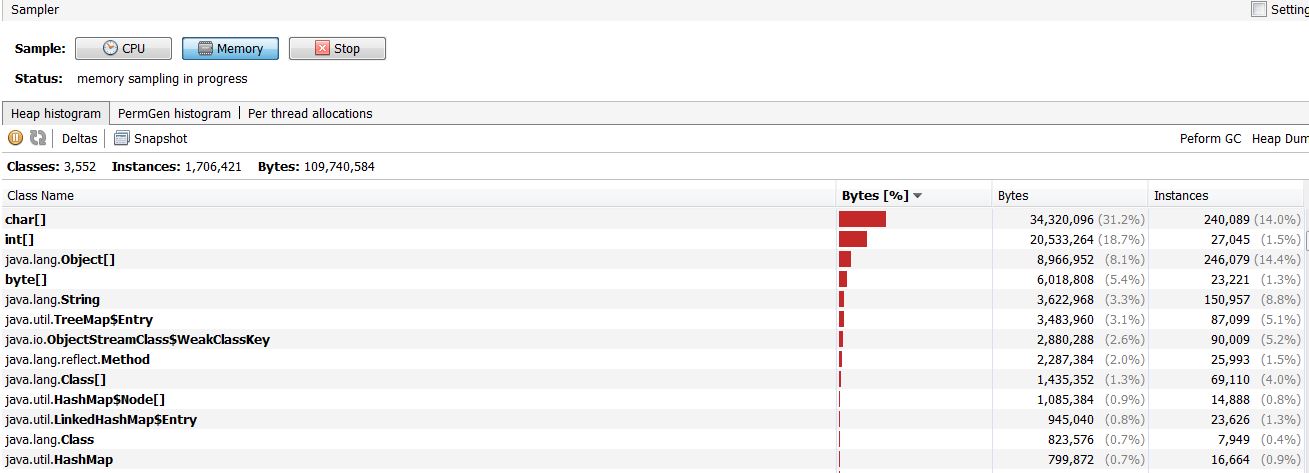
-Dcom.sun.management.jmxremote.We can use JVisualVM to connect to the remote machine and view the CPU utilization, memory sampling, threads, etc. You can also generate a thread dump and memory dump on the remote machine from JVisualVM when connected through the JMX Remote port.
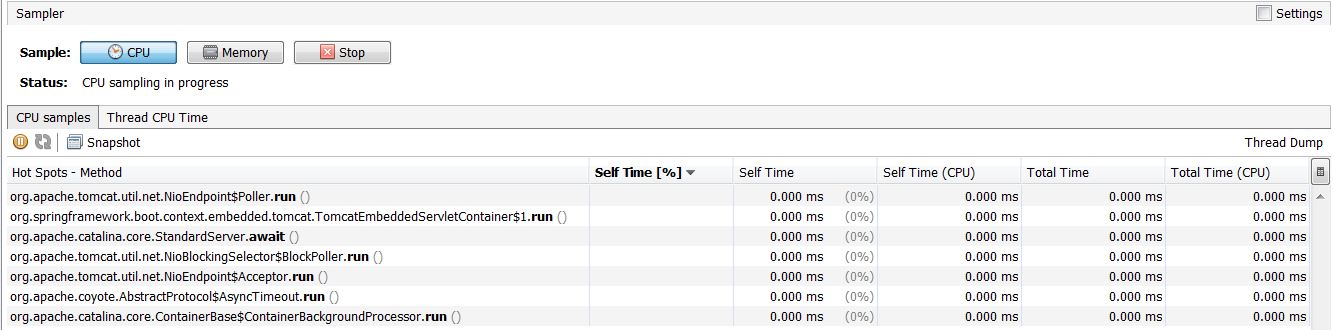
The port mentioned in -Dcom.sun.management.jmxremote.port=<Port> is the RMI registry port. The JVM generates another random port for the RMI Server, which JVM client (in our case JVisualVM) uses to communicate via the stub with the JVM to get the Instrumentation objects. The stub is acquired from the RMI registry. Some of the datacenter and corporate network firewall prevents connectivity to the Random Ports due to security reasons. You might not be able to connect to the java application from JConsole or JVisualVM, if this Firewall setting is done.
JDK 7 and above, provides a way to overcome this, by providing an option to set an additional system property, which will force the RMI server to open a predefined port instead of a Random generated Port.
-Dcom.sun.management.jmxremote.rmi.port=[New RMI Port]
This predefined port can be configured in the Firewall.
We can also set the same port for both -Dcom.sun.management.jmxremote.rmi.port and -Dcom.sun.management.jmxremote.port
Important Note: Enabling JMX Port on the application introduces additional overhead on the JVM as the RMI Registry, RMI Server, Instrumentation and communication with the Client (JVisualVM) to exchange statistical information is part of the same JVM process. This will impact the application performance to a certain extent. Therefore, I would recommend monitoring the JVM and applying all the necessary fixes be done in the pre-prod environments and keep the production environment as light as possible.
3. Native Profiling Agent (-Agentpath)
Many profiling tools that are built using native libraries are written specifically for a platform/OS (E.g. Windows, Linux, MacOS). –Agentpath is the VM option to configure the installed agent library when starting the application.
E.g. java –agentpath:/usr/profiler/lib/[agent].so -jar application.jar
Once the profiler’s native agent library is configured in the remote server. The profiler’s user interface can be connected to the remote server for profiling.
Most of the profiling tools like JProfiler, Yourkit, etc. leverage the native agents for profiling.
4. Java Profiling Agent (-Javaagent)
Profiling agents written in Java can be loaded for instrumentation using the –javaagent VM option. We can build a lightweight custom instrumentation agent in Java by following simple steps.
The instrumentation agent class should have a premain() method
The agent class should be configured as a Pre-Main class in the MANIFEST.MF file of the JAR file, in which the agent and its dependent classes are bundled.
The JVM should be started with –javaagent as shown below.
java -javaagent:agent.jar -jar application.jar
Since the premain() method of the agent class is called before the main() method of the application, -javaagent should always precede -jar.
Note: If the custom instrumentation requires the agent to be loaded after the application’s main() method is called, then we need to have an agentmain() method in a separate Agent Class and it should be configured as Agent-Main class in the MANIFEST.MF file
There are few articles that can provide more details about this technique. Here are some links for more information.
Some of the prominent APM tools like CA's AppDynamics leverages the –javagent to configure its remote Agents.
5. Agent Library (-Agentlib)
-Agentlib is a VM parameter to load a native library during the JVM startup. It is significantly used for two purposes. Loading HPROF and to run the JVM in debugger mode.
Using HPROF.
HPROF is a tool to profile Heap and CPU, which is shipped along with Java. It can be used during development, to build the code efficiently. –agentlib:hprof and –Xrunhprof are the commonly used VM parameters to enable HPROF. The JVM creates a huge file with the name java.hprof.txt after it shuts down. This contains information about heap profiles, allocated memories to instances, dynamic stack traces, etc.
java agentlib:hprof=heap=sites Hello.java
HPROF can be run during compilation too (javac). So that the developer can figure out the deficiencies in the code, even before running the application.
javac -J-agentlib:hprof=heap=sites Hello.java
Please refer the following links, which provides enough information with examples.
Running an Application in Debug Mode
Running an application in debug mode is enabled by using the –agentlib:jdwp VM parameter. This option loads the JVM’s in-process debugging libraries.
java -agentlib:jdwp=transport=dt_socket,address=127.0.0.1:9001,
server=y,suspend=y –jar application.jar
This parameter helps in debugging an application running in a remote machine using an IDE.
Simple Steps
Run the Java application in the debugger mode using the above command (locally/remotely).
You will see, the application listening on the specified port in the logs and will not proceed further until step (ii) is complete.
Snapshot from the application log: Listening for transport dt_socket at address: 9001
Open the project (source code) in your IDE in debug mode and attach the code to the Host and Port as shown below. (Eclipse IDE)
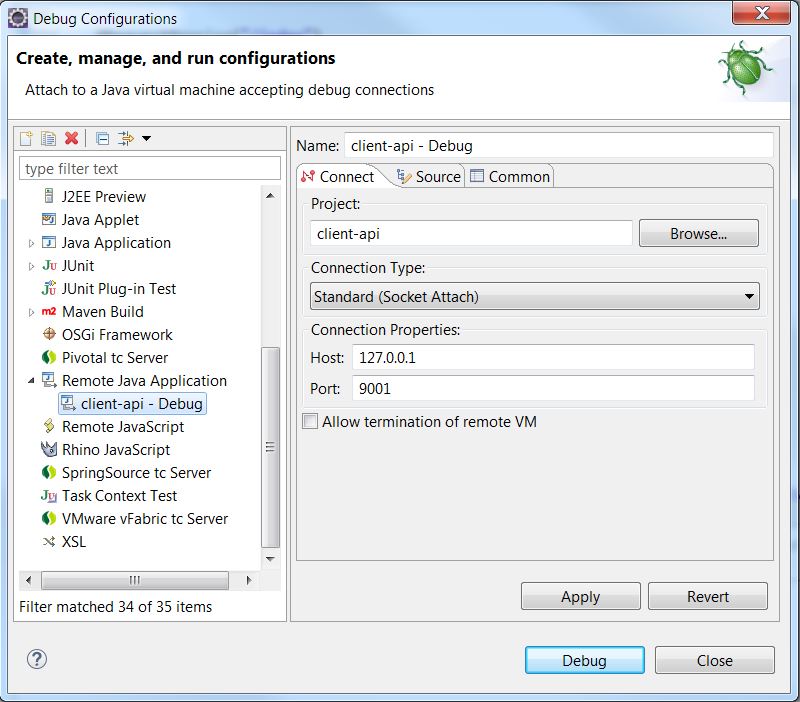
You should be able to debug the code on the remote server as if being done locally on the IDE.
Refer to this link to get more insights into this command line parameter.
Note: Enabling debugger mode on a production environment is not a good option.
6. Using Jstatd
This is an RMI server application that monitors the JVMs on the server and allows the client monitoring tools like JVisualVM/JConsole to connect.
Steps to Set Up Jstatd
Create a file named jstatd.all.policy and add the following entry in the file.
grant codebase "file:${java.home}/../lib/tools.jar"
{ permission java.security.AllPermission;};
Then, run the following command in the directory, where this file (jstatd.all.policy) resides
jstatd -J-Djava.security.policy=jstatd.all.policy &
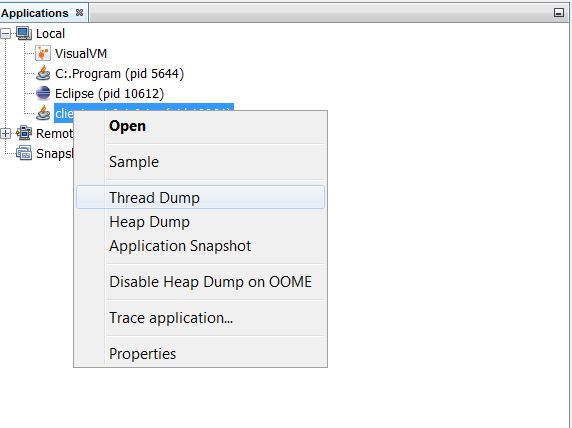
When you add a particular node/server (on which the jstatd is runing) to the JVisualVM, you will notice that all the Java processes running on the node are available for monitoring, but not sampling. You can only monitor the summary of the CPU, memory, loaded classes, and threads.
Because we are setting the security policy as “java.security.AllPermission,” it is not safe to run this tool in a production environment.
More details can be found in these links.
7. Using Jmap and Jstack
The jmap and jstack commands are used to export the Memory dump and Thread dumps respectively from the JVM.
Memory Dump
jmap -F -dump:file=[file path]/heapdump.hprof [pid]
Thread Dump
jstack -l [pid] > thread-sampling.tdump
These dumps can be imported into JVisualVM for further analysis.
Generating memory and thread dumps on a remote machine can be done by providing the hostname/IP address of the remote machine in the jmap/jstack commands.
jmap -F -dump:file=[file path[/heapdump.hprof [pid] [remote hostname/IP address]
jstack -l [pid] [remote hostname/IP address] > thread-sampling.tdump
But, this requires a jsadebugd service running on the server. More details can be found here.
A very important point to remember is that jmap and jstack are bundled with the JDK and not JRE. So, if you are under the impression that you can get a memory dump from a runtime environment using jmap, you better ensure you have the JDK, too. Generally, when you request for a VM/server with Java, your server team might end up providing a VM with JRE because JRE is all that you need to run a Java application.
Note: Extracting the memory dump when the application is running should be considered as a last resort on a production server. The application completely hangs for minutes (based on how much memory has been occupied) until the dump is created.
8. Setting the Right Minimum, Maximum Memory, Garbage Collector, and Stack Heap Ratios
Setting the right minimum memory, maximum memory, garbage collectors, and Heap Ratios varies from application to application. The right parameters can be set by performing load tests and a lot of trial and error. During load testing, make sure to set some of these VM parameters:
-XX:+PrintGCTimeStamps -XX:+PrintGCDetails -Xloggc:<log path>/gc.log
-verbose:gc. And you'll want to analyze your logs to make sure everything's going as planned.
Note: The VM parameters to print GC details are not recommended for your production environment, as the file I/O is a costly operation (even for printing GC-related information), which might impact the performance of the application.
It is very important to set some of the VM Parameters given below.
-Xms --> Minimum Memory
-Xmx --> Maximum Memory
-Xmn --> Heap of Younger Generation
-Xss --> Thread Stack Size
-XX:MaxMetaspaceSize --> Maximum Memory for Non-Heap Metaspace.
-XX:NewRatio --> Ratio between Younger and Older Generation Memory sizes.
-XX:ParallelGCThreads --> No of Parallel GC threads. By default, the GC threads will be equal to the number of CPUs of the Node / VM. Used when Parallel Garbage collectors are configured.
Refer to the section [Non-Standard Options] of this link for more details on the above VM parameters.
Set the right GC based on the load testing results:
[-XX:+UseG1GC / -XX:+UseParallelGC / -XX:+UseParNewGC]
Note: Enabling -XX:+UseParallelGC automatically enables -XX:+UseParallelOldGC and vice-versa.
Refer to this link for more info on GC tuning.
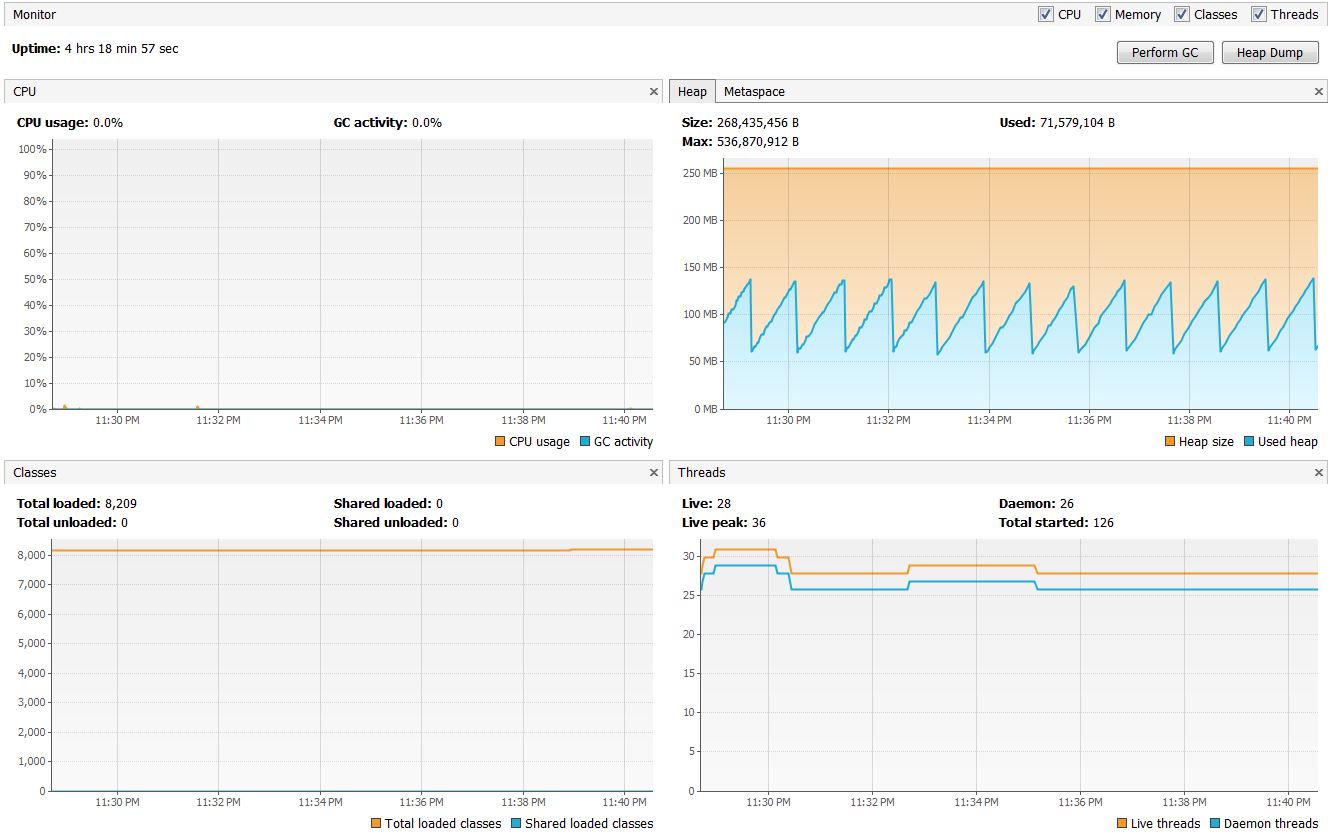
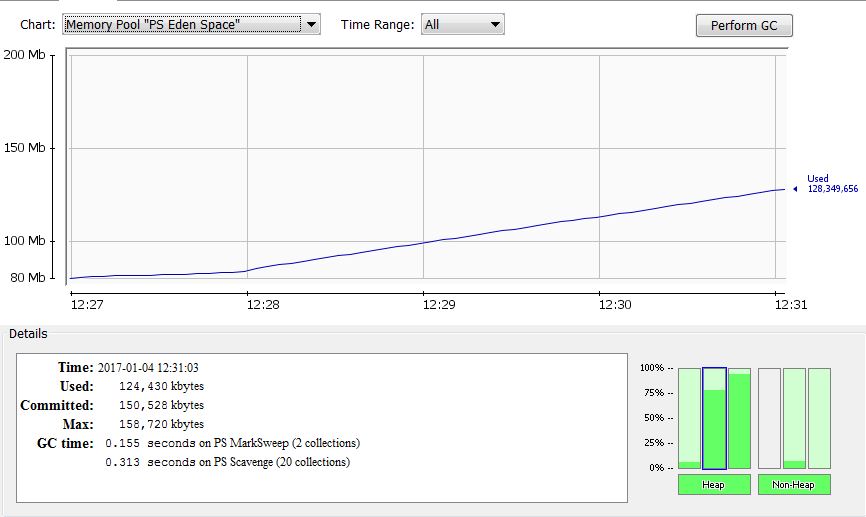
You can use [JConsole] or [JVisiualVM with JConsole / Visual GC plugin] to monitor all the heap and non-heap memory buckets during load testing.
9. Setting the VM Parameter to Generate a Memory dump File Upon an “Out of Memory ” Error
It is very important to obtain a memory dump file when JVM crashes due to the “Out of Memory” error so that it can be analyzed later. This can be achieved by adding the following VM parameters.
-XX:+HeapDumpOnOutOfMemoryError -XX:HeapDumpPath=[file path]
This will enable the .hprof file to be created in the path specified in –XX:HeapDumpPath when the “Out of Memory” error occurs. This is like a flight’s black box, which is required to analyze the cause of the crash.
Conclusion
I am not recommending any specific methodology to monitor your java application and apply appropriate fixes as the behavior of the system varies from application to application. I have collated most of the available options for monitoring purposes. It is the developer or the architect’s choice to use the right tool based on the kind of application they are building. One should note that every tool and monitoring method comes with the cost, whether it's application performance or financial, if you have to license it.
Opinions expressed by DZone contributors are their own.
Comments