Java Out of Memory Heap Analysis
This deep dive into OOM errors and heap analysis will help you identify the root causes of your Java app's memory problems and educate you about GC as well.
Join the DZone community and get the full member experience.
Join For FreeAny software developer who has worked with Java-based enterprise-class backend applications would have run into this infamous or awkward error from a customer or QA engineer: java.lang.OutOfMemoryError: Java heap space.
To understand this, we have to go back to the computer science fundamentals of the complexity of algorithms, specifically "space" complexity. If we recall, every application has a worst-case performance. Specifically, in the memory dimension, when this is unpredictable or is spiky, more than the recommended memory is being allocated to the application. That leads to an over-usage of the heap memory allocated and hence an "out of memory" condition.
The worst part of this specific condition is that the application cannot recover and will crash. Any attempts to restart the application — even with more max memory (-Xmx option) — is not a long-term solution. Without understanding what caused the heap usage inflation or spike, memory usage stability (hence application stability) is not guaranteed. So, what is the more methodical approach to understanding the programming problem related to a memory problem? This is answered by understanding the memory heap of applications and the distribution when the out of memory happens.
With this prelude, we will focus on the following:
- Getting a heap dump from a Java process when it goes out of memory.
- Understanding the type of memory issue the application is suffering from.
- Analyzing out of memory issues with a heap analyzer, specifically with this great open source project: Eclipse MAT.
Setting Up the Application Ready for Heap Analysis
Any non-deterministic or sporadic problems like an out of memory error would be a challenge to do any post-mortem on. So, the best way to handle OOMs is to let the JVM dump a heap file of the state of the memory of the JVM when it went out of memory.
Sun HotSpot JVM has a way to instruct the JVM to dump its heap state when the JVM runs out of memory into a file. This standard format is .hprof. So, to enable this feature, add XX:+HeapDumpOnOutOfMemoryError to the JVM startup options. Adding this option is essential to production systems since out of memory could take a long time to happen. This flag adds little or no performance overhead to the application.
If the heap dump .hprof file has to be written to a specific file system location, then add the directory path to XX:HeapDumpPath. Just make sure the application has write permissions for the particular directory path given here.
Cause Analysis
101: Know the Nature of the Out of Memory Error
The most preliminary thing to understand when trying to assess and understand an out of memory error the memory growth characteristics. Make your conclusions about the following possibilities:
- Spikes in usage: This type of OOM could be drastic based on the type of load. An application can be performing well under allocated memory for the JVM for 20 users. But if there was a spike for the 100th user, it might have hit a memory spike which leads to the out of memory error. There are two possibilities to tackle this cause.
- Leaks: This is where the memory usage increases over time which is a problem due to a programming issue.

A healthy graph with healthy GC collection.
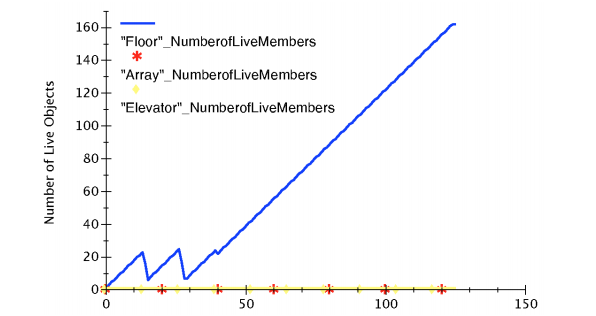
A leak chart that increases over time after a healthy GC collection pattern

A memory graph that led to spiky memory usage, leading to OOM.
After we understand the nature of the memory issue that caused usage to surge, the following methodology might be used to avoid hitting the OOM error based on what inference comes out of the heap analysis.
Fixing a Memory Issue
- Fix the OOM-causing code: Since an object was added incrementally without clearing its reference (from the object reference of the running application) over a period of time by the application, the programming error has to be fixed. For instance, this could be a hash table that was inserted with business objects incrementally without deleting them after the business logic and transaction were completed.
- Increase the maximum memory as a fix: After understanding the runtime memory characteristics and the heap, the maximum heap memory allocated might have to be increased to avoid OOM errors again, since the suggested maximum memory was not enough for application stability. So, the application might have to be updated to run with a Java -Xmx flag with a higher value based on the assessment made from the heap analysis.
Heap Analysis
We will be exploring in detail below how to analyze a heap dump using a heap analysis tool. In our case, we will be using the open source tool MAT by the Eclipse Foundation.
Heap Analysis Using MAT
Now time for the deep dive. We will go through a sequence of steps that will help explore the different features and views of MAT to get to an example of an OOM heap dump and think through the analysis.
- Open the heap (.hprof) generated when the OOM error happened. Make sure to copy the dump file to a dedicated folder since MAT creates lots of index files: File -> open
- This opens the dump with options for Leak Suspect Reports and Component Reports. Choose to run the Leak Suspect report.

- When the leak suspect chart opens, the pie in the overview pane shows the distribution of retained memory on a per-object basis. It shows the biggest objects in memory (objects that have high retained memory — memory accumulated by it and the objects that it references).
- The pie chart above shows 3 problem suspects by aggregating objects which hold the highest aggregated memory references (including shallow and retained).
Let us look at one at a time and assess whether it could be the root cause of the OOM error:
Suspect 1
454,570 instances of "java.lang.ref.Finalizer", loaded by "<system class loader>" occupy 790,205,576 (47.96%) bytes.
The above tells us that there were 454,570 JVM finalizer instances occupying almost 50% of the allocated application memory.
Oops! What does this lead us to understand, based on the basic assumption that the reader knows what Java Finalizers do?
Read here for a primer: http://stackoverflow.com/questions/2860121/why-do-finalizers-have-a-severe-performance-penalty
Essentially, there are custom finalizers written by the developer to release certain resources held by an instance. These instances that are collected by the finalizers are collected outside the scope of the JVM GC collection algorithms using a separate queue. Essentially, this is a longer path to cleaning up by the GC. So now we are at a point where we are trying to understand what is getting finalized by these finalizers?
Potentially, Suspect2 which is sun.security.ssl.SSLSocketImpl which is occupying 20% of the memory. Can we confirm if these are the instances held to be cleared by the finalizers?
Suspect 2
Now, let us open the Dominator view, which is under the tool button on the top of MAT. We see all the instances by class name listed, parsed by MAT and available on the heap dump.
Next, in the Dominator view, we will try to understand the relationship between java.lang.Finalizer and sun.security.ssl.SSLSocketImpl. We right-click on the sun.security.ssl.SSLSocketImpl row and open a Path to GC Roots -> exclude soft/weak references.

Now, MAT will start calculating the memory graph to show the paths to the GC root where this instance is referenced. This will show up with another page, showing the references as below:

As the above reference chain shows, the instance SSLSocketImpl is held by a reference from java.lang.ref.Finalizer, which is about 88k of the retained heap by itself at that level. And we could also notice that the finalizer chain is a linked list data structure with next pointers.
INFERENCE: At this point, we have a clear hint that the Java finalizer is trying to collect SSLSocketImpl objects. For an explanation of why so many of them are not collected, we start reviewing code.
Inspect code
Code inspection is needed at this point to see if sockets/the I/O stream are closed with finally clauses. In this case, it revealed that all streams related to I/O were, in fact, correctly closed. At this point, we doubt the JVM is the culprit. And, in fact, that was the case: There was a bug in Open JDK 6.0.XX's GC collection code.
I hope this article gives you a model to analyze heap dumps and infer root causes in Java applications. Happy heap analysis!
Extra Reading
Shallow vs. Retained Heap
Shallow heap is the memory consumed by one object. An object needs 32 or 64 bits (depending on the OS architecture) per reference, 4 bytes per Integer, 8 bytes per Long, etc. Depending on the heap dump format, the size may be adjusted (e.g. aligned to 8, etc.) to better model the real consumption of the VM.
A retained set of X is the set of objects that would be removed by GC when X is garbage collected.
A retained heap of X is the sum of shallow sizes of all objects in the retained set of X, i.e. memory kept alive by X.
Generally speaking, the shallow heap of an object is its size in the heap. The retained size of the same object is the amount of heap memory that will be freed when the object is garbage collected.
The retained set for a leading set of objects, such as all objects of a particular class or all objects of all classes loaded by a particular class loader or simply a bunch of arbitrary objects, is the set of objects that is released if all objects of that leading set become inaccessible. The retained set includes these objects as well as all other objects only accessible through these objects. The retained size is the total heap size of all objects contained in the retained set.
Opinions expressed by DZone contributors are their own.
Comments