This
article will provide you with a tutorial on how you can quickly
pinpoint the Java Thread contributors to a high CPU problem on the
Windows OS. Windows, like other OS such as Linux, Solaris & AIX
allow you to monitor the CPU utilization at the process level but also
for individual Thread executing a task within a process.
For this tutorial, we created a simple Java program that will allow you to learn this technique in a step by step manner.
Troubleshooting tools
The following tools will be used below for this tutorial:
- Windows Process Explorer (to pinpoint high CPU Thread contributors)
- JVM Thread Dump (for Thread correlation and root cause analysis at code level)
High CPU simulator Java program
The
simple program below is simply looping and creating new String objects.
It will allow us to perform this CPU per Thread analysis. I recommend
that you import it in an IDE of your choice e.g. Eclipse and run it from
there. You should observe an increase of CPU on your Windows machine as
soon as you execute it.package org.ph.javaee.tool.cpu;
/**
* HighCPUSimulator
* @author Pierre-Hugues Charbonneau
* http://javaeesupportpatterns.blogspot.com
*
*/
public class HighCPUSimulator {
private final static int NB_ITERATIONS = 500000000;
// ~1 KB data footprint
private final static String DATA_PREFIX = "datadatadatadatadatadatadatadatadatadatadatadatadatadatadatadatadatadatadatadatadatadatadatadatadatadatadatadatadatadatadatadatadatadatadatadatadatadatadatadatadatadatadatadatadatadatadatadatadatadatadatadatadatadatadatadatadatadatadatadatadatadatadatadatadatadatadatadatadatadatadatadatadatadatadatadatadatadatadatadatadatadatadatadatadatadatadatadatadatadatadatadatadatadatadatadatadatadatadatadatadatadatadatadatadatadatadatadatadatadatadatadatadatadatadatadatadatadatadata";
/**
* @param args
*/
public static void main(String[] args) {
System.out.println("HIGH CPU Simulator 1.0");
System.out.println("Author: Pierre-Hugues Charbonneau");
System.out.println("http://javaeesupportpatterns.blogspot.com/");
try {
for (int i = 0; i < NB_ITERATIONS; i++) {

                           // Perform some String manipulations to slowdown and expose looping process...
                           String data = DATA_PREFIX + i;

                    }
} catch (Throwable any) {
System.out.println("Unexpected Exception! " + any.getMessage()
+ " [" + any + "]");
}
System.out.println("HighCPUSimulator done!");
}
}
Step #1 – Launch Process Explorer
The
Process Explorer tool visually shows the CPU usage dynamically. It is
good for live analysis. If you need historical data on CPU per Thread
then you can also use Windows perfmon with % Processor Time & Thread Id data counters. You can download Process Explorer from the link below:
http://technet.microsoft.com/en-us/sysinternals/bb896653
In
our example, you can see that the Eclipse javaw.exe process is now
using ~25% of total CPU utilization following the execution of our
sample program.
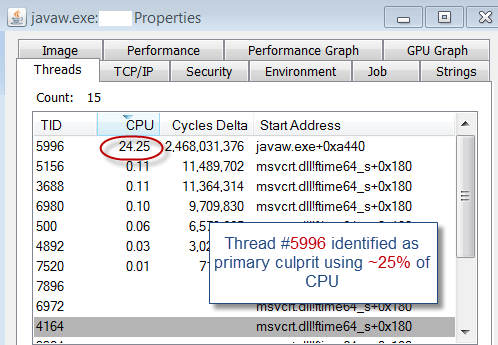
Step #2 – Launch Process Explorer Threads view
The
next step is to display the Threads view of the javaw.exe process.
Simply right click on the javaw.exe process and select Properties. The
Threads view will be opened as per below snapshot:
- The first column is the Thread Id (decimal format)
- The second column is the CPU utilization % used by each Thread
- The third column is also another counter indicating if Thread is running on the CPU
In our example, we can see our primary culprit is Thread Id #5996 using ~ 25% of CPU.
Step #3 – Generate a JVM Thread Dump
At
this point, Process Explorer will no longer be useful. The goal was to
pinpoint one or multiple Java Threads consuming most of the Java process
CPU utilization which is what we achieved. In order to go the next
level in your analysis you will need to capture a JVM Thread Dump. This
will allow you to correlate the Thread Id with the Thread Stack Trace so
you can pinpoint that type of processing is consuming such high CPU.
JVM Thread Dump generation can be done in a few manners. If you are using JRockit VM you can simply use the jrcmd tool as per below example:
Once
you have the Thread Dump data, simply search for the Thread Id and
locate the Thread Stack Trace that you are interested in.
For
our example, the Thread “Main Thread” which was fired from Eclipse got
exposed as the primary culprit which is exactly what we wanted to
demonstrate."Main Thread" id=1 idx=0x4 tid=5996 prio=5 alive, native_blocked
at org/ph/javaee/tool/cpu/HighCPUSimulator.main
(HighCPUSimulator.java:31)
at jrockit/vm/RNI.c2java(IIIII)V(Native Method)
-- end of trace
Step #4 – Analyze the culprit Thread(s) Stack Trace and determine root cause
At
this point you should have everything that you need to move forward
with the root cause analysis. You will need to review each Thread Stack
Trace and determine what type of problem you are dealing with. That
final step is typically where you will spend most of your time and
problem can be simple such as infinite looping or complex such as
garbage collection related problems.
In
our example, the Thread Dump did reveal the high CPU originates from
our sample Java program around line 31. As expected, it did reveal the
looping condition that we engineered on purpose for this tutorial.for (int i = 0; i < NB_ITERATIONS; i++) {
// Perform some String manipulations to slowdown and expose looping process...
String data = DATA_PREFIX + i;
}
I
hope this tutorial has helped you understand how you can analyze and
help pinpoint root cause of Java CPU problems on Windows OS. Please stay
tuned for more updates, the next article will provide you with a Java
CPU troubleshooting guide including how to tackle that last analysis
step along with common problem patterns.


Comments